Market Sentiment
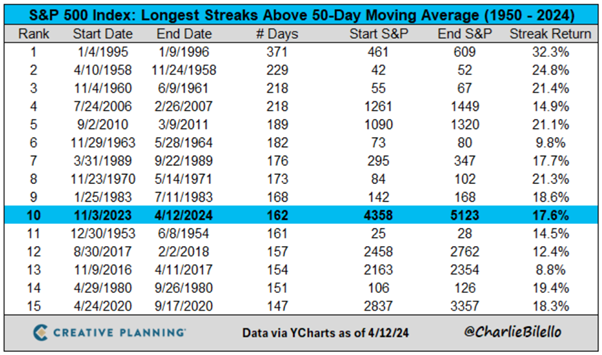
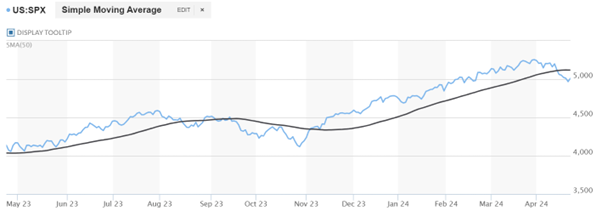
The S&P 500 (SPX500) remained above its 50-day moving average for 162 consecutive days as of 12 April 2024, the 10th longest streak since 1950. It’s very rare to experience such a smooth ride higher and the market hasn’t seen a run like this since 2010-11.
However, this was all prior to 19 April. Tech stocks led a huge drop in the S&P 500 (SPX500) last week, which broke downwards through the 50-day moving average. The S&P 500 (SPX500) tumbled by -5.95% from its all-time high of 5 265 on 28 March 2024 to hit a recent low of 4 953 last Friday, 19 April.
Gold prices slid badly on Monday 22 April, following profit taking, as traders look to US economic data. Gold marked its worst sell-off in two years, falling to 2300/oz. Analysts highlight an improving situation in the Middle East, with Iran downplaying Israel’s response to its missile attack 10 days ago. The dollar and US Treasuries remain near year-to-date highs, with the 10-year sitting at 4.63%. The sharp reversal in gold prices is likely primarily driven by momentum-based algorithmic funds or CTAs, which had been latching onto the previous sharp upswing in gold prices.
Chinese buying fuelled by a steep rise in activity in gold futures on the Shanghai Futures Exchange may also have eased, with a sell-off in base metals across the board supporting this view. Focus now turns to the US Federal Reserve (Fed’s) preferred inflation gauge, the Personal Consumption Expenditures (PCE).
Global Macro
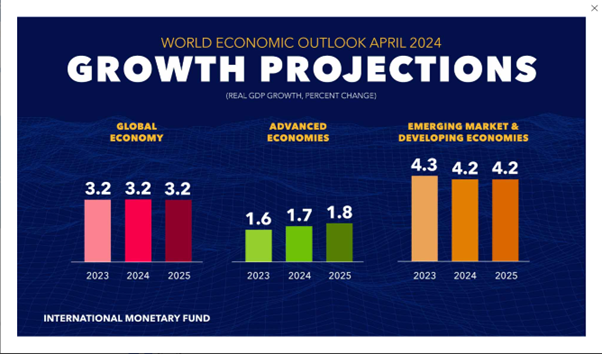
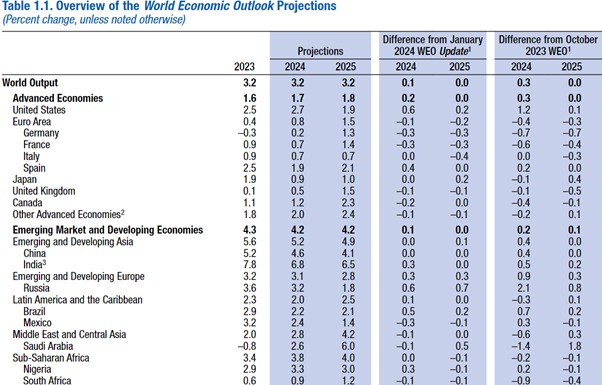
According to the International Monetary Fund (IMF) in its April 16 World Economic Outlook (WEO), “Economic activity was surprisingly resilient through the global disinflation of 2022–23. As global inflation descended from its mid-2022 peak, economic activity grew steadily, defying warnings of stagflation and global recession. Growth in employment and incomes held steady, reflecting supportive demand developments––including greater-than-expected government spending and household consumption—and a supply-side expansion amid, notably, an unanticipated boost to labour force participation. The unexpected economic resilience, despite significant central bank interest rate hikes aimed at restoring price stability, also reflects the ability of households in major advanced economies to draw on substantial savings accumulated during the pandemic.”
In addition, changes in mortgage and housing markets over the pre-pandemic decade of low interest rates moderated the near-term impact of policy rate hikes. As inflation converges toward target levels and central banks pivot toward policy easing in many economies, a tightening of fiscal policies aimed at curbing high government debt, with higher taxes and lower government spending, is expected to weigh on growth.
The US House of Representatives agreed to a USD 60 billion military aid package to Ukraine over the weekend with the bill that is to be signed off by President Biden once Senate votes on the bill. President Zelensky of Ukraine welcomed the assistance calling for a start of an actual transfer of weapons as soon as possible with long range arms and air defence systems being top priorities.
The full bill, which also incorporates US aid to Israel and Taiwan and amounts in total to $95 billion, was passed by the Senate on Tuesday night and is expected to be signed into law by President Biden on Wednesday, 24 April.
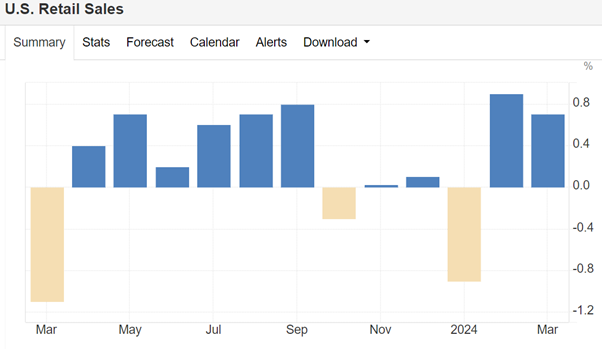
According to the US Census, advance estimates of US retail and food services sales for March 2024, adjusted for seasonal variation and holiday and trading-day differences, but not for price changes, were $709.6 billion, up 0.7 percent (±0.5 percent) from the previous month, and up 4.0 percent (±0.5 percent) above March 2023. Total sales for the January 2024 through March 2024 period were up 2.1 percent (±0.5 percent) from the same period a year ago. The January 2024 to February 2024 percent change was revised from up 0.6 percent (±0.5 percent) to up 0.9 percent (±0.2 percent).
Retail trade sales were up 0.8 percent (±0.5 percent) from February 2024, and up 3.6 percent (±0.5 percent) above last year. Non-store retailers were up 11.3 percent (±1.6 percent) from last year, while food services and drinking places were up 6.5 percent (±2.1 percent) from March 2023.
These figures were above consensus and reflect the continuing strong employment situation in America.
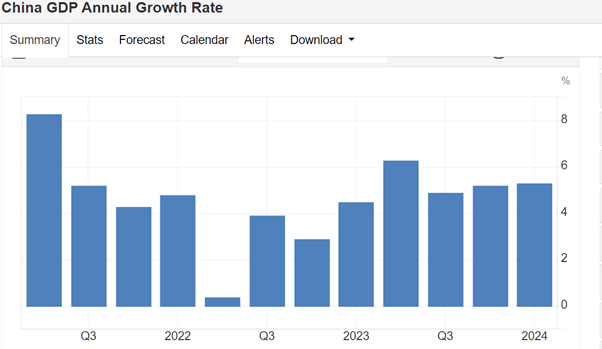
Chinese GDP rose by 5.3% YoY in Q1 2024, up from 5.2% in Q4 2023 and better than the Reuters consensus of 4.6%. Growth was mainly driven by high-tech manufacturing, which contributed to a robust 6.1% increase in industrial production in Q1. Manufacturing of electronic equipment, charging stations for electric vehicles (EVs), and 3D printing soared by 40% YoY in Q1.
Gross fixed capital formation (GFCF) increased by 4.5% (YTD) compared to last year's period – boosted by a 9.9% increase in manufacturing investment, offset by a 9.5% fall in property investment.
Retail sales rose 4.7% in Q1 boosted by increased spending on catering services, cigarettes and alcohol, and sports and entertainment activities. The Chinese Communist Party has set a GDP growth target of around 5% for 2024, and although growth is expected to slow in Q2, the outlook remains promising.
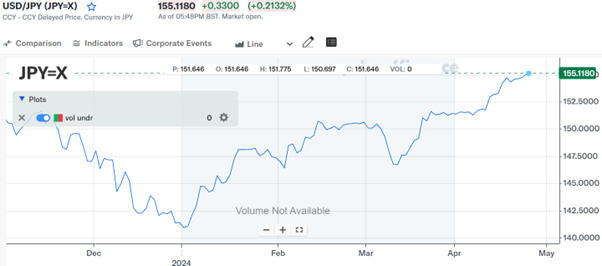
The Japanese yen has been sliding significantly against the US dollar in recent months and this week broke through the psychologically important 155 mark.
Global freight rates continue to decline, notwithstanding the recent bout of increased tensions in the middle east. According to Freightos, following Iran’s missile and drone attack on Israel, and Israel’s retaliatory strike last week, tension between the two may be easing, which may decrease the risk of additional Iranian vessel seizures in the Strait of Hormuz for now.
Iran continues to hold the MSC-operated Aries and its crew, meaning that several hundred India-bound loaded containers will not arrive any time soon, and several thousand export containers waiting to depart from India on the Aries may face delays as well.
India - Middle East shipments may face higher insurance costs as a result of this new threat, and though an escalation of actions by Iran in the strait would likely impact regional container trade operationally and in terms of higher freight rates – and if container flows to Dubai were affected, sea-air traffic through the key UAE hub would also be disrupted – so far there are no additional reports of disruptions and Freightos Terminal rate data ex-India shows no effect either.
Ocean rates beyond the Middle East and S. Asia were not impacted by this latest disruption either. Ex-Asia prices decreased somewhat or were level last week and remain well below their early-year peaks. However, Asia - N. America rates remain 90% higher than in 2019 to the West Coast and 60% higher to the East Coast at about $3,000/forty-foot equivalent unit (FEU) and $4,300/FEU respectively, as Red Sea diversions continue to absorb capacity and make blank sailings rare even during these slow-season months.
Likewise, Asia - N. Europe and Mediterranean prices are each more than double 2019 levels, and while rate announcements for May show some carriers aim to keep prices at about their current $3,300/FEU and $4,300/FEU levels respectively, others plan to introduce general rate increases to try and push N. Europe rates up to $4,500/FEU and Mediterranean prices up to $5,600/FEU.
The Panama Canal Authority has announced that it will further ease low-water restrictions as rainfall increases. The PCA will increase daily transits to 31 by mid-May and to 32 starting in June – just below the pre-drought norm of 36 – and for the first time since restrictions were introduced almost a year ago, they will increase the maximum draft level from 13.41m to 13.71m in mid-June.
In air cargo, a severe storm caused flooding in Dubai that led to a 24-hour closure of the airport plus 300 canceled flights, though operations were expected to recover quickly.
B2C e-commerce volumes continue to be the big driver of demand and worries about available capacity out of China, especially late in the year during air’s peak season. Freightos Air Index rates ex-China remained elevated at $5.18/kg to N. America and $3.55/kg to Europe last week. Some carriers are taking steps to add capacity in response, including CMA CGM’s newly announced transpacific service which will launch in June, though capacity is still expected to get even tighter in Q4.
Any opinions, news, research, analyses, prices or other information contained on this website is provided as general market commentary and does not constitute investment advice. ThinkMarkets will not accept liability for any loss or damage including, without limitation, to any loss of profit which may arise directly or indirectly from use of or reliance on such information.