CFDs are complex instruments and come with a high risk of losing money rapidly due to leverage. 75% of retail investor accounts lose money when trading CFDs with this provider. You should consider whether you understand how CFDs work and whether you can afford to take the high risk of losing your money. Please see full risk disclaimer.
From SPX500 and NAS100 to UK100 and GER40, experience seamless trading on the world’s biggest indices. Trade a wide range of major global indices with all the tools, pricing, and flexibility you need.
Choose from 18 global indices. Diversify without buying individual shares.
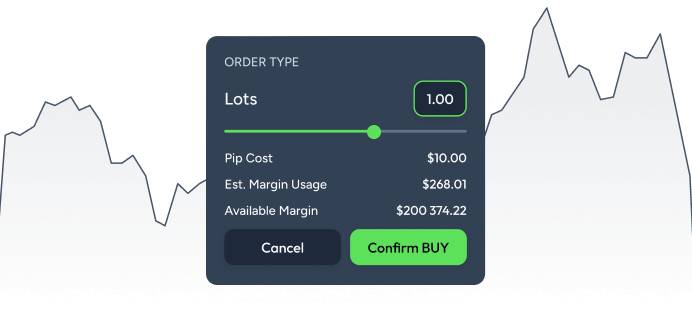
Flexible contract sizes
Start small with minimum trade sizes from just 0.01 lots.
Negative balance protection
Your risk stays limited. Never lose more than you deposit.
Tight, competitive spreads
Trade SPX500 from 0.4 points, GER40 from 0.6, and AUS200 from 1.2.
Why trade indices?
Diversify with one position Gain exposure to dozens or hundreds of companies in a single trade. No need to pick individual stocks.
Trade around the clock Take advantage of 24/5 access to global index markets. Morning, night, and everything in between.
Go long or short Think prices will rise? Buy. Expect a fall? Sell. Profit potential in both directions.
ThinkTrader: Your edge in the index markets.
ThinkTrader is our proprietary platform designed for traders who want more control, innovative tools, and seamless performance. Trade indices on a clean, intuitive interface backed by serious power.
Learn the basics and build confidence at your own pace. Our Trading academy gives you simple, structured guidance on how indices work and how to trade them.
 AE
AE