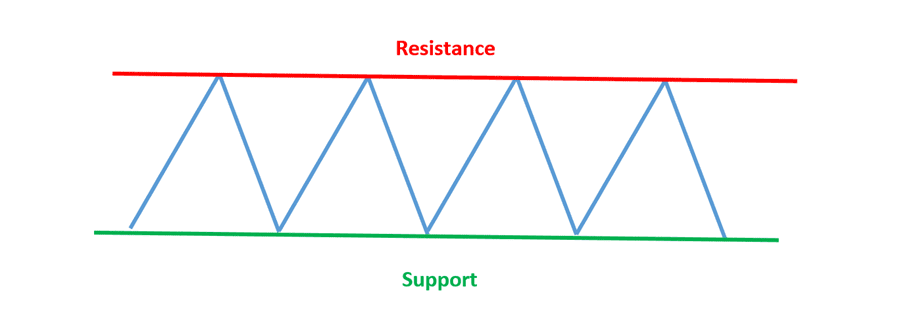
From the above diagram you can see that there are common areas where the price travels to. The lowest point that it reaches and bounces off is known as support, while the highest point that it reaches and bounces off is k nown as resistance. If the price travels down to the support area and fails to break through, then this point is valid support area. To have a valid support or resistance area you need to have the price bars at or near the samer price at least twice.
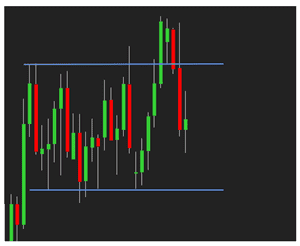 Support and resistance levels are not exact numbers –the level can be broken, when the market tests the price level. If you use a candlestick chart, you may find support and resistance levels pierced by the candlestick wicks.
You can notice here that the wicks of the candle test both the support and resistance levels, and there are times when the wicks break through these levels, yet end up closing back above support or below resistance.
There may be times when the pricing action does break support and resistance level, but simply reverses its move. In the chart above, we see the price break above a resistance level and closes above this level. The price then reverses its move and heads back down. If you bought a position based on the break of the resistance level, your trade would have made a loss. This pricing action is known as false breakout and they can occur frequently. The way you should look at support and resistance levels is by identifying them as zones.
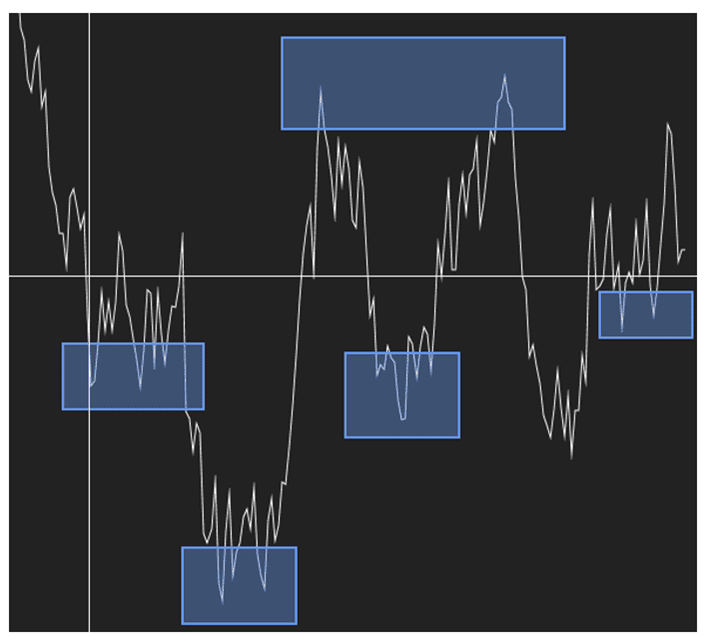
To help you plot support and resistance zones, it’s best if you plot a line chart. To plot zones on a line chart, you need to identify areas where you see several peaks or valleys.
 Trend Lines
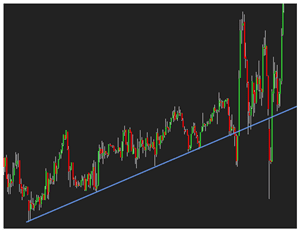
There are three different types of trends – up trends, down trends and sideways trends (also known as consolidation). Generally, the steeper the trendline, the less reliable that trend is, and will most likely to be broken. The more times the price touches the trend line, the more valid the trend is. The following chart shows us that an uptrend is in progress as we have many touches along the trendline. The trend does get broken with certain price swings, but the overall uptrend is left intact as the price continues to rise.
Channels
A channel is where the price action travels between two parallel lines. The upper line is treated as resistance and the lower channel line is treated as support. To draw a channel, simply draw a trendline as you would normally do, then duplicate that line and place it on the opposite side of the pricing action.
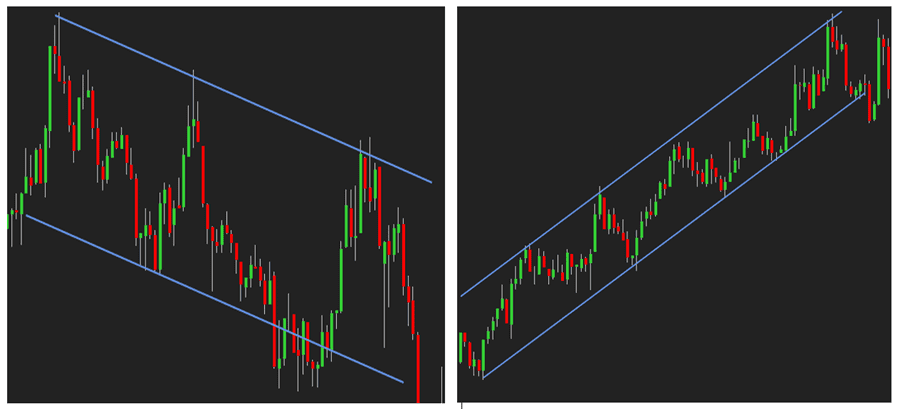
To create an upwards trend channel, simply draw a trend line by connecting at least two troughs and extend this line. Duplicate that line and place on the upper side of the price, along the peaks.
To create a downwards trend channel, simply draw a trend line by connecting at least two peaks and extend this line. Duplicate that line and place on the lower side of the price, along the troughs. The diagrams below show you an upwards trend channel and a downwards trend channel.
When constructing a trend channel, both lines must be parallel to each other. In an upwards trend channel the support line is considered to be the buy zones, while the top of the channel is considered to be the sell zone.