How to trade the spinning top pattern
Trading the spinning top pattern is no different to trading other candlestick formations. As they are considered to be a common candlestick pattern, you may often see a spinning top formation in charts, and thus, you should be prepared to act accordingly.
Looking at the picture below, we have a GBP/USD daily chart.
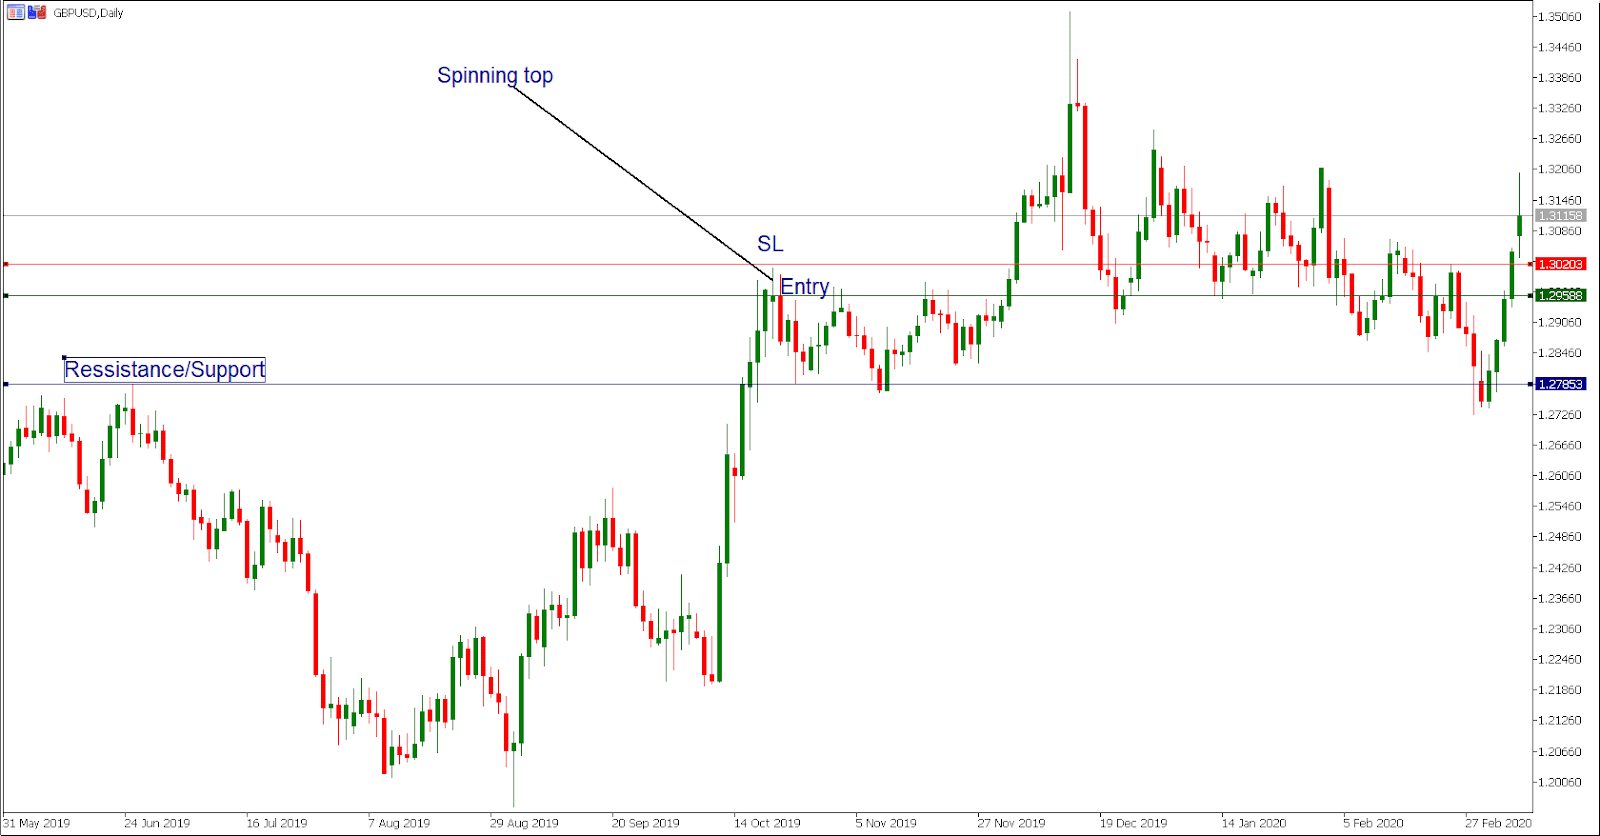
The price action is moving higher to a point where it prints a new short-term high, but the bulls fail to force a high close, so instead, the price closes near the opening price.
An end to a strong impulsive move upside has actually started with a spinning top pattern. You can either wait for a confirmation candle or open a trade as soon as the spinning top formation is created. A stop-loss order should be placed just above the previous high.
With take profits you can be more flexible and this depends on your risk tolerance.
We placed it at the previous resistance, now acting as a support. In the end, the price action rotated lower to retest the support and hit our profit-taking order. We risked 60 pips to make around 170 pips, a situation that offers a great risk-reward ratio.
A similar situation develops in the USD/CAD daily chart below.
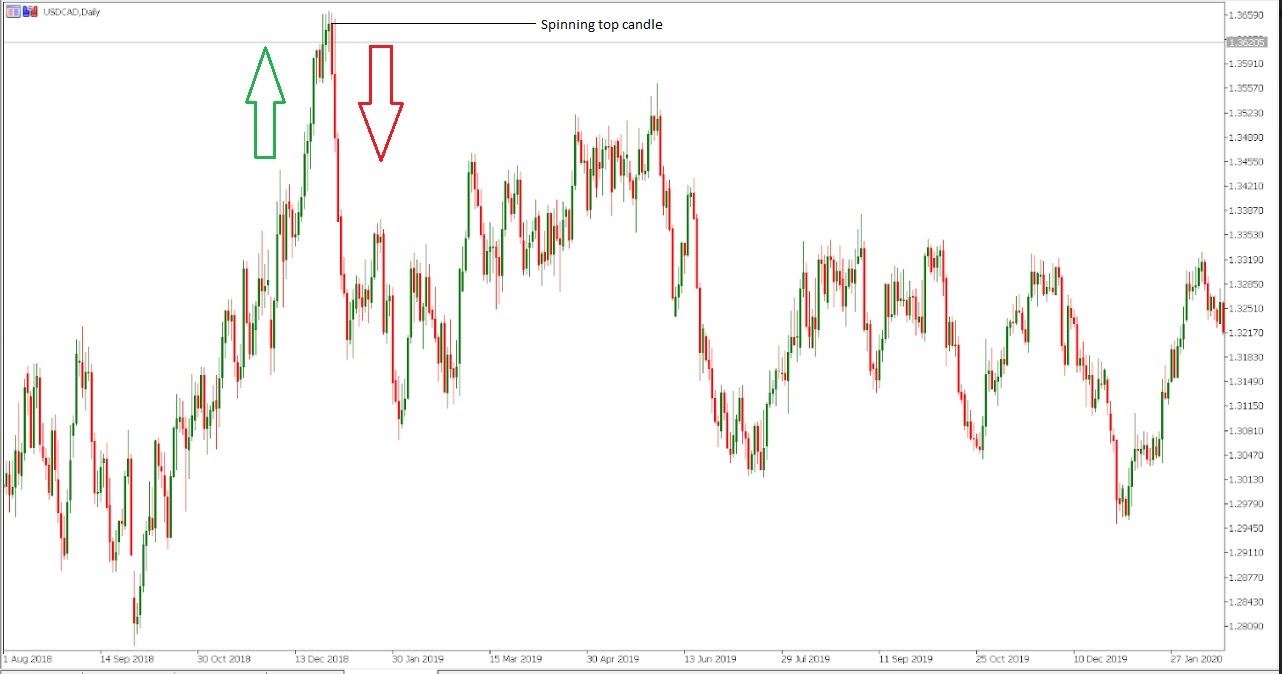
An impulsive bullish move takes place before consolidation takes place at the end of an uptrend, including a spinning top candle, whose top is actually the marginal new high.
The investors realize that the bulls are losing their momentum, as there is a certain degree of hesitation at the top to continue in the same direction. As a result, a sharp move to the downside starts and ultimately, the bulls lose all of their recent gains.
As with the first example, you can choose whether to open a trade immediately after the spinning top pattern is formed, or wait for the next candle and receive further confirmation of an impending reversal.
This chart offers a nice insight into how reversals take place. As you can see, a few candles prior to the spinning top are all sending signals of indecision.
Therefore, it’s not a surprise that there is a change in the trend direction.
Any opinions, news, research, analyses, prices or other information contained on this website is provided as general market commentary and does not constitute investment advice. ThinkMarkets will not accept liability for any loss or damage including, without limitation, to any loss of profit which may arise directly or indirectly from use of or reliance on such information.