How to Trade the RVI
There are many different trading strategies based on the RVI indicator, as it is the case with the RSI and other oscillators. The vast majority of those are centered around either crossovers or divergence.
Here we are sharing a very simple trading strategy that tends to mix these two scenarios - a crossover and divergence. This way we get two signals pointing to the same future development - a reversal.
In a chart below, you see USD/CAD moving lower, below the most recent low. The RVI follows and creates a short-term low, trading extremely close to its minimum levels. Remember that the RVI should only be consulted in the trading markets.
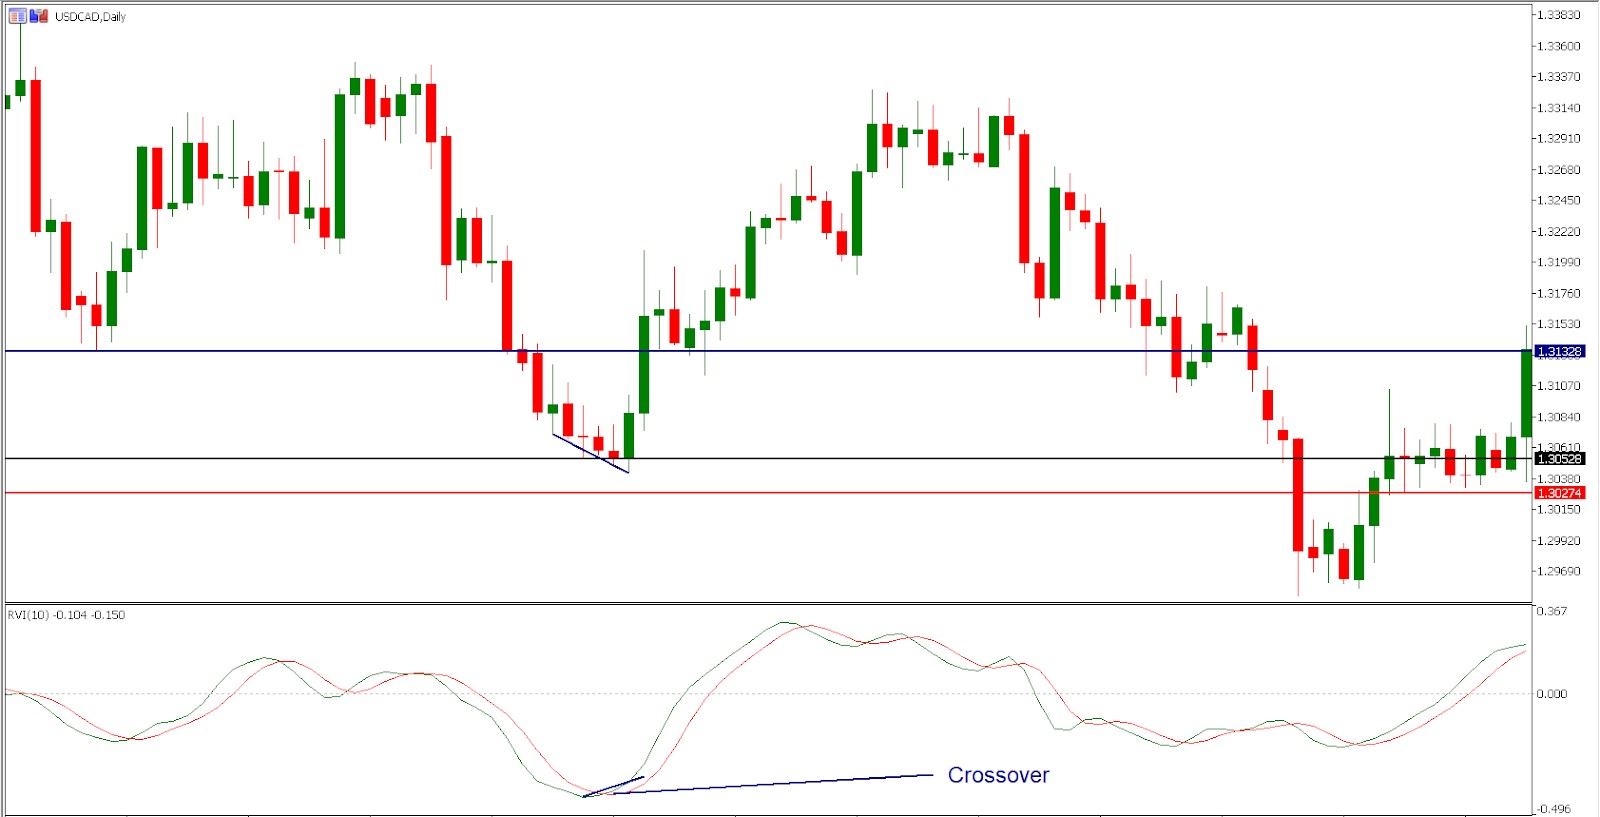
The RVI then generates two bullish signals. First, the crossover occurs as the RVI indicator (the green line) moves above the signal line (the red line), signaling that the trend is likely to change from bearish to bullish.
Secondly, the price action creates a series of consecutive lower lows, a situation which is not confirmed by the RVI, which starting with a crossover continues to move higher. As we noted earlier, this situation is called a bullish divergence and it signals that the price action may start following the RVI higher soon.
At this point, two bullish signals convince us to open a trade and look for a reversal. We opened a long trade aiming to capitalize on the impending trend reversal as the sellers seemed to have run out of gas.
The entry should be placed once both the crossover and the divergence issue bullish signals. The stop loss is placed around 40 pips below, to allow for the price action to potentially create another short term low.
Take profit is determined by searching for a “magnet level” - an important price point that played an important role in the past. This can be either a Fibonacci retracement/extension, moving average, trend line etc. In this case, we use the previous swing low, which is now likely to act as a resistance.
Ultimately, the price action creates a sharp reversal, surging higher and hitting our take profit order in just two days. In this trade, we risked 40 pips to make around 80 pips, which translates to a 1:2 risk-reward.
Any opinions, news, research, analyses, prices or other information contained on this website is provided as general market commentary and does not constitute investment advice. ThinkMarkets will not accept liability for any loss or damage including, without limitation, to any loss of profit which may arise directly or indirectly from use of or reliance on such information.