Trading With the Bill Williams Fractal Indicator
Now that the indicator is on the chart, it will tell you when a fractal has been formed. Contrary to what you may think at first, the idea isn’t to turn around and go with a fractal, rather, it is to go against it. If you think about it for a moment, it does make perfect sense. If a previous reversal area gets broken through, then, obviously, the market has shown some strength in one direction or the other.
For example, if a fractal forms above the candles, it makes sense that if the market turns around and breaks above that level, then it will have broken a certain amount of resistance. After all, it’s where the price reversed the previous time. Obviously, the same thing can be said about a fractal that has formed based upon bouncing from lows, because if the market breaks down through there then obviously more bearish pressure has appeared.
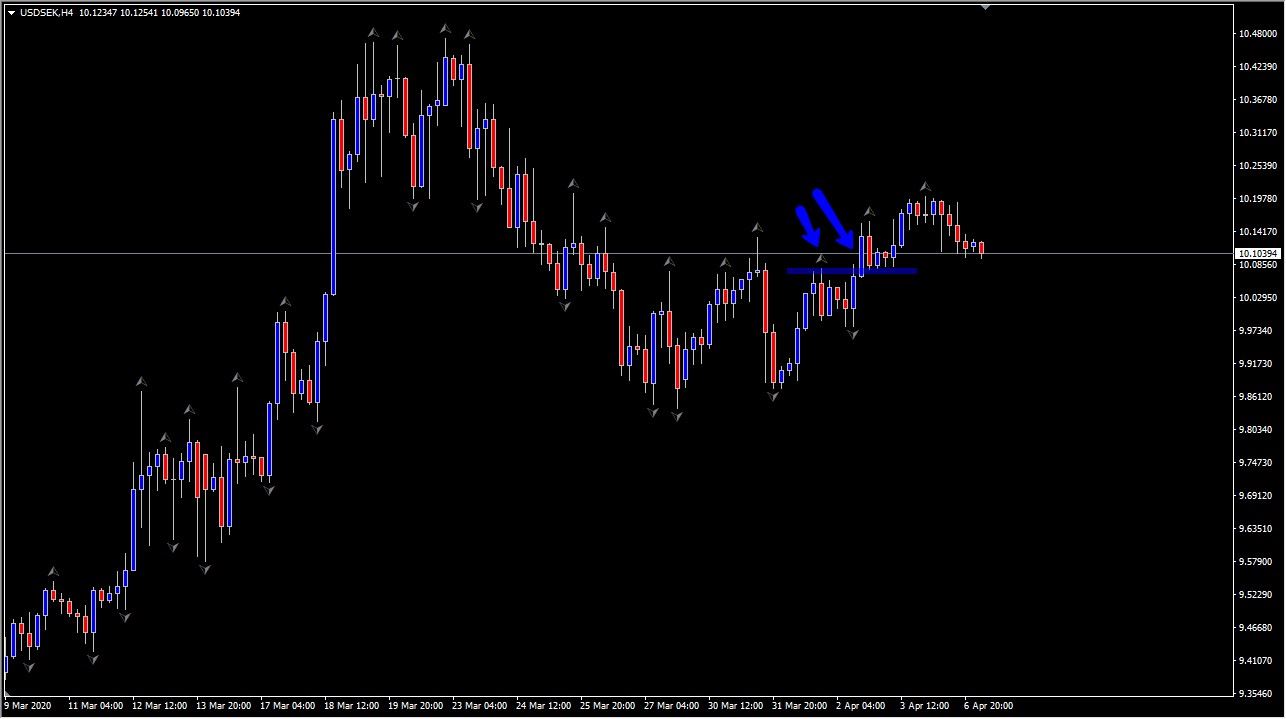
In order to simplify this, take a look at the chart below. It features a couple of blue arrows, one of which is pointing at a fractal that has been printed on the chart, and the other blue arrow points at the candlestick that has broken above that fractal. This is a classic Bill Williams Fractal bullish signal. If you think about it, again it makes quite a bit of sense that a recent high of five candlesticks being broken to the upside shows renewed strength.
It should be noted that some people will use the Bill Williams Fractal indicator in order to find a trend line. For example, the average trend line will simply look for highs and lows and try to connect them going either up or down.
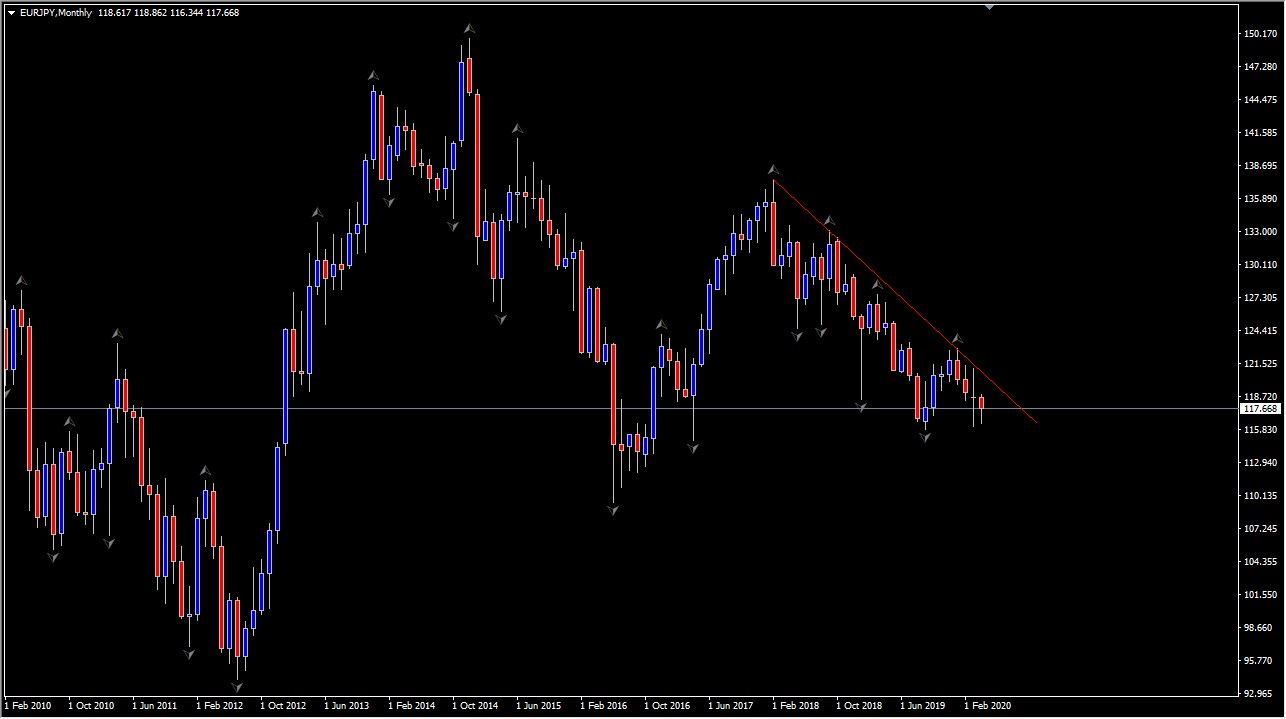
However, with the fractal indicator, you are looking at areas that the market has paid the most attention to based on the fact that the area is the highest of five candlesticks. Looking at the chart below you can see that the EUR/JPY pair has formed several fractals on the way down in the Berkeley timeframe.
You can see how connecting the candlesticks with those fractal arrows forms a tidy trendline that the market certainly seems to be paying quite a bit of attention to. If you are looking to find a trendline that is based on important reversal levels, you can see that the indicator can come in quite handy.
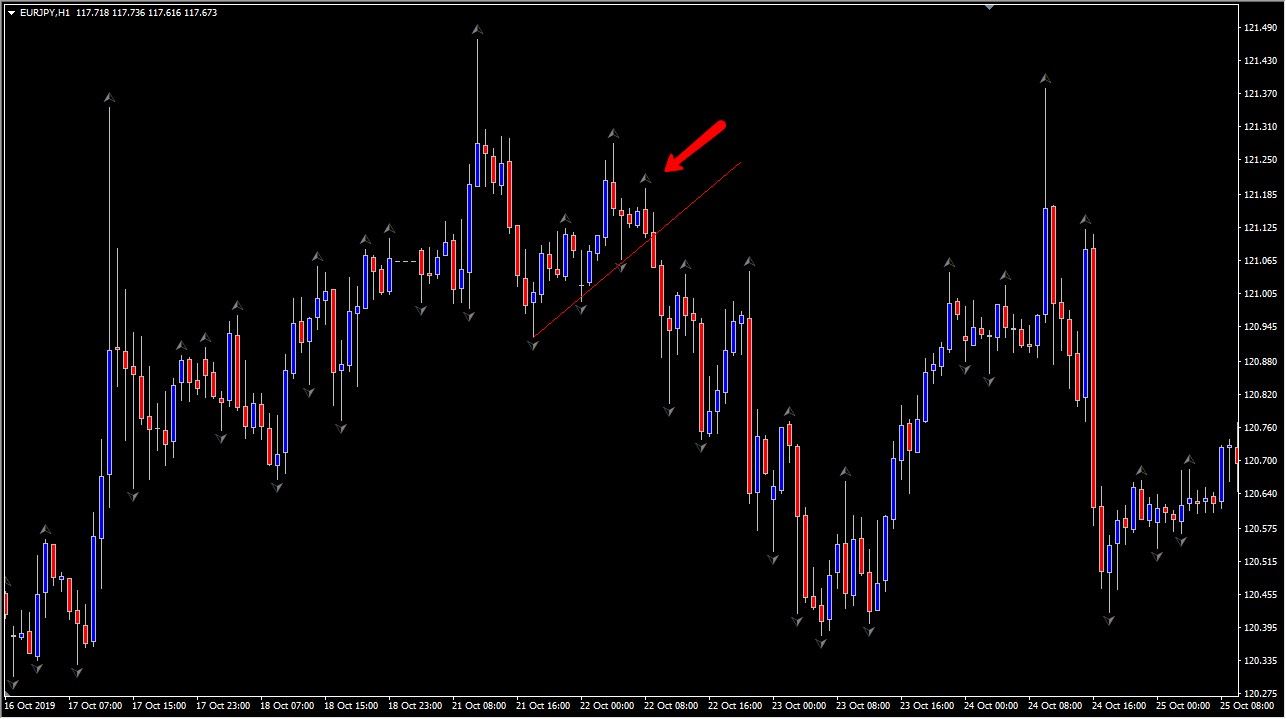
Another common use for the Bill Williams Fractal indicator is to confirm trends. For example, if the market is in a strong uptrend, there will be more fractals that are broken to the upside than the downside. That being said, the inability to break through the previous fractal can give you a hint that the market is getting ready to consolidate, or perhaps even change trends. The question then is whether or not the market is going to turn around and break through the opposite direction fractal, because at that point, the trend very well could be rolling over and changing.
Take a look at the EUR/JPY hourly chart below. The market had been grinding to the upside, and as you can see the fractal indicator was quite busy. You can see the uptrend line has been broken to the downside but pay attention to how things played out heading into this. The three fractals to the downside continue to rise, and therefore you can connect the uptrend line in order to define the short term trend.
Notice how the first fractal to the upside is followed by a higher fractal, which is then followed by a fractal that is lower than the second. The fact that the market couldn't break above there and continue the overall trend was the first sign of trouble. Instead of consolidating though, the market broke down through the uptrend line, and in the first candlestick that broke down through that trendline, the market had even broken through the bearish fractal that made up the last fractal on the trendline. In other words, there were a couple of reasons to think about selling at that point. As you can see, the market really broke down rather significantly afterwards.