Shares
 
FAQs

Visit our FAQ page to find the answers to the most commonly asked questions, including how to create an account, explaining ETFs, and providing useful links, forms, and tables.

FAQs
Shares

Start investing in Australian shares the smart way. Discover ThinkTrader today.

Open Shares Account
Learn To Trade
 
Indicators & Chart Patterns

Deepen your knowledge of technical analysis indicators and hone your skills as a trader.

Find your detailed guides here
Trading Glossary

From beginners to experts, all traders need to know a wide range of technical terms. Let us be your guide.

Learn more
Knowledge Base

No matter your experience level, download our free trading guides and develop your skills.

Learn more
Learn To Trade

Trade smarter: boost your skills with our training resources.

Create a live account
Market Analysis
 
Market News

All the latest market news, with regular insights and analysis from our in-house experts

Learn more
Economic Calendar

Make sure you are ahead of every market move with our constantly updated economic calendar.

Learn more
Technical Analysis

Harness past market data to forecast price direction and anticipate market moves.

Learn more
Live Webinars

Boost your investing knowledge with our live, interactive webinars delivered by industry experts.

Register now
Special Reports

Engaging, in-depth macroeconomic analysis and expert educational content from our in-house analysts

Learn more
Market Analysis

Harness the market intelligence you need to build your trading strategies.

Create a live account
Partnership
 
Money Manager

Increase your income and get compensated for your trading knowledge with ThinkInvest, putting you in control.

Learn more
Introducing Broker

ThinkMarkets ensures high levels of client satisfaction with high client retention and conversion rates.

Learn more
White Label

We supply everything you need to create your own brand in the Forex industry.

Learn more
Regional Representatives

Partner with ThinkMarkets today to access full consulting services, promotional materials and your own budgets.

Learn more
Partnership

Plug into the next-gen platforms and the trades your clients want.

 
About ThinkMarkets
 
Sponsorships

Check out our sponsorships with global institutions and athletes, built on shared values of excellence.

Learn more
About Us

Find out more about ThinkMarkets, an established, multi-award winning global broker you can trust.

Learn more
Negative Balance Protection

Trade with peace of mind. Never lose more than what you deposited, no matter what the market conditions.

Learn more
Careers

Discover a range of rewarding career possibilities across the globe

Apply now
ThinkMarkets News

Keep up to date with our latest company news and announcements

Learn more
Trading Infrastructure

When it comes to the speed we execute your trades, no expense is spared. Find out more.

Learn more
Contact Us

Our multilingual support team is here for you 24/7.

Learn more
About ThinkMarkets

Global presence, local expertise - find out what sets us apart.

Create a live account
Log in Create account

Using the Bill Williams Gator Oscillator

The Bill Williams Gator Oscillator is an indicator that the famous trader it was named after developed in concert with several other indicators. The Gator Oscillator helps determine whether a market is in a trend or if it’s simply consolidating. It’s used to decide when to enter and exit a trade, as timing in trading is crucial. 


The Gator Oscillator is typically used in conjunction with the Alligator Indicator, as a secondary indicator. The Alligator Indicator is simply three simple moving averages in the 5, 9, and 13 variety shifted forward in order to smooth out the readings. 


Both of these indicators are built into the Metatrader platform, so there’s no need to download anything, as you can simply click a few buttons and place these indicators on your charts. 

Adding the Gator Oscillator to Metatrader

Adding the Gator Oscillator to the chart is very simple. Click Insert, pull down the menu to Indicators, then click Bill Williams. Now, all you have to do is select the Gator Oscillator option.


At this point, the dialogue box allows the trader to change colors, levels, and visualization, but the main parameters are going to be for the Jaws period, Teeth period, and the Lips period.


These are the three levels of smoothed moving averages that make up the indicator. With the Alligator Indicator, the idea is that the three moving averages need to spread out in a direction at the same time to show momentum. This indicator, the Gator Oscillator, expands on that foundation. Below, you can see the options available in your Metatrader platform. Simply click OK to select the standard options.


adding the gator oscillator


At this point, the Gator Oscillator will show up in its own window at the bottom of the chart. There are green and red bars that appear, and a zero line where the indicator separates. The oscillator is different from many other oscillators as it’s actually two oscillators. The positive value for the oscillator is above the zero line while the negative value is below the zero line. It isn't a normal histogram in the sense that it shows both positive and negative momentum. That being said, there are a variety of ways to read these oscillators in order to discern what type of market the currency pair is in. 


the gator oscillator indicator

How to Read the Gator Oscillator

Using the Bill Williams Gator Oscillator is relatively simple, but you need to know how to interpret the reading. You should keep in mind that Bill Williams suggested in his Alligator strategies that the market is in one of four potential environments. The alligator can be sleeping, awakening, eating, or sated. When the alligator is sleeping, that means that there is no trend in the market. When the alligator is awakening, it is starting to form a trend. When it is eating, it is continuing the trend, and when it's sated, that means that it is slowing down, perhaps suggesting a lack of momentum. 


In order to take advantage of the Gator Oscillator, you need to understand how to read these dual bars, as they give you different readings based upon the colors on both sides of the zero line. In order to simplify things, you can refer to this section when trying to use it. 

  • Sleeping phase - The sleeping phase is when both of the bars on each side of the zero line in the oscillator are red. This means that the alligator is sleeping, or in other words there is no trend. This would be the same as when using the Alligator Indicator, and the moving averages are all crossing each other and tightening up, showing a lack of any clear directionality. 
  • Awakening phase - The awakening phase is when there are different colors on each side of the oscillator. The awakening phase corresponds to win the moving averages are starting to widen a bit in the Alligator Indicator. The Gator Oscillator eliminates the need for those moving averages by simply plotting down in this window what the moving averages would be doing. As the alligator is awakening, that means that a trend is starting to form. 
  • Eating phase - The eating phase is when there are green bars on both sides of the oscillator. This means that the alligator is trending, meaning that it is eating. In this scenario, you should be trying everything you can to keep your position open in order to get as many prophets as possible. In other words, the moving averages on the Alligator Indicator would be spread wide open, and in a nice trending slope. 
  • Sated phase – The sated phase means that the market is starting to slow down a bit, as the alligator is starting to get full, and therefore is sated. In other words, the trend may be slowing down or even ending. This is when you go from a couple of green bars above and below the zero line to a mix of colors again. At this point, the indicators tell you it may be time to take profit.

Take a look at the chart below. It features blue, orange, and green arrows. The blue arrow will represent when you get a couple of green bars on both sides of the zero level, meaning that the alligator is eating, and therefore you should try to stay in the market. The orange arrow shows duel red bars, suggesting that you should stay out of the market because there is no trend and the alligator is sleeping.


Take a look at the green arrows, you can see that the market has a mix of colors, suggesting that a trend could be starting. As you can see, this indicator is highly sensitive to trend, and as a result can tell you when it’s time to either be in or out of a trend. It’s also worth pointing out the fact that the measuring of the trend doesn't necessarily suggest which direction that trend is in, just that it is moving. Remember, this oscillator essentially just measures the difference between the three moving averages that make up the Alligator Indicator.


the signals shown with corresponding arrows


To give you an idea of how this looks with the Alligator Indicator, take a look at the chart below and notice how the histogram spreads out further when the moving averages are spread out. It’s just a simplification of how to read what is essentially the same indicator. It's an easier way to see the same information, thereby making it very useful.


using the gator oscillator and the alligator indicator together

Further Thoughts on the Gator Oscillator

The Bill Williams Gator Oscillator is a useful indicator, but it's essentially the same thing as the Alligator Indicator. In other words, it’s basically just using three moving averages in order to determine trends. Granted, they are smoothed moving averages, and therefore they are also susceptible to the same type of whipsaw trading situations that any moving average system will suffer. However, the oscillator gives the trader a much clearer picture of what’s going on instead of having to try to understand the slope of the moving average, the spread of the moving averages, etc. It's a handy way to discern the information. This oscillator is a bit different from many other oscillators, as it's a dual oscillator

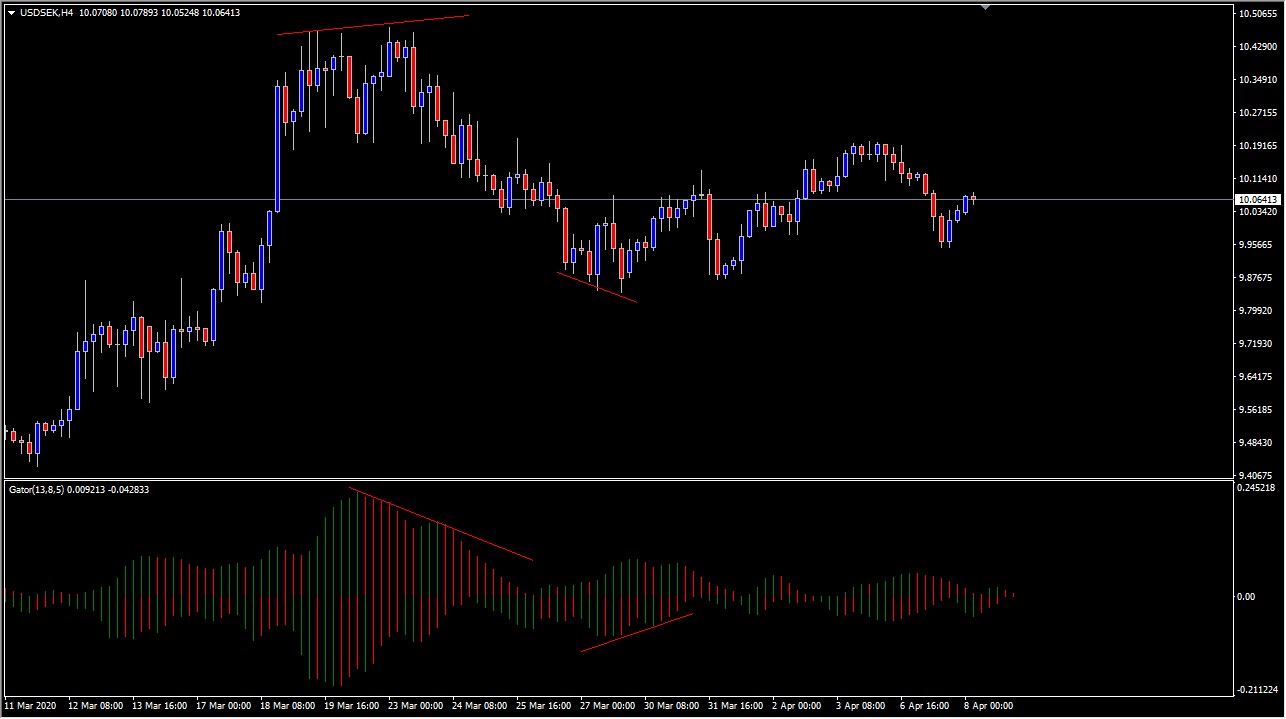
You  use it for divergence, although that isn’t necessarily as common with this oscillator as with the Moving Average Convergence Divergence indicator, the Relative Strength Index, or many other ones. That being said, you should keep in mind that when looking for divergence in this oscillator, you need to realize that you are looking at two oscillators. The top half of it can be looked for bearish divergence, while the bottom half can be used to try to find bullish divergence


Remember, divergence is simply a difference between momentum and price, meaning that if the price is rising but the momentum is slowing, the momentum and the price action are diverging. This is normally a sign that the market is ready to rollover, as there isn’t a lot of underlying momentum or conviction. 


Alternatively, if the price is falling but the momentum is starting to go more positive, that typically means that you are going to see a bullish move sooner or later.

Take a look at the chart underneath to see a couple of examples of divergence.


divergence in the gator oscillator


Bill Williams seemed to be focusing on three specific smoothing moving averages for almost everything he did. Because of this, it probably isn't necessary to use this indicator with a bunch of other ones that he has created, because essentially, they are going to tell you the same thing. 


That being said, obviously they have a certain amount of expectancy popularity as they are included with the Metatrader platform. All things being equal, the Alligator series  is a set of indicators that can be useful if you understand how they are printed. At the end of the day, everything is based upon moving averages, which over the longer term work really well with trends, but a lot of traders have trouble trusting just moving averages. It’s almost impossible to trade with just moving averages, as most people will add some other indicators such as a different oscillator or Fibonacci retracement levels, or something else. 


Keep in mind: 

  • Moving averages are lagging indicators, and therefore have a bit of a delay.
  • 5, 8, and 13 are all used, albeit smoothed versions.
  • The moving averages are all Fibonacci numbers, not that you can read too much into them.
  • The indicator itself should not be used alone. You should use other setups in congruence with the trend information that the Gator Oscillator is telling you.
  • It is essential to have an understanding of what the color combination of bars in the oscillator mean, as each variety has a different message.

Going forward, it’s crucial that you get used to reading the indicator so starting out on a demo account is probably paramount at this point. By understanding the overall attitude of the market, meaning whether or not it is trending, you can start to employ the right strategy.

In a sense, the Gator Oscillator isn’t so much a strategy as it is an indicator that can tell you which type of strategy you should be employing into the market. For example, if the alligator is sleeping, this means that there isn’t much in the way of a trend, and therefore you may like to start trading a range bound system until the alligator awakens. Obviously, the exact opposite can be true as well.


One thing that is very useful with this indicator is that when the alligator enters the sated phase, it might be time to get out of the market. At the very least, it may be time to start moving your stop loss closer to the current price, as the momentum is starting to slow down. That in and of itself is a very useful feature of this indicator, and it can keep you in more profits if you get out before the trouble starts.


Obviously, not all indicators are going to be perfect but this one is very useful because it can give you an idea of the trend without cluttering up the charts with a bunch of moving averages, although you can clearly use the Alligator Indicator right along with it, even though both indicators will essentially tell you the same thing, but in different ways. The indicator has been tested for several decades, therefore, it has a strong track record of use by professional traders.

Any opinions, news, research, analyses, prices or other information contained on this website is provided as general market commentary and does not constitute investment advice. ThinkMarkets will not accept liability for any loss or damage including, without limitation, to any loss of profit which may arise directly or indirectly from use of or reliance on such information.
Back to top