Adding an additional filter
Many traders choose to compliment the MFI indicator with a moving average.
This is because the moving average can keep you on the right side of a trend.
If you are looking for an indication of an overbought or oversold condition within the Money Flow Index indicator, this can be validated by a move above or below a moving average.
Let’s look at the below four-hour chart in the Canadian dollar/Japanese yen currency pair.
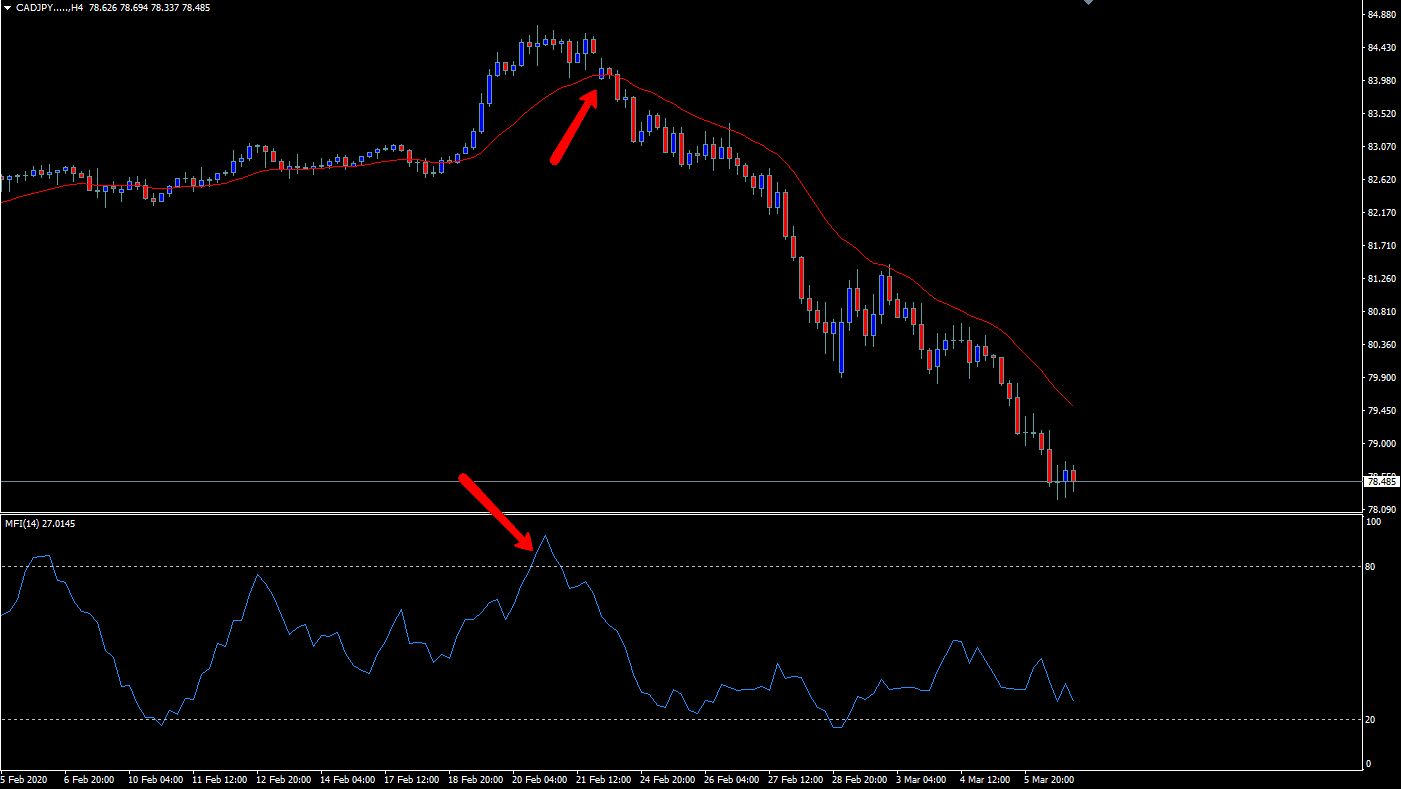
The blue arrow indicates where the Money Flow Index indicator reached the oversold condition. Shortly after that, the price crossed above the 20 exponential moving average, one that is commonly used.
The way to think about this move is that the market had gotten oversold, and then by breaking above a common moving average, it shows that the momentum and trend is starting to change to the upside.
At that point, most traders would enter a position.
Later on, in the same chart, you can see that the Money Flow Index indicator had entered the overbought condition, and the price shortly thereafter fell below the 20 EMA.
That tells you that the shift is starting to gain momentum, and the market starts to fall from there. Ultimately, this keeps you in the loop when it comes to a potential trend change, and then gives you confirmation in a one-two set up.
In another example, we can apply the Bollinger Band indicator to the chart, looking for signs of oversold or overbought conditions from both indicators.
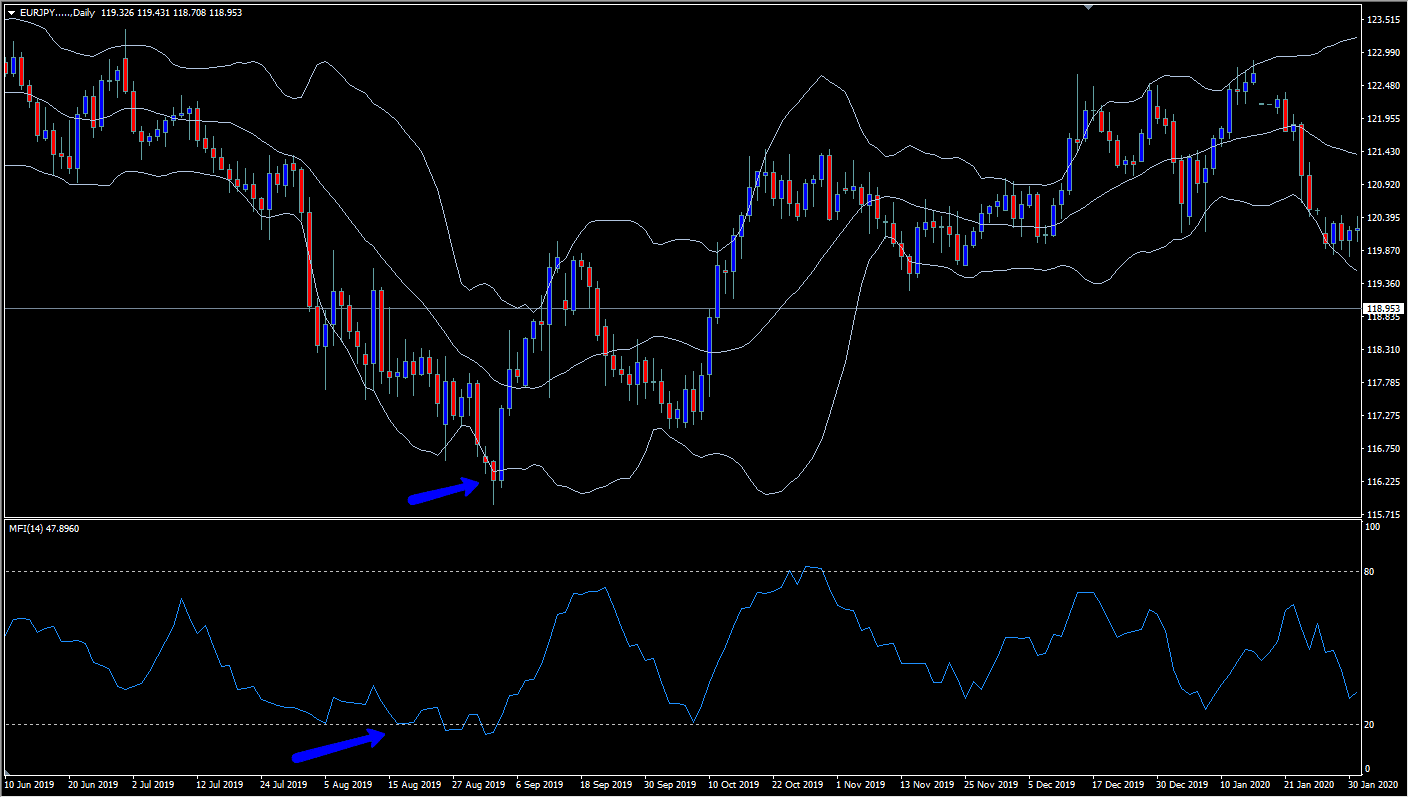
Looking at the chart, you can see where the blue arrows start that the market has broken below the oversold level, followed very quickly by the market breaking below the bottom of the Bollinger Band indicator.
This shows that the market is oversold as far as the Money Flow Index indicator is concerned, but more importantly it is also oversold with both indicators.
By breaking the bottom of the Bollinger Band indicator, it now is two standard deviations below its average price.
With both of these indicators you have the ability to see a slowdown in volume going into the market, and at the same time you can see that the market is statistically farther away from normalcy than it should be.
This almost always sets up for a ‘reversion to the mean’, demonstrated by the moving average in the middle of the Bollinger Band indicator.
However, some people will also aim for the top of the indicator: it boils down to your own personal trading style.
Any opinions, news, research, analyses, prices or other information contained on this website is provided as general market commentary and does not constitute investment advice. ThinkMarkets will not accept liability for any loss or damage including, without limitation, to any loss of profit which may arise directly or indirectly from use of or reliance on such information.