One of the most frequently asked questions I hear interviewers ask of talking heads in the financial media at the moment is: “So, is this the start of a new bull market, or is it just a bear market rally?”
Highlights:
- Nasdaq Composite (COMP)
- How to spot if a bear market rally has legs
- Apple Inc. (AAPL)
- Alphabet Inc. (GOOG)
- Amazon.com Inc. (AMZN)
- Tesla Inc. (TSLA)
Nasdaq Composite vs bear markets
With respect to the curly questions above, the relevant talking head generally squirms in their chair and or tugs at their shirt collar, then recites something along the lines of “
Maybe, but also not maybe. One thing is for sure, however, investors can expect further volatility ahead”. Um, thanks for nothing!? I was asked the same question in the media regarding the Nasdaq Composite index during the week, and I went with something along the lines of: “
Well, I can’t tell the future – thanks for asking, but let me explain the key signals investors absolutely must know so they can decide for themselves.”
In today’s post, I’m going to discuss these signals in detail, but first, I’d like to provide a couple of useful definitions on exactly what a bear market is. A bear market is considered to be a decline of 20% or greater from a particular index’s all-time high. For example, the last all-time high for the S&P ASX200 occurred on Friday 13 August 2021 at 7632.8. Not kidding, Friday the 13th, and yes, there’s been a great deal of bad luck for local investors since then. The lowest price since that peak was set on 27 January this year at 6758.2 – or some 11.5% lower. Not a bear market.
Compare this to the Nasdaq Composite (COMP). It peaked at 16212.2 on 22 November 2021 and its worst point occurred on 20 May this year when it plumbed 11035.7 – a loss of 31.9%. A bona fide bear market! The 20 May low will continue to stand as the current bear market’s low until it is breached. If it is not breached, 11035.7 will go down in history as the starting point of the next bull market. That bull market will officially begin when the COMP next trades above 16212.2.
.png.aspx?width=700&height=394)
Looking at the COMP chart above, we can see that within the current bear market there have been a number of rallies. The most notable occurred between 14 and 29 March where the COMP rallied an impressive 16.7% from low-to-high in just 11 trading sessions. As you can see, bear market rallies can be very convincing indeed! In fact, the COMP’s 14-29 March performance was the 15th largest on record. FYI, a staggering nine of the historical bear market rallies which were bigger, occurred within the 2000-2002 ‘Dot-com Crash’ bear market alone.
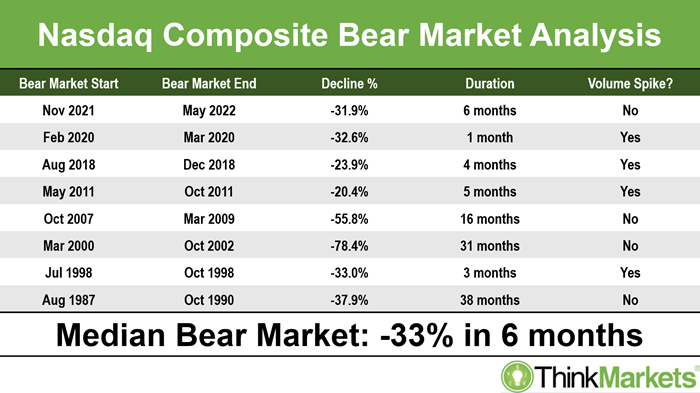
That bear market stands as the longest and most severe on record – a devastating 78.4% decline over a withering 31 months. Also, consider just how cruel that bear market was. Nine massive attempts to break out of the bear, with logically, eight of them failing. Excluding this subset, there are only four other times when the Nasdaq experienced a larger bear market rally than 14-29 March. One occurred in 1998, two occurred in the lengthy 2008-2009 ‘GFC’ bear market, and then there was the successful break of the 2020 ‘COVID-19’ bear market.
Investors who believe history is anything to go by, should note a typical Nasdaq bear market lasts for around 6 months and results in a decline of roughly 33%. The stats on bull markets are plus 86% in 33 months. So, if there’s a silver lining with bear markets, it’s that they’re usually short and sharp – like ripping off a band aid. It’s also worth noting the current COMP bear is very close indeed to the typical, both in terms of price and time. I’ll explain the significance of the Volume Spike column later.
How to spot if a bear market rally has legs
Back to bear market rallies and how to spot if the bull market low is in. Clearly, bear markets present investors with one of the most dangerous dummy-head-fakes in markets. You don’t want to dip that toe in the water too early, ask that chap on A Current Affair last night who thought it was a good idea to swim in a water hole full of crocs. So, let’s run through how to tell if a bear market rally has legs, or if it’s likely to fail like so many others have done before.
As you might expect me to say, it all starts with the candles! We want to see some hefty demand-side examples at the low point of the recent rally. Demand-side candles are the large white ones, and or the ones with long lower shadows. Demand-side candles indicate in the short-term supply has dried up and buyers are returning to the market. The more demand-side candles, the better.
Ideally, we next see the price action (i.e., the relative position of peaks and troughs) switch back to higher peaks and higher troughs – which I refer to as ‘good price action’. This is probably the most important thing I’ll say today, so listen up: Bear markets are all about sell the rally, that is, take any chance to bail out at better (higher) prices because you think you might not get another…Bull markets are all about buy the dip, that is, take any chance to pile in at better (lower) prices because you think you might not get another…So, higher peaks and troughs indicates investors have moved back to buy the dip. Don’t trust a potential market bottom until you see higher peaks and higher troughs!
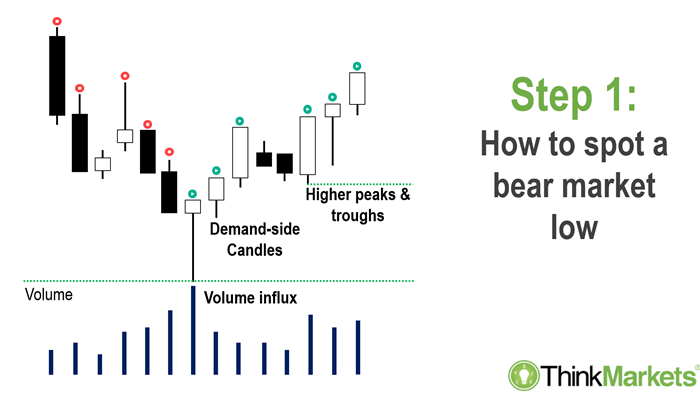
The final piece of the puzzle for Step 1, is an influx of volume and volatility. This is where the last column of the Nasdaq Composite Bear Market Analysis table comes in. To be really sure you’ve seen a meaningful bear market low, you should observe significantly (i.e., roughly double) volume and volatility at or near the low point. This indicates the last hangers-on have capitulated and dumped their stock. We know that many of them did it, refer to the high volume, and because of those demand-side candles, we also know some strong hands gleefully snapped up all that discounted stock. In each of the previous ‘short’ bear markets (i.e., less than 6 months in duration), the bear market low coincided with a significant influx in volume. The longer the bear market, however, the less likely this key indicator occurred. My fear is that the current bear market is starting to creep into the ‘long’ variety, and it hasn’t yet delivered a convincing volume signal. (da-da-daaahhhmmm!)
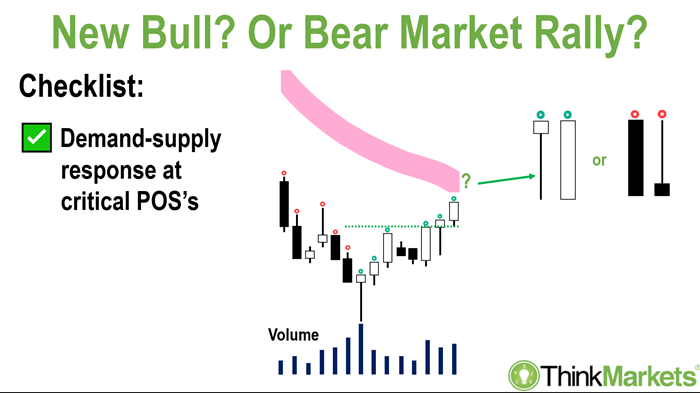
The next key indicator your bear market rally has legs, is how it behaves at my short- and long-term trend ribbons. You’ll notice from the current COMP chart (the first chart above) my ribbons do a very good job of pushing prices back down in a bear market phase. So, pretty simple here, if we hit those ribbons with a bunch of supply-side candles (remember, they’re the large black ones and or have long upper shadows), it means we’re probably still in sell the rally mode – so brace for more falls. If we see those ribbons hit with a bunch of demand-side candles, the rally stands a real chance of getting to Step 3, which is the eventual transitioning of those ribbons back to uptrends. On my charts this means you’ll see the ribbons turn back to green. Just as important here, you should also find the ribbons go from pushing down prices as they did in the bear market, to supporting prices, in the new, fledgling bull market.
You are here 👉
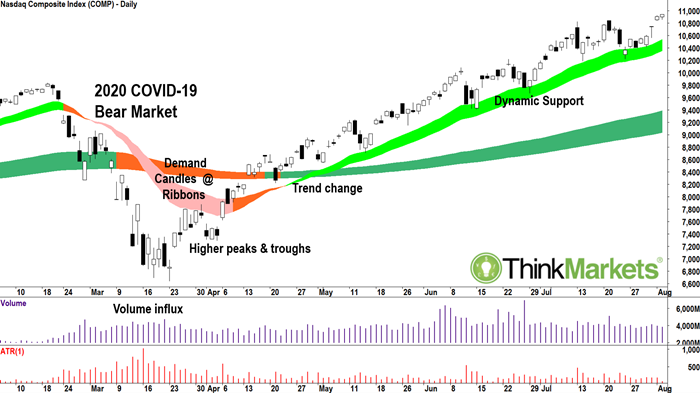
The chart above shows how the COMP emerged from the 2020 COVID-19 bear market. It’s kind of a text-book example of all the ingredients required for a successful bear market rally. Compare to today’s COMP chart (you’ll have to do a bit of scroll up and scroll back down again, sorry!) and we can see just how well-established the current short- and long-term trends are to the downside. The batch of candles between 20 May and 27 May in the current rally qualify as strong demand-side candles. Great, first check in the check list, but that’s about as far as we get in checking boxes for this being a successful bear market rally. (
cue da-da-daaahhhmmm sound effect again!)
So far, we’re yet to see higher peaks and higher troughs in the price action, and we are sorely lacking that volume influx which signals sellers have capitulated and the big money has swooped back in. Some good news: we’ve reached the short-term downtrend ribbon. Some bad news: last night’s candle (at the time of writing, 1 June) signals there’s some supply here. A few more supply-side candles in and around the ribbon and there’s every chance we’ll slip back into the downtrend. Finally, those ribbons don’t look like turning green any time soon. Hmmm. Not good.
So, you can see there’s a few key technical signals which need to go right for the COMP to signal it is indeed emerging from the current bear market. These could play out over the next few weeks, and possibly even months, as we carefully put each piece of the puzzle together. The signs so far don’t look great for a sustainable rally, but you never know, there’s another candle coming tomorrow – it can and will change. At least you’ll know what to look for to determine if the new bull market has indeed begun!
Double extra bonus material
Apple Inc. (AAPL), Alphabet Inc. (GOOG), Amazon.com Inc. (AMZN), and Tesla Inc. (TSLA) charts and analysis. Just a few quick takes on how these key COMP constituents are faring. After all, the rally is probably going to start here…and we can also use our learnings above to determine whether their respective rallies have legs.
Apple Inc. (AAPL)
.png.aspx?width=700&height=394)
The short-term trend ribbon (pink) shows Apple is in a clear downtrend. The long-term trend is just hanging on at neutral (orange ribbon), but one more failure to reclaim it around here and I’d officially call it down. The 20-27 May candles are impressive, but we’re lacking higher peaks and higher troughs just yet, and there’s some pesky supply lurking within the short-term ribbon. I do like the volume influx at the 20 May low, however. In summary: Apple is delicately poised – further supply-side candles would indicate a resumption of the short-term downtrend. Either way, I can’t get really bullish until Apple closes back above the long-term trend ribbon. View: Bearish, sell rallies until a close above the long-term trend ribbon (call it 160).
Alphabet Inc. (GOOG)
.png.aspx?width=700&height=394)
A far better-established short-term downtrend for Alphabet, and I suggest the long-term trend is also officially down. Again, some impressive candles between 24-27 May, but no higher peaks and higher troughs, and there’s signs of motivated sell the rally activity in those supply-side candles on 31 May and 1 June. Volume influx to signal the selling climax is behind us? A bit ho-hum. In summary, I have some serious concerns here. It will likely take only one more supply-side candle to seal the deal, and see Alphabet slip back into the prevailing short-term downtrend. Plenty of work required to fix this one. View: Bearish, sell rallies until a close above the long-term trend ribbon (call it 2600).
Amazon.com Inc. (AMZN)
.png.aspx?width=700&height=394)
Ditto on the short-term trend, and we’re seeing the clearest, most well-established long-term downtrend of the group. However, Amazon.com also has easily the best candles since the recent low, and an impressive showing until 1 June in the short-term trend ribbon. If I squint, volume was elevated enough through the May bottoming phase to check that box. Again though, I’m just watching supply developing within the ribbon again as per the 1 June candle. Either way, I’ll need to see higher peaks and higher troughs before I get too excited the low is in. View: Bearish, sell rallies until observe higher peaks and higher troughs.
Tesla Inc. (TSLA)
.png.aspx?width=700&height=394)
Best for last? Look, it’s not the worst chart in this batch. Like Apple, it’s in a short-term downtrend, but I’m going to give it the benefit of the doubt and hold back on calling an official long-term downtrend. Let’s say it’s neutral. I’m seeing little indication in the volume we’ve seen a blow off in the selling, which to be fair, prior to the three candles from 25-27 May was particularly organised. Again, supply is rearing its ugly head in the short-term trend ribbon. No higher peaks and higher troughs either, and until then, I remain cautious about the prospect of a sustainable rally. As with each of these market heavyweights, in time, the market gods will deliver us new candles to pore over. So, let’s wait and watch for further confirmation the current bear market’s low is indeed in! View: Bearish, sell rallies until a close above long-term trend ribbon (call it 885).
Any opinions, news, research, analyses, prices or other information contained on this website is provided as general market commentary and does not constitute investment advice. ThinkMarkets will not accept liability for any loss or damage including, without limitation, to any loss of profit which may arise directly or indirectly from use of or reliance on such information.