We break down step by step each aspect of their incredibly successful trading strategy, and also provide a number of clearly explained practical examples to demonstrate how you can use it to trade the markets today.
Highlights:
- The Turtles Story
- Turtles Entry Methodology
- Turtles Exit Methodology
- Turtles Risk & Portfolio Management
- Turtles Capital Management
- Turtles Winning Secret
We're going to raise traders…like turtles!
The Turtles were group of 13 traders initially, but there were others later, who were trained by legendary futures traders Richard Dennis and Bill Eckhardt. Dennis believed that traders could be taught, that they could be trained to be really successful. His buddy Bill Eckhardt disagreed. Eckhardt believed the traits for a successful trader were innate, basically, successful traders were born that way. It was the age-old argument of whether 'nature' or 'nurture' determined a trader's success.
(And this part is a true story!) It was after a visit to a turtle farm in Singapore by the pair that Dennis proposed "We're going to raise traders like they raise turtles in Singapore". Dennis decided to put his theory to the test by training a group of everyday people in his trading system, staking them with his own capital, and letting them loose in the futures markets. The most legendary bet in the history of the markets was made! The year was 1983.
The men ran an advertisement in Barrons and the Wall St Journal seeking people interested in becoming Dennis' trainees. Dennis was arguably one of the most famous traders of the time, and applicants were offered a base salary and a share of the profits, so this certainly was a tantalising prospect! The men received over 1000 applications, and eventually narrowed this list down to just 13 starters. The group came from quite diverse backgrounds, but many were complete novices at trading.
At the end of 1983, the 'Turtles', as they came to be known, underwent a 2-week training course where they learnt Dennis' trading system. In January 1984, they were then let loose on the futures markets with $50,000 of Dennis' own money in a trial account. If Dennis was satisfied with a Turtle's performance during the trial period, that Turtle would be awarded with more capital to trade. Eventually most Turtles were awarded between $500,000 and $1 million to trade.
Over the time the Turtles traded Dennis' money, they earned an average return of 80% per annum, and total profits of over US$175 million (and that's in 1980's money!). In this article, we're going to investigate the Turtles Trading System in detail, explaining how they entered and exited trades, how they managed their risk, and how they managed their capital.
The system these aspiring traders were taught has come to be known as the 'Turtles Trading System'. It was a comprehensive trading methodology governing every aspect of the trading process. The key elements comprised a set of rules for determining when to enter a trade, when to exit a trade, how much to risk on a single trade, how to manage a trade, how to manage portfolio risk, and how to manage one's capital during prolonged periods of losses.
Importantly, the system was purely mechanical. This means that the rules of the system were clearly defined and required no discretion on the part of the user whatsoever. So, the Turtles were never in doubt as to what the correct course of action was, regardless of market conditions. Further, the system was totally technical analysis based. This means that all entry and exit decisions were made based upon the chart of the commodity, currency, or index etc. and not based upon any news or other fundamental data.
All-in-all, the Turtles trading system was comprehensive, unambiguous, and in theory, straightforward to implement. Most important of all, the Turtles Trading System had an 'edge'. This means that over a large number of trades, it was profitable. Now, this doesn't mean the Turtles won on every trade, on the contrary, the system often experienced extended losing periods and potentially also large drops in a Turtle's capital. Rather, it implies that over a large enough sample of trades, and if the system was followed exactly, the overall result would be a profit.
Know your expectancy
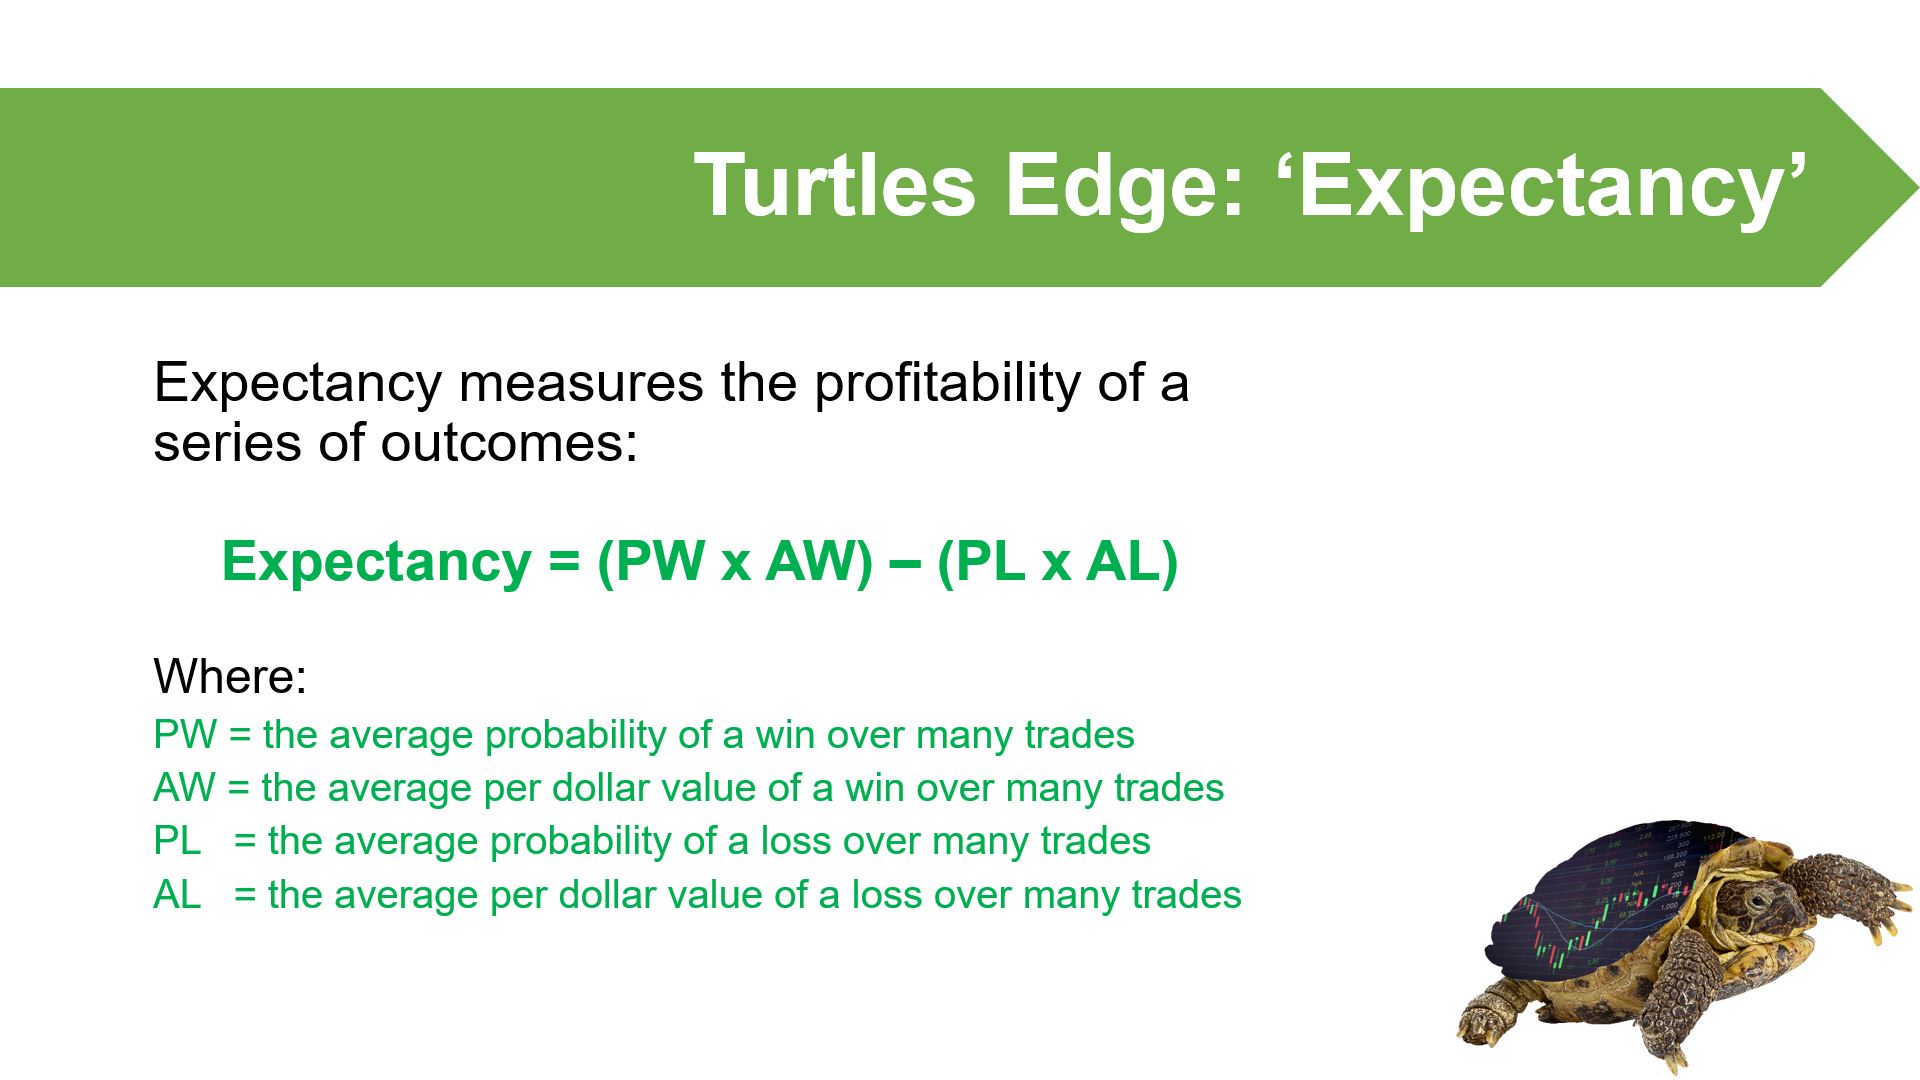
Traders measure their edge by calculating the 'expectancy' of their trading system. To work out expectancy, we simply multiply the ratio of winning trades by the average profit on winning trades, and subtract from this amount the ratio of losing trades multiplied by the average loss on losing trades.
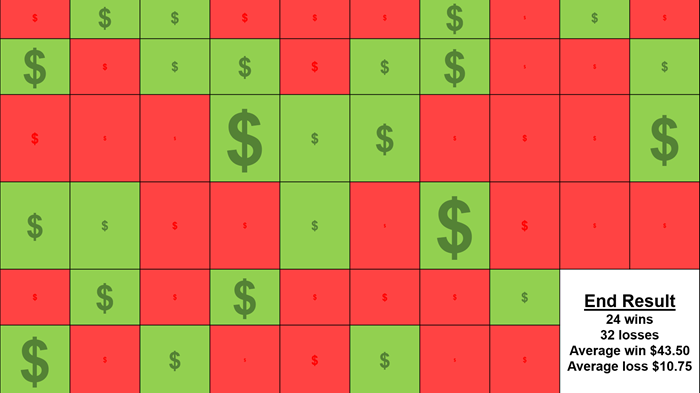
This diagram shows pictorially the result of a total of 56 hypothetical trades. The first thing we note is that over the sample, there are fewer winners than losers by a margin of 24 to 36. But, whilst we won on fewer trades, importantly, the average winning trade was substantially greater than the average losing trade. In this example, by a factor of approximately 4 times.
So, what is the expectancy of this hypothetical trading system? And before we work it out, ask yourself, do you have this sort of data for the trading system you're currently using? Can you work out your expectancy? Do you know the magnitude of your edge in the market?
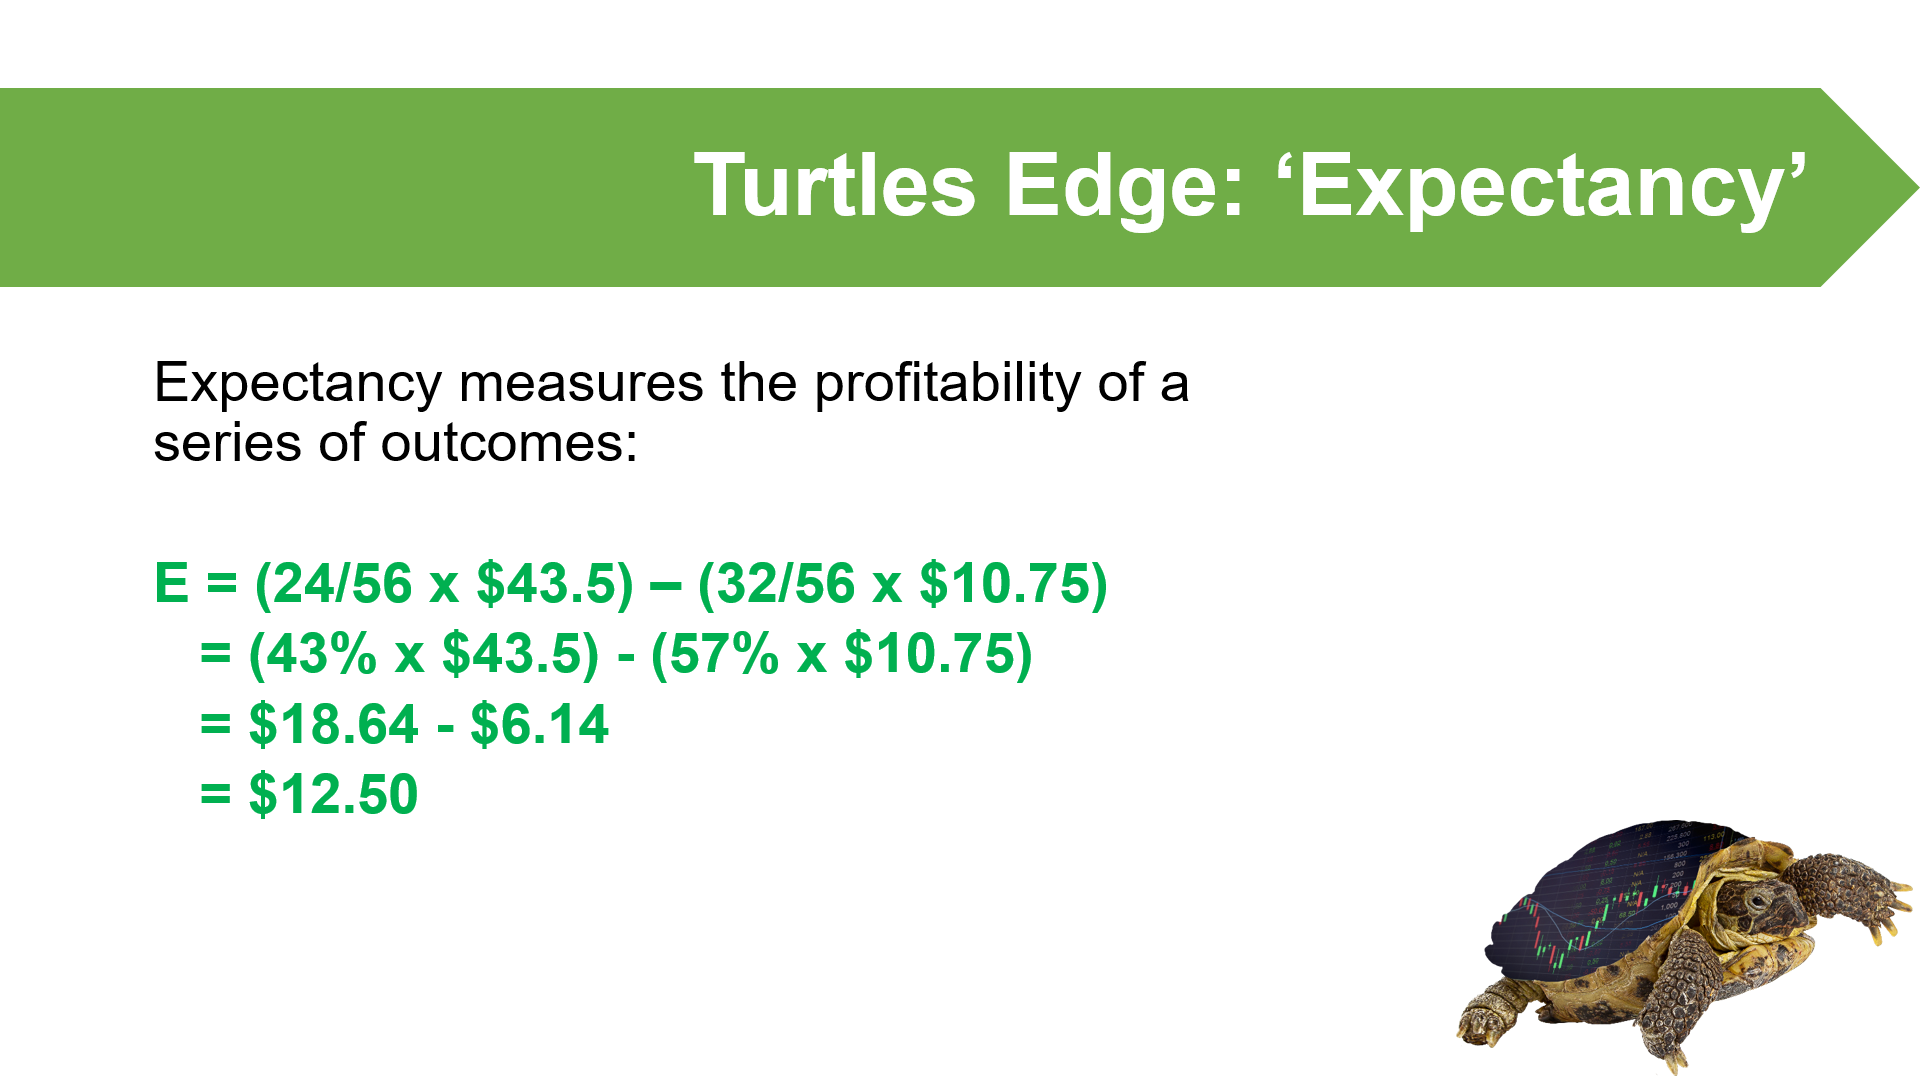
Plugging the numbers into our expectancy equation, we can see that this hypothetical trading system has an expectancy of $12.50. This means that on average, we expect to make $12.50 in profit on each trade we take, assuming a very large sample of trades. Now, this doesn't mean we are going to win on every trade, we saw that we most certainly don't on the previous slide. It's an average, but it does indicate that we're likely to be profitable in the long run. At this point, you should work out your expectancy. If your current trading system doesn't have positive expectancy, you probably shouldn’t be trading it.
Before we move on, consider the power of knowing such data about your trading. Many traders talk about the importance of trading psychology, that is, how you manage your mindset during your trading and how difficult that can be at times. I've even heard many trading coaches and psychologists refer to trading psychology as the single most important determinant of trading success.
I'm not so sure. Instead, I'd argue that if you know the system you're trading has positive expectancy, why would you have any psychological issues? You'd have utmost confidence that in the long run you're going to come out ahead. This would help you manage the inevitable short term ups and downs that plague most traders. Also, if you're trading a completely mechanical system like the Turtles had, where decision making is totally unambiguous, the simplest and easiest path, is to simply follow your trading system without question!
How the Turtles entered trades
The general idea behind Turtles trade entries was to enter a market just as it was beginning a potentially large move. The Turtles didn't mind which way the market broke, either up or down, because they traded both long and short. The exact timing of a trade was based upon the price of a market, for example crude oil, breaking either above or below a certain high or a certain low which occurred during a specific 'lookback period'. The concept of a lookback period involves starting from the most recent period to the current trading period, and then considering the trading data for the market only over that period.
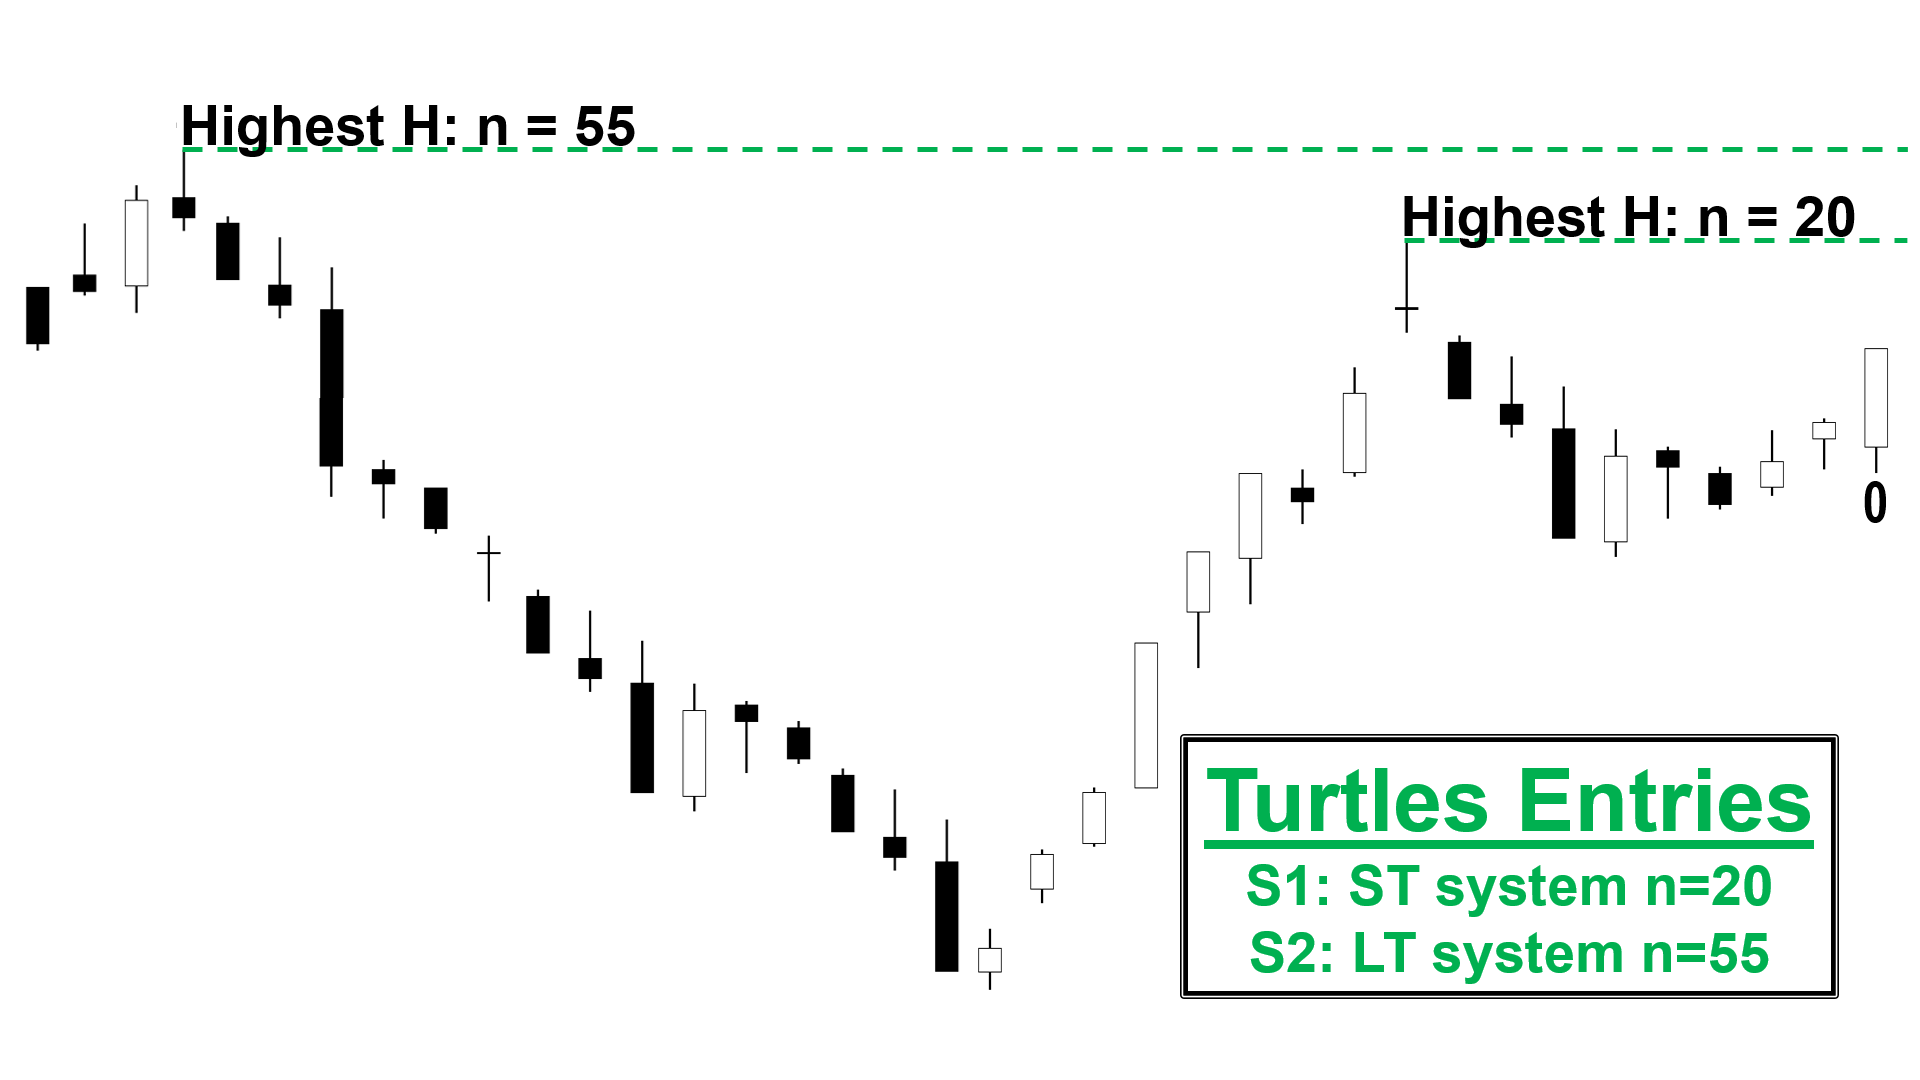
In the Turtles case, they focussed on two lookback periods: System 1 (or "S1"), which they classified as a 'short-term' trading system, used a 20-day lookback period; and System 2 (or "S2"), which they classified as a 'long-term' trading system, used a 55-day lookback period.
Let's look at an S1 long trade case study. Assume the candle on the far right labelled '0' is today. I've numbered each prior candle in the lookback period from 1 to 20. We'll only consider the highs in this sample for our potential trigger point. The highest high observed during the lookback period is the high of Candle 9. For S1 long trades, the price needs to trade above this high for a Turtle to enter a long trade.
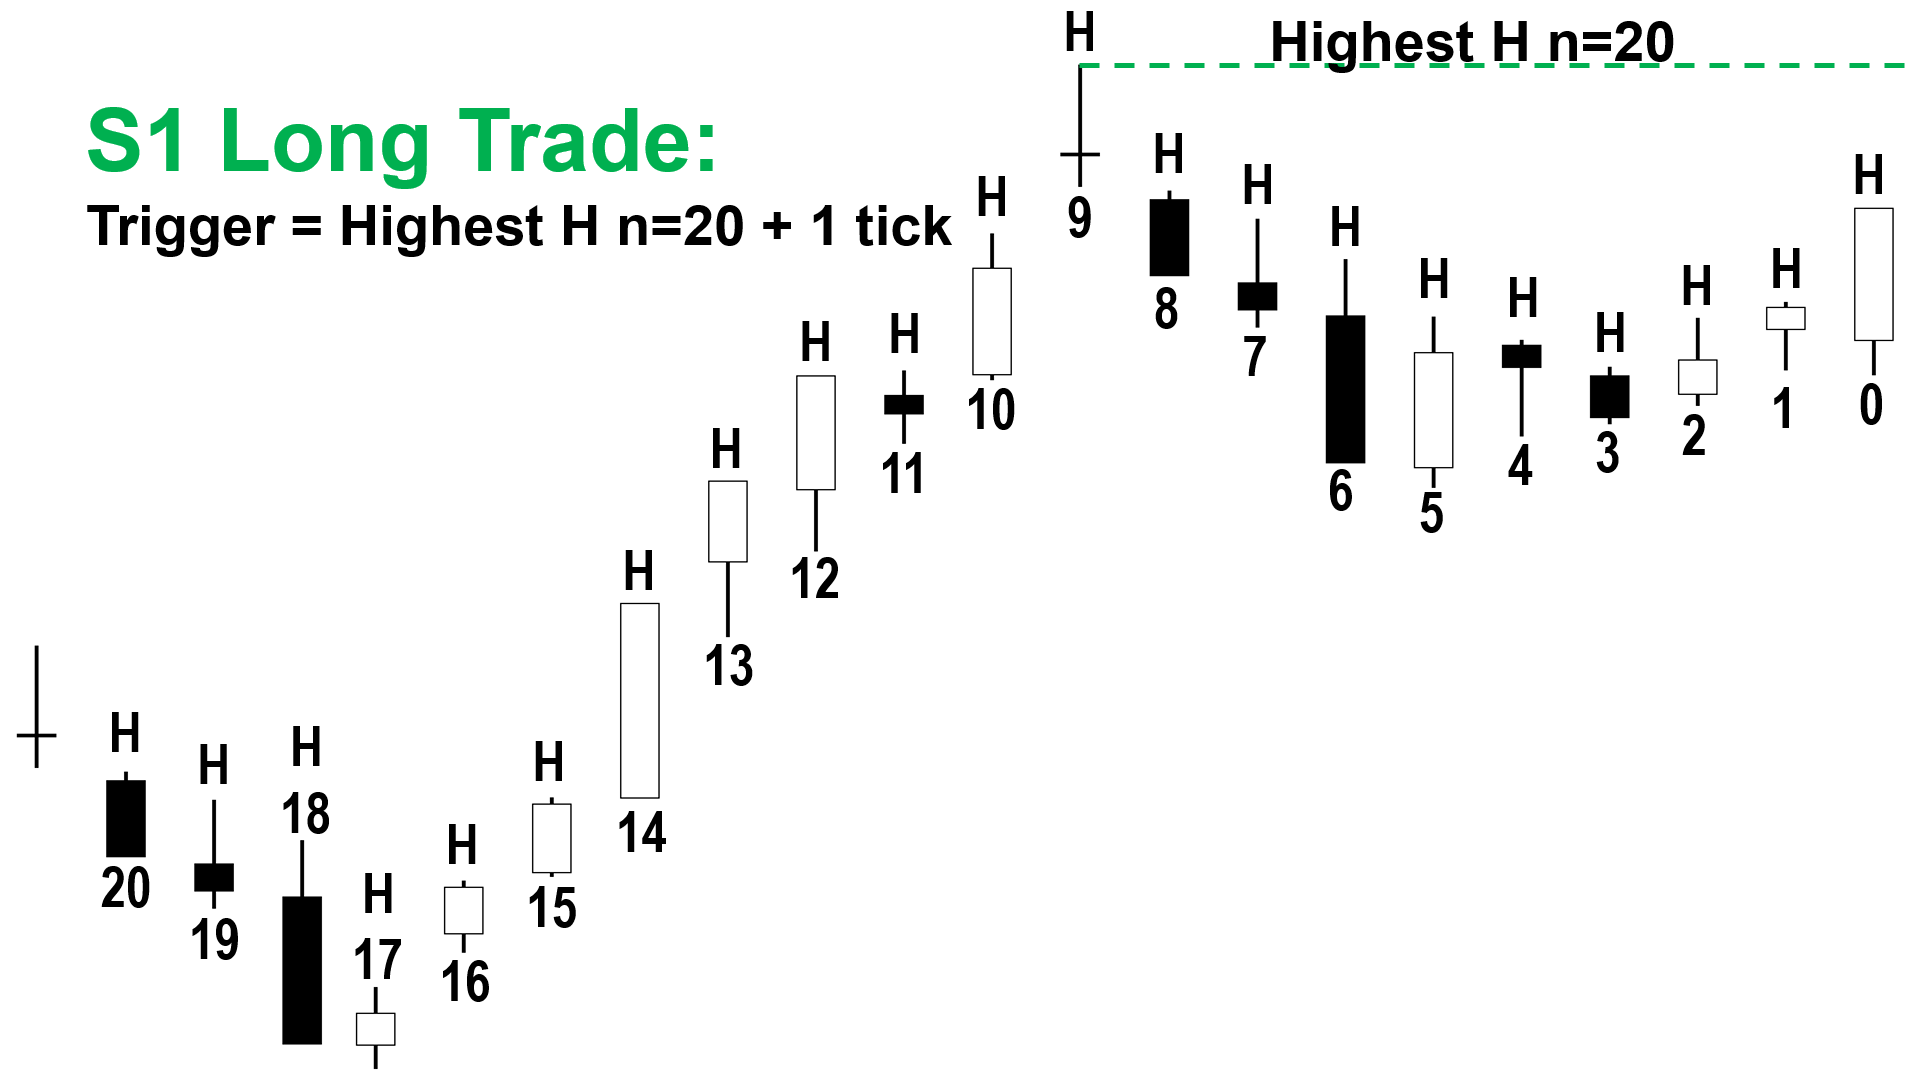
In practice, we add one tick to Candle 9's high to determine our trigger price. A 'tick' is simply the smallest possible price movement for the market being traded, so for stocks, one tick is one cent. If the price were to touch the trigger price or above during the current trading session, the Turtles would initiate a long trade. These types of trades were often referred to as 'Breakouts'.
Let's now look at an S1 short trade case study. Assume again that Candle 0 is today. We start from the previous session, and count back 20-days. This is our lookback period. The lowest low observed during the lookback period is the low of Candle 9. Remember, the price needs to trade below this low for a Turtle to enter a short trade.
In this case, we subtract one tick from Candle 9's low to determine our trigger price short trade. If the price were to touch the trigger price or below during the current trading session, the Turtles would initiate a short trade. These types of trades were often referred to as 'Breakdowns'.
System 2 trades entries worked much the same as System 1 trade entries, except S2 long trades used a 55-period high plus 1-tick as the trigger, and S2 short traders used a 55 period low minus 1-tick as the short trigger.
In this case study, we can see that S1 and S2 trigger prices are not always the same. In fact, in many circumstances, the S2 trigger price may be substantially greater than the S1 trigger price for long trades, or substantially less than the S1 trigger price for short trades.
Another small quirk of S1 trades involved only taking a trade if the last breakout or breakdown was unsuccessful. Another way to interpret this rule is a trade trigger would be rejected if the last trade trigger resulted in a successful trade. We'll define what an unsuccessful trade looks like a little later.
Note that S2 trades did not share this quirk. This is because S2 trades were intended to act as a catch-all mechanism for any missed S1 trades. It was compulsory to take an S2 trade if as S1 trade had previously been rejected. This ensured that the Turtles didn't miss any really big market moves.
How the Turtles managed their risk
The Turtles had equally strict rules for determining how many contracts they purchased at the start of a trade, and then, how they were allowed to increase or reduce their position size during the course of a trade. The Turtles used a percentage based trade risk model. This means they risked the same percentage amount of their total capital on each trade. We'll refer to the per cent amount risked on each trade as '%R'. The Turtles used a %R of 2 per cent.
2 per cent of a Turtle's capital was allowed to be spaced out over a stop loss distance that corresponded to two times the average true range (ATR) of the market they were trading over the lookback period. Average true range is a commonly used technical analysis indicator that is generally used as a proxy for a market's volatility.
The greater the volatility in a market over a particular period, the greater it's average true range over that period. This means that markets with greater volatility naturally required a wider stop loss than markets with lesser volatility. This gave the Turtles extra protection in volatile markets against getting stopped out of a trade before the big move they were anticipating occurred. It was a vitally important part of their trading system, and a key factor in their success.
The other point worth stressing here is that the turtles always used a stop loss to limit their risk. Dennis' strategy often resulted in strings of losses before a big win would occur to make up all of those and a whole lot more. So the Turtles needed a system that would limit their loss on each trade, but that also one that helped keep the overall loss from a string of losing trades to a manageable amount. The compulsory use of stop losses helped them to do this because it avoided the question all traders inevitably end up asking themselves, "Should I hold, or should I get out?"
Because the Turtles used a fixed risk amount on every trade, it meant that they naturally ended up with smaller positions in really volatile markets and larger positions in less volatile markets. Let's look at how this works with a volatility-based position sizing algorithm for stocks. Let's assume you're assessing an S1 long trade. You have a starting trading bank of $10,000 and your %R is the same as the Turtles, i.e., 2 per cent. The price of the stock you intend to buy is $10, and the current 20-period ATR (ATR(20)) for the stock is 50 cents.
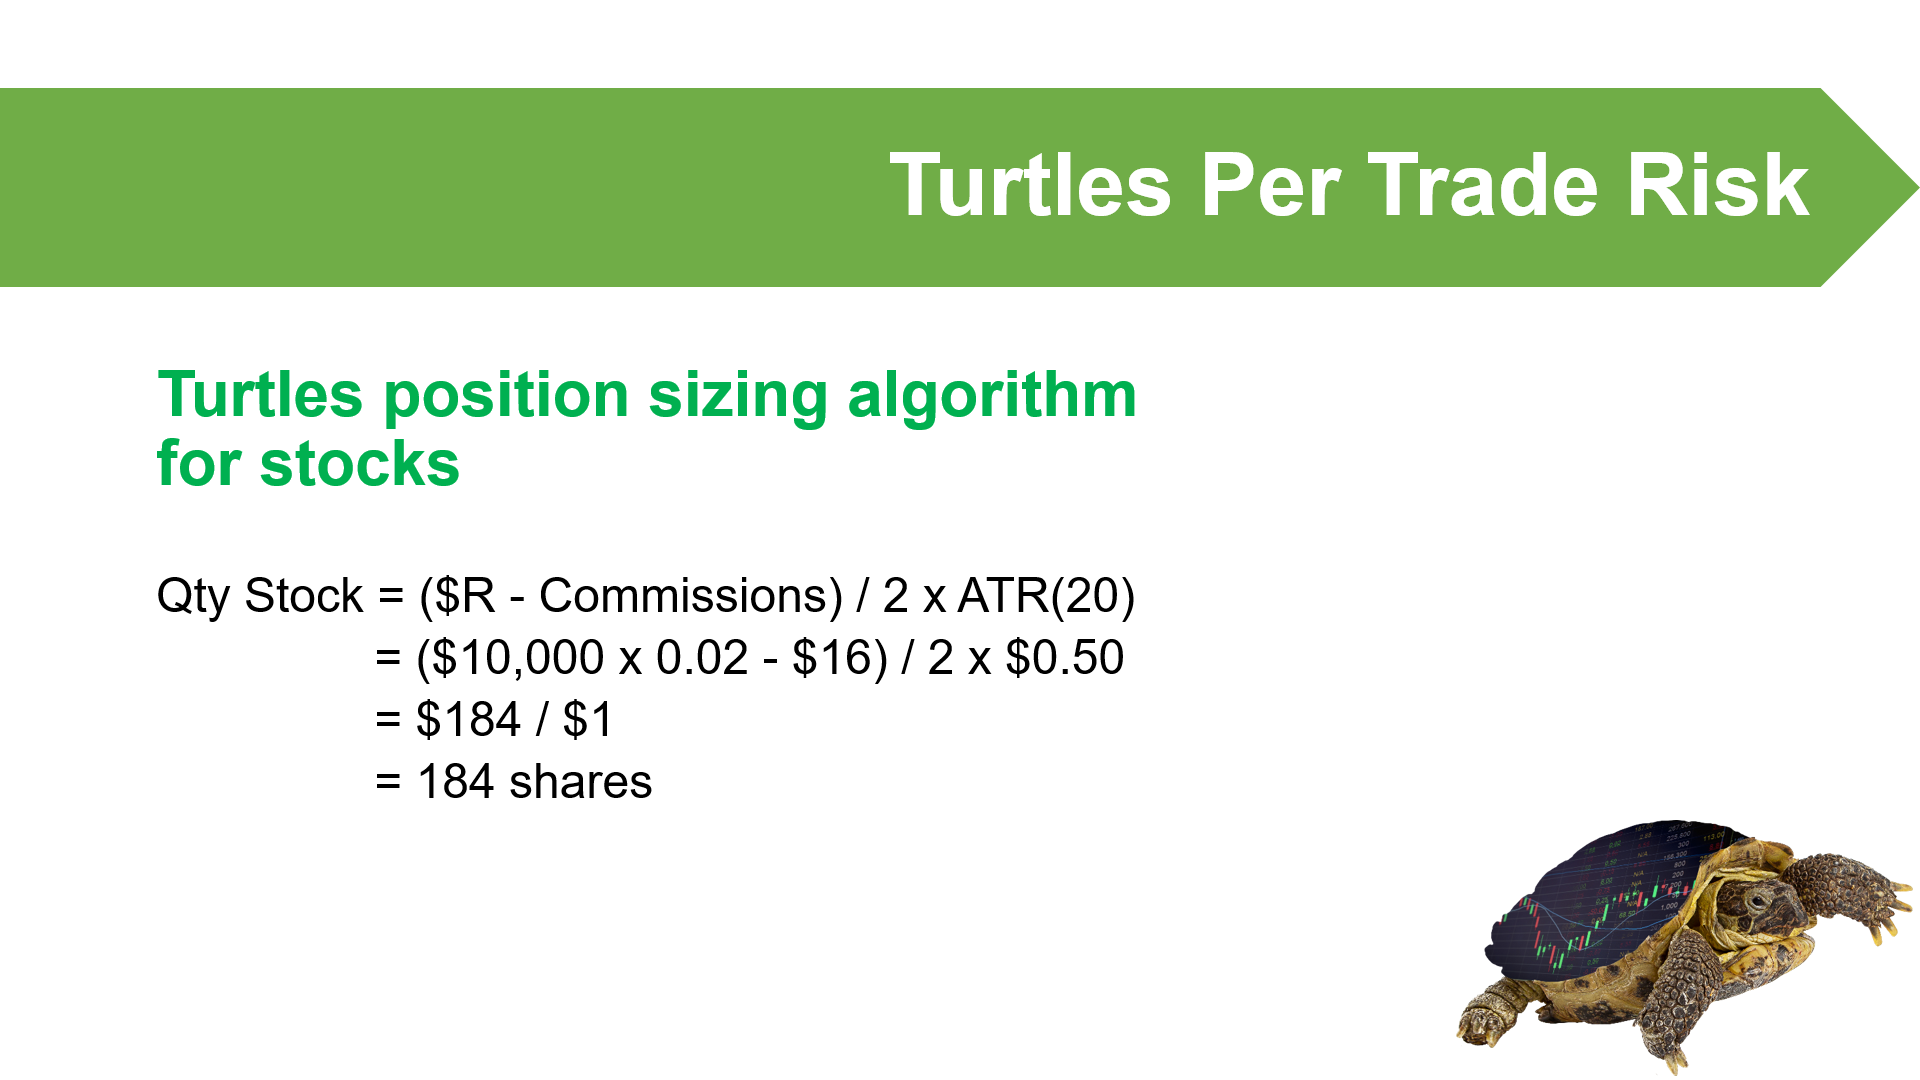
We find the number of shares of stock to buy by first working out how much we can risk on the trade. This is called $R. To work out $R, we simply multiply our trading capital of $10,000 by %R. $10,000 times 2 per cent is $200. So $R is $200, and we're committing to risk no more than this amount on the trade. Now, don't forget that we may also have trading commissions. Let's assume $16 for these, and therefore we'll base our position sizing calculation on $184. The next step is to divide into this amount the stop loss distance, which is two times ATR(20). If ATR(20) is 50 cents, then two times ATR(20) is one dollar. This means the number of shares we can trade is $184 divided by $1, which is 184 shares of stock.
The math of the position sizing algorithm ensures that the wider the stop loss, the fewer the number of shares we can trade for a fixed risk amount. This means that the more volatile a stock is, and therefore the greater its ATR, the fewer the number of shares we'll be allowed to trade. And this concept gave the Turtles extra protection against a really big, unexpected move that could skip past their stop loss.
Case Study: Turtles Entry
Let's look at a case study demonstrating the Turtles entry rules and position sizing concepts. The stock is Australian buy now pay later leader Afterpay (ASX: APT). We're going to rewind back to just after the COVID-19 pandemic, around April 2020. Afterpay had suffered a massive sell-off from around $40 per share to around $8 per share, but by April 9, which we are pretending is today, it had recovered to $22 per share. Let's investigate a potential S1 trade. The green line is joining together the highest high over the 20-periods on a rolling basis. Note that as prices fall after a peak, this line holds up until the previous highest high falls out of the 20-period sample. As they do, the green line trails lower to the next highest high, and the next, and so on. By April 9, it's sitting at $27.10. This means the trigger price for a potential S1 long trade is one tick, or one cent higher at $27.11.
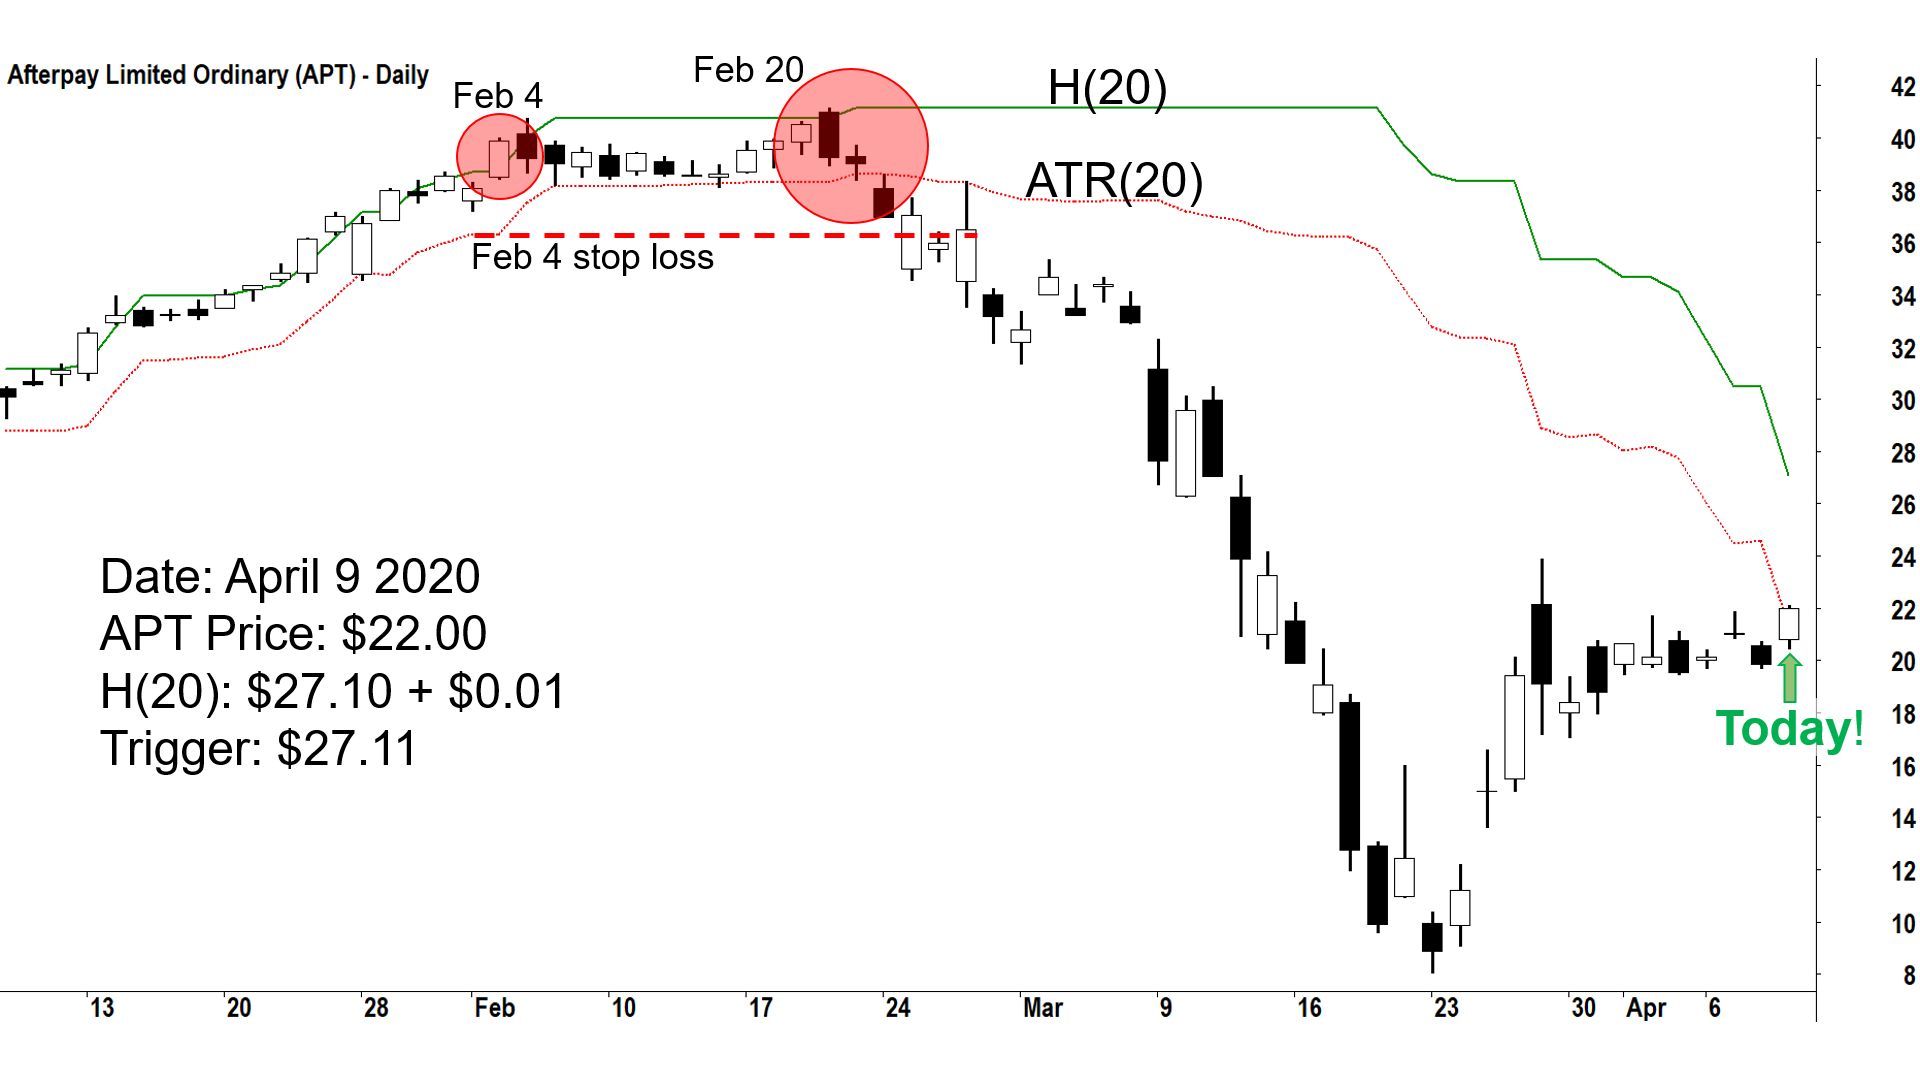
Before we get too excited, we have to check the status of our S1 filter. Remember, for an S1 trade to be valid, the last S1 trigger must have been unsuccessful. And this certainly appears to be the case. Looking at the last S1 trigger on February 20, the price certainly fell away sharply from there. In fact, February 20 marked the all-time high for Afterpay for quite some time to come. So, is this an example where the Turtles Trading System would have delivered a loss? To understand this, we need to check if the S1 trade prior to February 20 was successful or not. Looking at the chart, this trade occurred on February 4. Note that by February 20, this trade had not yet proven to be unsuccessful as it was still trading above its designated ATR(20) stop loss.
So, it turns out we weren't allowed to take the trade on February 20, and clearly we dodged a bullet there! The rationale behind the quirky S1 trade filter that requires the last trade to be unsuccessful has never been published, but I suspect it helped the Turtles avoid a number of 'false breakouts', much like the one we saw there on Afterpay. One thing is for sure though, Dennis would never have included this rule in his trading system if he wasn’t 100% sure it improved his system's expectancy.
How the Turtles exited trades
Ok, we now know how to get into trades using the Turtles Trading System, but 'getting in' is only half the battle! We still need to know how to get out. After all, it is at the 'getting out' point where we potentially lock in a big profit, or scoot away with just a small loss. Clearly, the Turtles were an extremely successful group of traders, so it follows their exit system must have been extremely effective at both maximising profits and minimising losses. Fortunately for us, just as with their trade entry parameters, the Turtles also had a clearly defined, simple, and efficient system for exiting a trade.
For System 1 long trades, an exit is required when the price trades below the lowest low of a 10-day lookback period. For System 1 short trades, an exit is required when the price trades above the highest high of a 10-day lookback period.
For System 2, the methodology is respectively the same for longs and shorts, but instead it uses a longer 20-day lookback period.
Let's now follow up the S1 and S2 trades from our Afterpay case study. The red line that sits under the price is the rolling lowest low over a 10-period sample. This is effectively our stop loss line. Notice how as the price rises, as in the case of a winning trade, the red line 'trails' higher beneath the price. In practice, we would adjust our stop loss higher and higher to match the red line as the trade progresses. For this reason, we call this type of stop loss a 'trailing stop loss'.
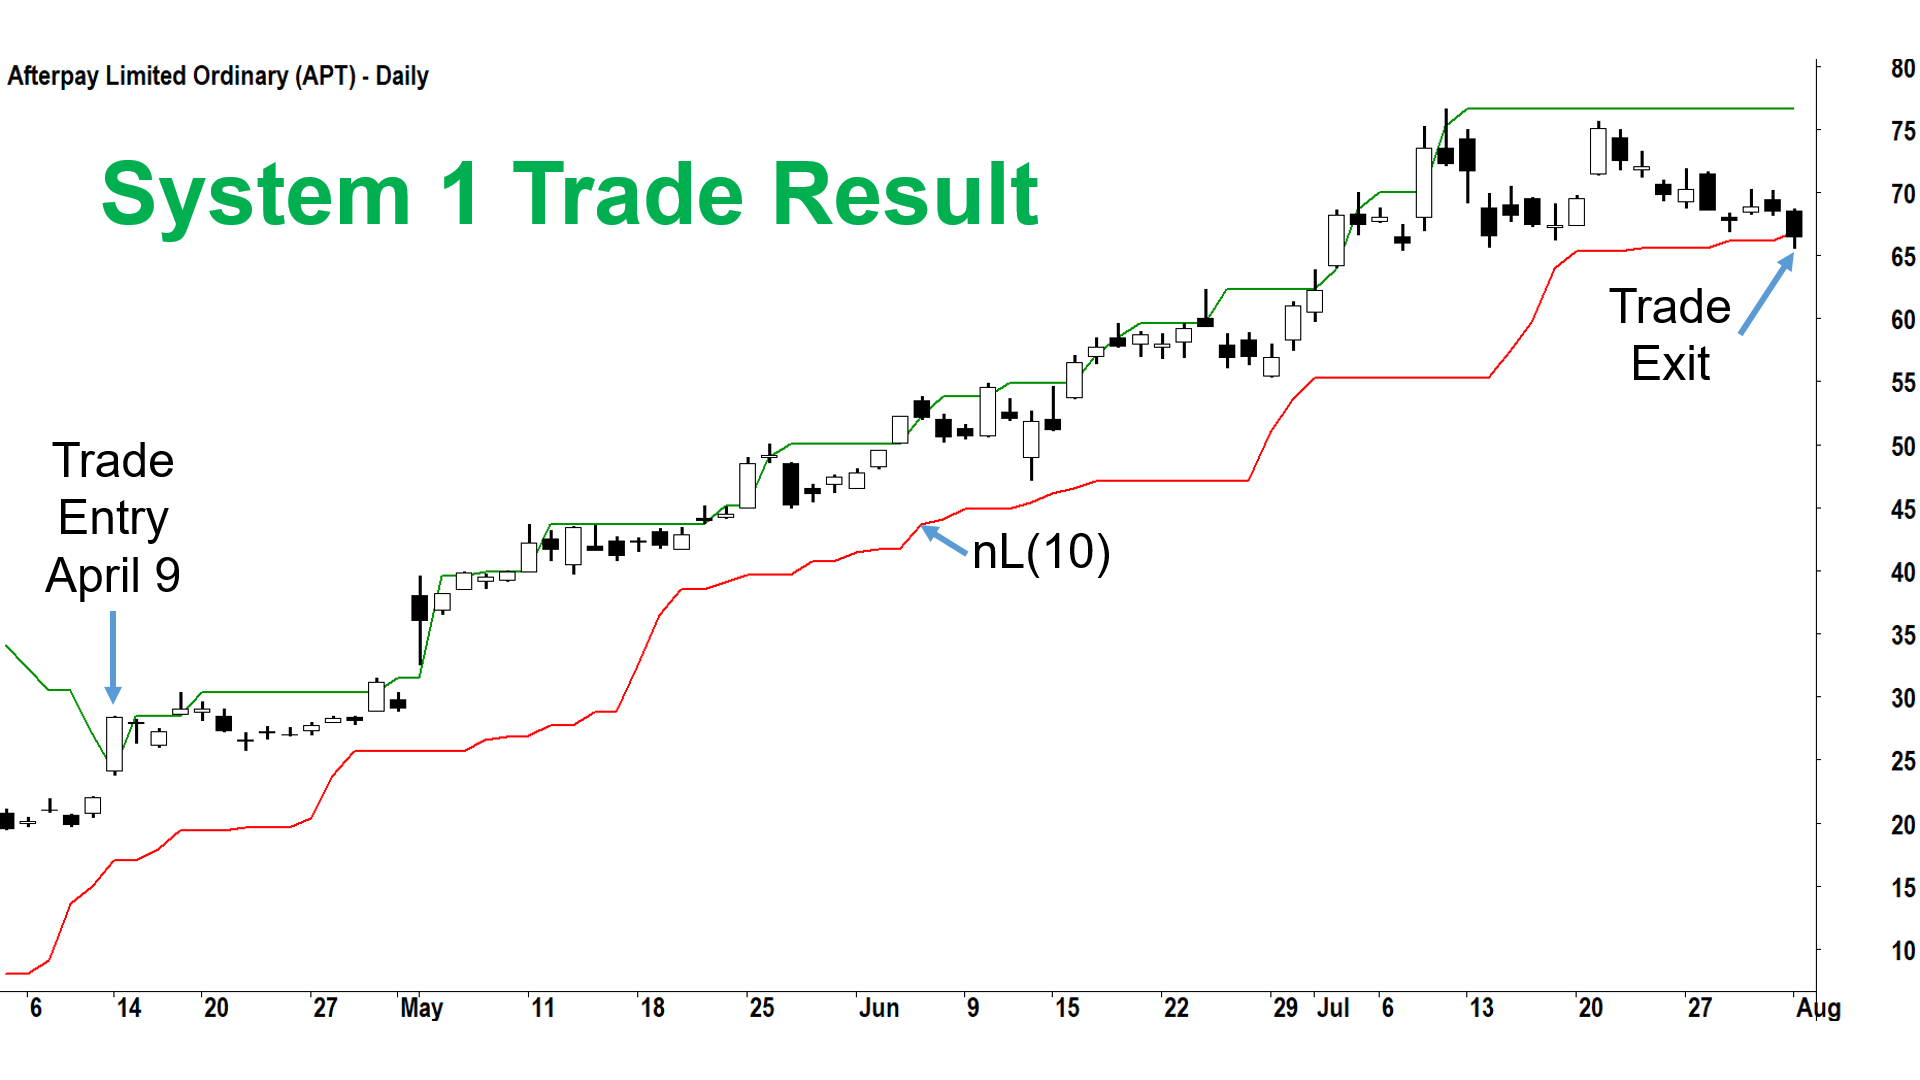
The S1 trade from April 9 eventually breached its 10-period low trailing stop loss in early August at around $65. So that's close to a 140% profit. The S2 trade, with its wider 20-period low trailing stop loss, it managed to hold on even longer until into the early nineties. This trade also resulted in well over a 100% profit. Of course, there would have been other trades to take in the meantime if we didn't happen to catch these two, and as we are going to see next, the opportunity to potentially add to a trade if we did.
Before we move on, here's a quick summary of how the Turtles exited a trade. The exit possibility was if their volatility stop loss was triggered. Subsequently, an exit would occur if their trailing stop loss was triggered. It is also worth following up here the definition of an 'unsuccessful' S1 trade. It follows from the exit rules above, that an unsuccessful System 1 trade has touched either its volatility stop loss or its trailing stop loss.
Turtles Trade Management
We've all heard the saying: "When you're onto a good thing, stick to it". We can see from our discussion so far that the Turtles Trading System certainly helped them to hold onto their winning positions. But, as far as the Turtles were concerned, a key part of exploiting a winning position involved adding to it. The act of increasing one's exposure to an existing trade is called 'pyramiding', and the Turtles were experts at it.
Turtles' trade entries were designed to enter a market at the start of a potentially big trend. They aimed to progressively pyramid into a trade as the trend got stronger and stronger. This ensured that if they did get themselves into a big move, the profits would be significantly magnified compared to if they had only traded one unit the whole way. But, if they got it wrong, their trusty stop losses were always there to afford them protection.
This idea of strategically maximising profits whilst carefully minimising losses is at the core of most great traders' strategies. Unfortunately, many novice traders do the exact opposite. As soon as they see a winner, they scurry away with a small profit, patting themselves on the back for being so clever. Yet, when the market goes against them, they grimly hang onto their losers in the hope that their loser will eventually get back to break even.
Typically, the turtles would add a new position to an existing position if the price increased by 0.5 times the ATR for the system they were using. The stop loss for the new trade would be set at the same point as the amended stop loss of the initial trade. This means that if an exit was triggered, the entire position would be exited at once.
In this way, the added position increased the risk by 2 per cent of overall capital, but the risk on the original trade was reduced by 0.5 per cent risk. But there was a limit to how many times a Turtle could add to a trade in the same market. The Turtles' trade management rules allowed for 3 additions plus the original trade entry within a single market. When combined with the trailing stops they used, this methodology was intended to limit the maximum exposure to the single market if there was a large shock that moved prices significantly against the trader.
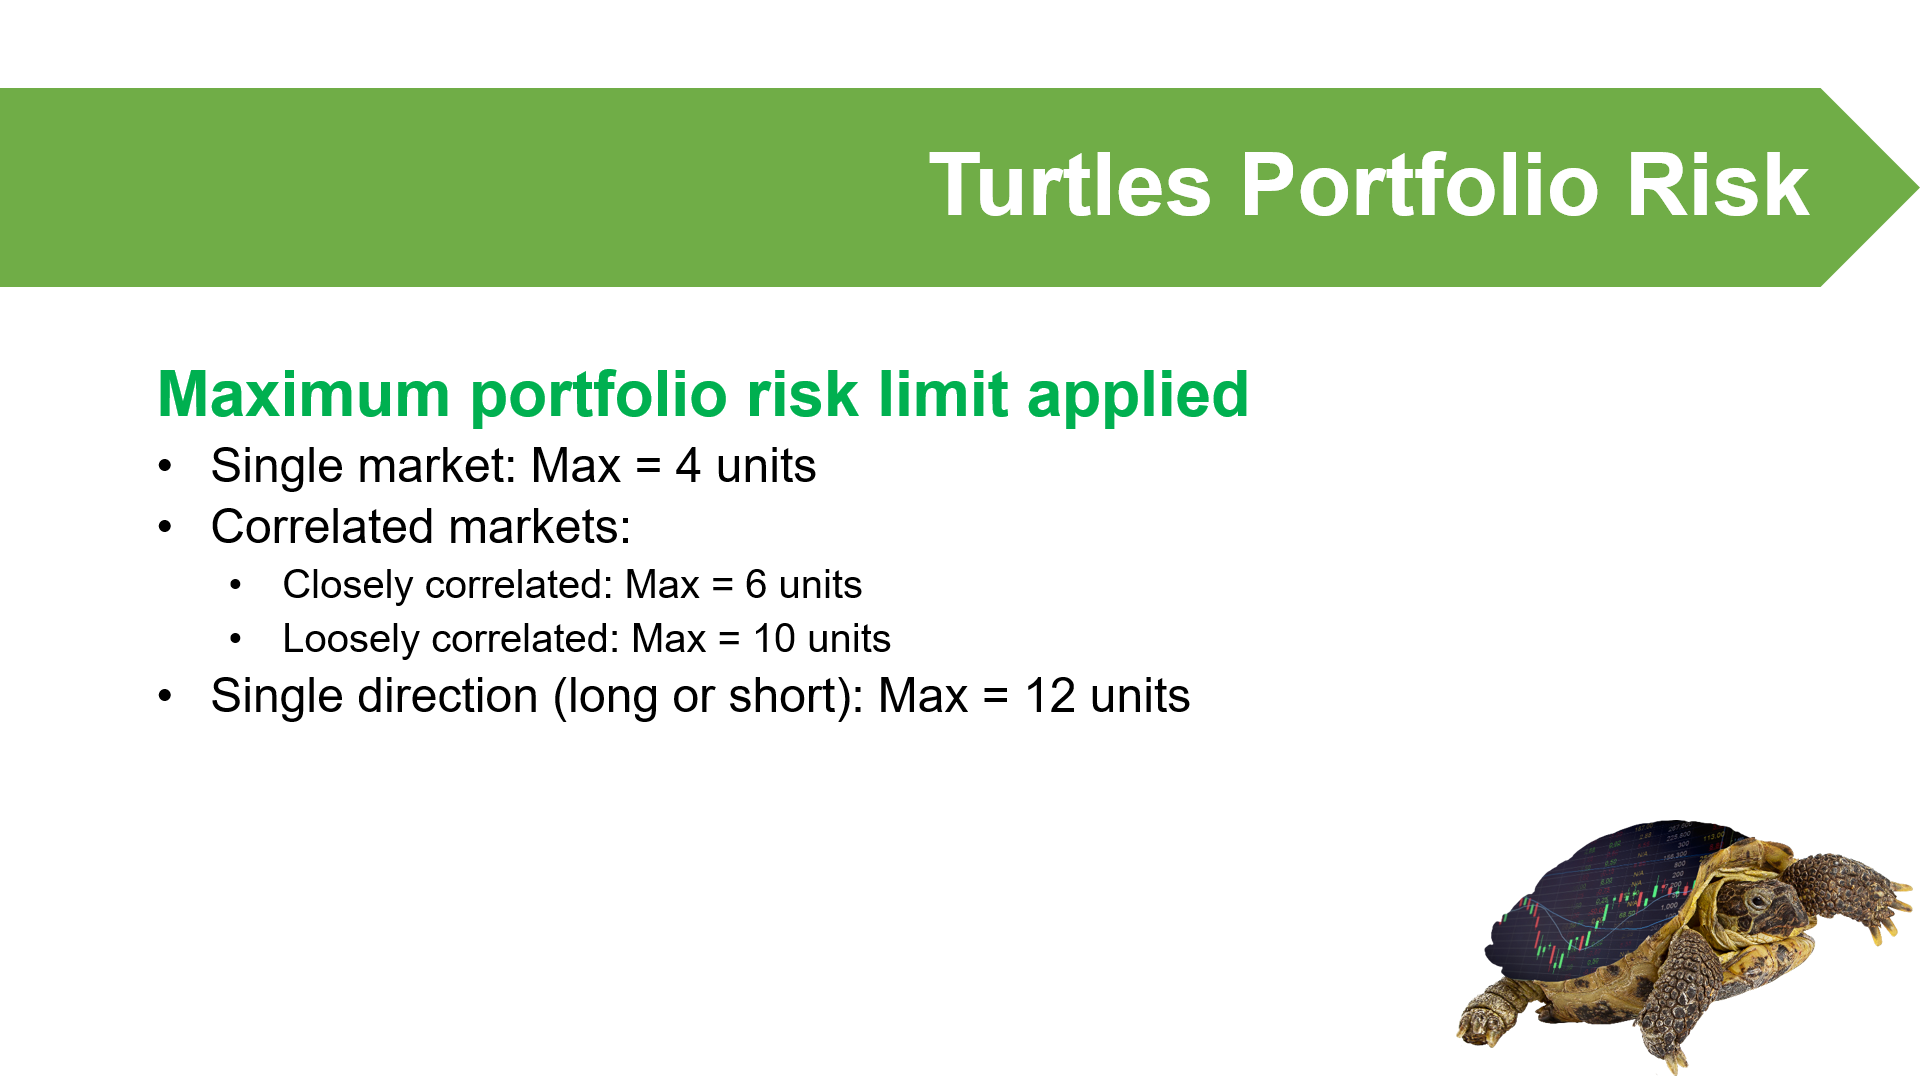
Turtles Portfolio Risk
In addition to limits on how much they could risk within a single market, the Turtles also has limits on how much they could risk across a range of markets. These limits were based upon the correlation between the markets being traded. Clearly, if two markets are closely correlated, that is, their prices tend to move in the same direction, a 4 unit risk in each market is going behave a lot like an 8 unit risk in a single market. This was an undesirable situation. As a result, the Turtles limited their risk in closely correlated markets to a maximum of 6 units, and across loosely correlated markets to a maximum of 10 units. The maximum number of units that could be applied to a single direction, i.e., long or short, was 12 units.
For stock traders, these limits aren't obviously transferrable. But if we consider that stocks within the same sector tend to move in a similar fashion, often because their earnings improve and deteriorate at the same time, we could classify them as closely correlated. Similarly, we could research which sectors within the stock market are loosely correlated, and therefore apply the appropriate portfolio management rule to trades across those sectors. It's also important to find trades both directions, that is, both long and short. In a Bull market, we'd certainly prefer to skew our portfolio to the long side, and likewise in a Bear market we'd look to skew our portfolio to the short side. Should the market suddenly turn from a Bull to a Bear, or vice versa, we'd have some natural protection within our portfolio against such a change. Again, we could use the Turtles' directional maximum risk exposure to limit our portfolio risk here.
Turtles Capital Management
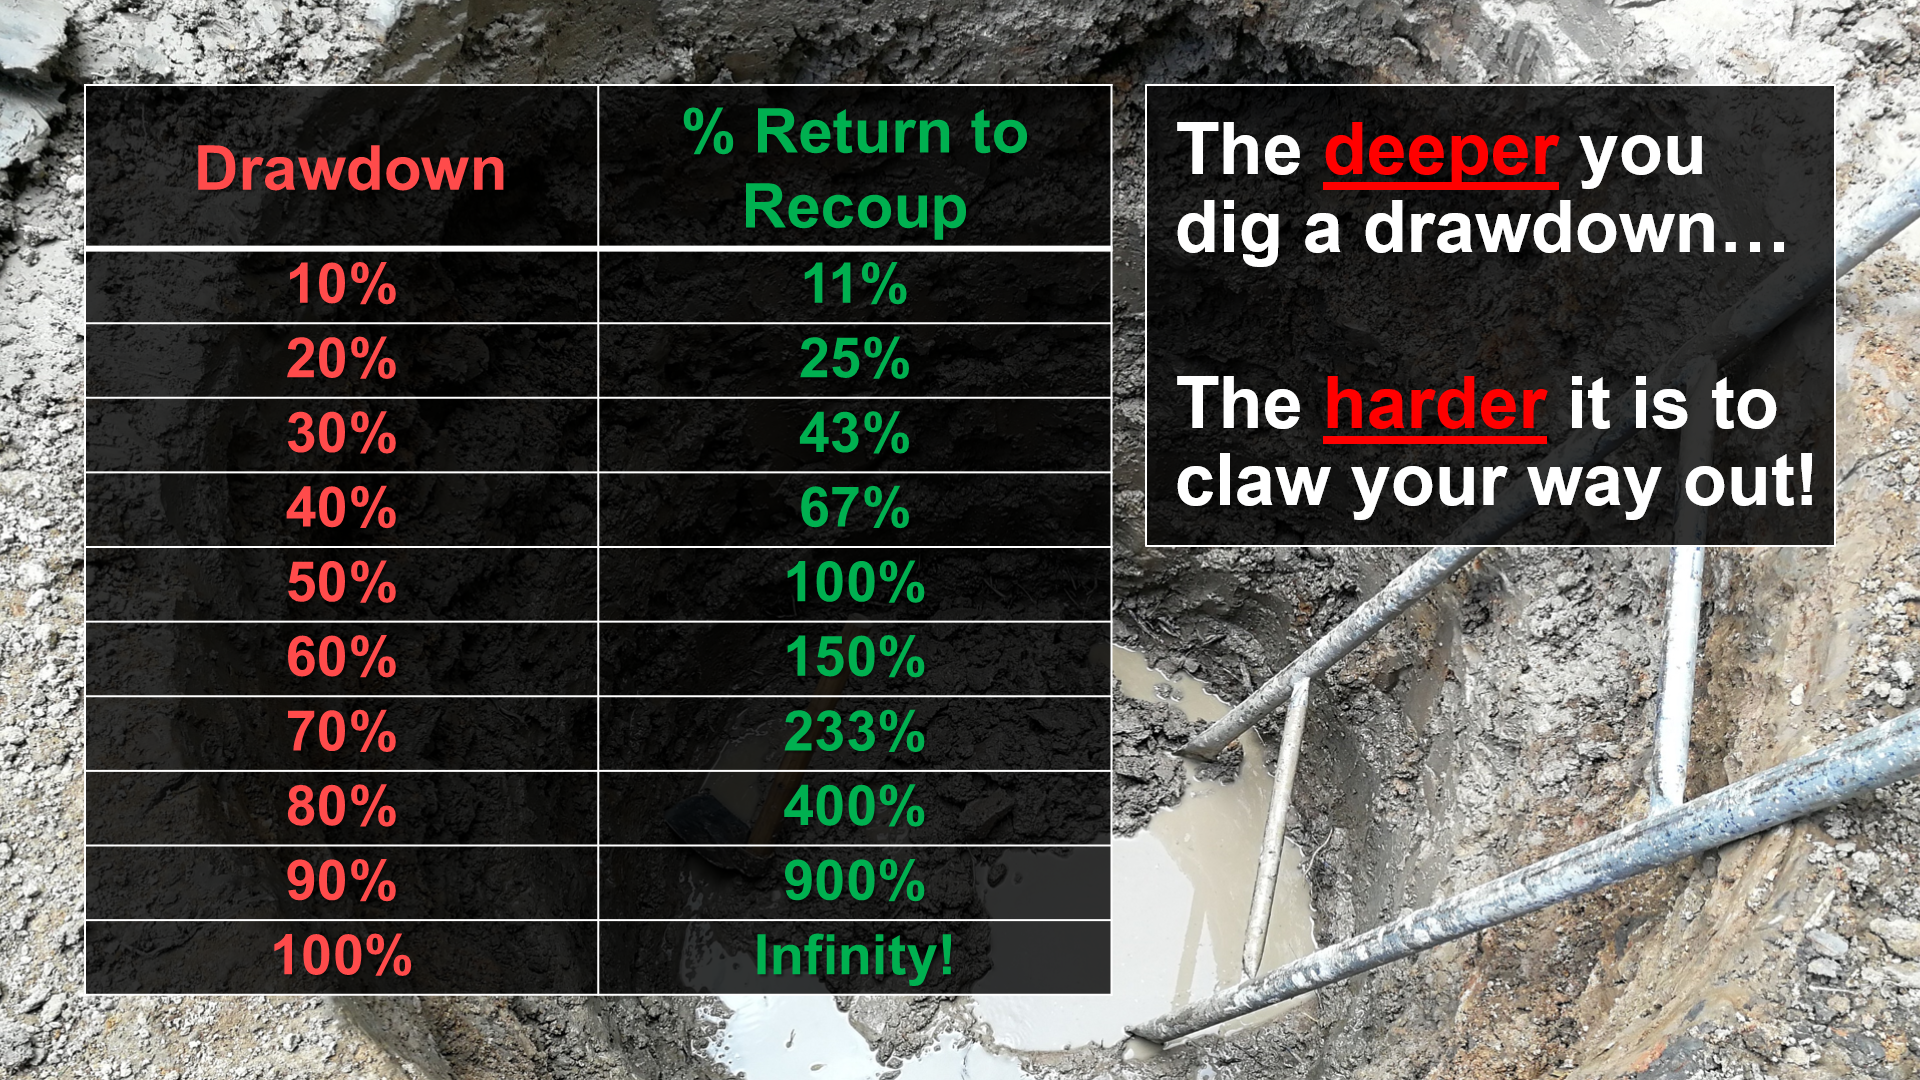
The final set of rules the Turtles used governed how they managed their capital during losing periods. A prolonged period of losses which results in a sustained deterioration of one's trading capital is referred to as a 'drawdown'. The problem with a drawdown, is that the bigger it is, the even bigger the magnitude of winning trades required to recover the loss. For example, if we experience a drawdown of 10 per cent, we'd have 90 of our original capital remaining, and therefore we'd need to make 11 per cent on this capital to get back to our starting balance. If we lost 20 per cent, we'd have to make 25 per cent, and so on. Looking down the table, it's going to be really tough to come back from a 50 per cent drawdown because we'd effectively have to double our money to recoup our losses. And you really don't want to go too much further down from there. You'll eventually get to a point, where regardless of how good your trading system is, the road back is impractically long. For this reason, the Turtles aimed to limit their drawdowns to manageable levels, that is, only to a point they were comfortable they could recover from.
Every trader knows the psychological pressure that comes with a drawdown. The Turtles trading system performed its best in strongly trending markets. So, when markets were range bound and choppy, the Turtles inevitably experienced periods of drawdown. In fact, drawdowns were a regular feature of Turtles trading. The following capital management rules enabled the Turtles to manage the magnitude of their drawdowns, but perhaps more importantly, it also enabled them to manage the stress that plagues most other traders when they experience a drawdown.
When a Turtle experienced a drawdown of 10 per cent, they reduced the position size of any new trades by 20 per cent. This process continued at each subsequent 10 per cent drawdown level. It ensured that during periods where their trading system was out of synch with the markets, they risked progressively less and less on their trades. If further losses were incurred, at least their impact became smaller and smaller. Conversely, as trading conditions, and eventually capital balances improved, Turtles would progressively scale back up their position size.
The winning secret
As we've shown in this article, the Turtles certainly had a comprehensive set of rules which governed exactly how they behaved in the market. It's worth reflecting now on your trading rules. Have you taken the time to consider what these are, what they should be, and more importantly, have you properly documented them? If we want to be successful, it's sensible and worthwhile to emulate those who are already successful. With this in mind, here are the key components the Turtles used which you'll need to ensure are part of your trading system.
The Turtles had a clearly defined set of rules for:
• Entering trades
• Exiting trades
• Per trade risk
• Trade management
• Portfolio risk
• Capital management
Most importantly, their system had positive expectancy.
On the whole, the Turtles were a wildly successful group of individuals who used a clearly defined system with an edge. However, few are aware that not all the Turtles made money. Some were unsuccessful and were eventually dropped from the program. All of the Turtles were given the same system to trade, so it is unfair to blame the system for the failure of some, and similarly, for the extraordinary success of others.
We must therefore conclude that there was something more to a Turtle's success than their system alone. So, what was the 'winning secret' the successful Turtles possessed that the unsuccessful Turtles did not? Perhaps Bill Eckhardt was correct, perhaps some people are better suited to trading than others!?
The answer lies at a personal level. Only those Turtles who stuck to the system with consistent, disciplined & patient execution succeeded. The Turtles who let their emotions get the better of them, and therefore strayed from the system, did the worst. Often, they strayed at times heightened emotional sensitivity, that is, during withering periods of losses or during euphoric periods of wins. Certainly, history is littered with failed traders who weren't Turtles who succumbed to their emotions and didn't achieve their goals. If anything, the Turtles experiment proved to us all that if we have a system with an edge, there is little reason to deviate from that system.
So, in conclusion, there is no winning secret, just excellent planning and execution. What are you waiting for? Get out there and start documenting your trading system right now. Who knows, you could be the next legendary trader we all read about in the Wall St. Journal!
Any opinions, news, research, analyses, prices or other information contained on this website is provided as general market commentary and does not constitute investment advice. ThinkMarkets will not accept liability for any loss or damage including, without limitation, to any loss of profit which may arise directly or indirectly from use of or reliance on such information.