Released and Expected Data
The manufacturing PMI of the Eurozone (August) 49.6 has come in lower than expected of 49.7 and lower than the previous of 49.8 while, the same data in the UK of 47.3 has come in higher than expected 46 but lower than previous of 52.1 indicating that the manufacturing sector in the UK is now officially in contraction.
Investors expect the final data of the US manufacturing PMI (August) at 6:00 pm UAE time, and then Fed Bostic Speech at 11:30 pm.
Indices and Bonds Yield
The US equity futures have declined by nearly 1% and European indices by more than 1% on hawkish statements from central banks’ board members in the United States and Europe. All members agree on that the priority is to tame high inflation levels and push them back to the 2% target. It is worth mentioning that Fed member Mester said that she favoured hiking rates above 4% with no rate cut in 2023.
Markets await the US non-farm payroll data (August) tomorrow and any higher-than-expected data increases the odds of a 75 bp rate hike in the September meeting. Having said that, investors will get more clarity from the inflation report of August.
The US 10-year bond yields hit a two-month high at 3.21%, on the bond’s selloff and pricing a rate hike to the range of 3.75% - 4.00% by the end of 2022.
Major FX Currencies
The US dollar index has steadied thanks to the Fed members’ hawkish statements and the energy crises that if continued could lead the European economy to a severe recession.
Technically, the dollar index price rebounded from the high end of the current trading zone 109.42- 108.11 and may be on the way test of the low end. A daily close below the low end opens the door for a further decline towards 105.42, while a daily close above the high end of the zone could encourage traders to rally the price towards 110.09.
The EUR/USD returned to trade above the parity level on as the market believed that the European Central Bank could hike rates by 75 bp instead of 50 in the next week’s meeting. It should be noted major economies in the eurozone such as Germany and Italy could suffer from a severe recession should Russia suspends completely gas exports to Europe however, it is unlikely to see Russia cutting off gas supplies completely and for a long time as this step comes with a heavy cost on the Russian economy.
Technically, the EUR/USD currently moving in the 1.0413-1.0000 trading zone could be trading towards 1.0142 and 1.0280 respectively. That said, any daily close below the low end of the mentioned trading zone may embolden traders to press towards 0.9701.
Commodities
The Gold price closed in red yesterday for the fifth month in a row, and today slipped by 0.3% as markets prefer the USD on Gold as a hedge for inflation thanks to the tight Fed policy.
Technically, a daily close below 1705 opens the door for more price decline towards 1685 and then 1669. On the other hand, a daily close above 1705 signals a possible rally towards 1720.
Global oil prices fell by nearly 1% due to these factors:
- A strong US dollar price
- Increased fears of a lower demand caused by a global recession and the slowdown in China’s economic outlook
- A higher supply should Iran revives its nuclear deal with the west
Technically, a daily close of WTI price below 87.13 could send the price towards 85.15 and 83.42 respectively. On the other hand, a daily close above 89.00 opens the door for the price to trade towards 93.57
EUR/JPY Daily Price Chart
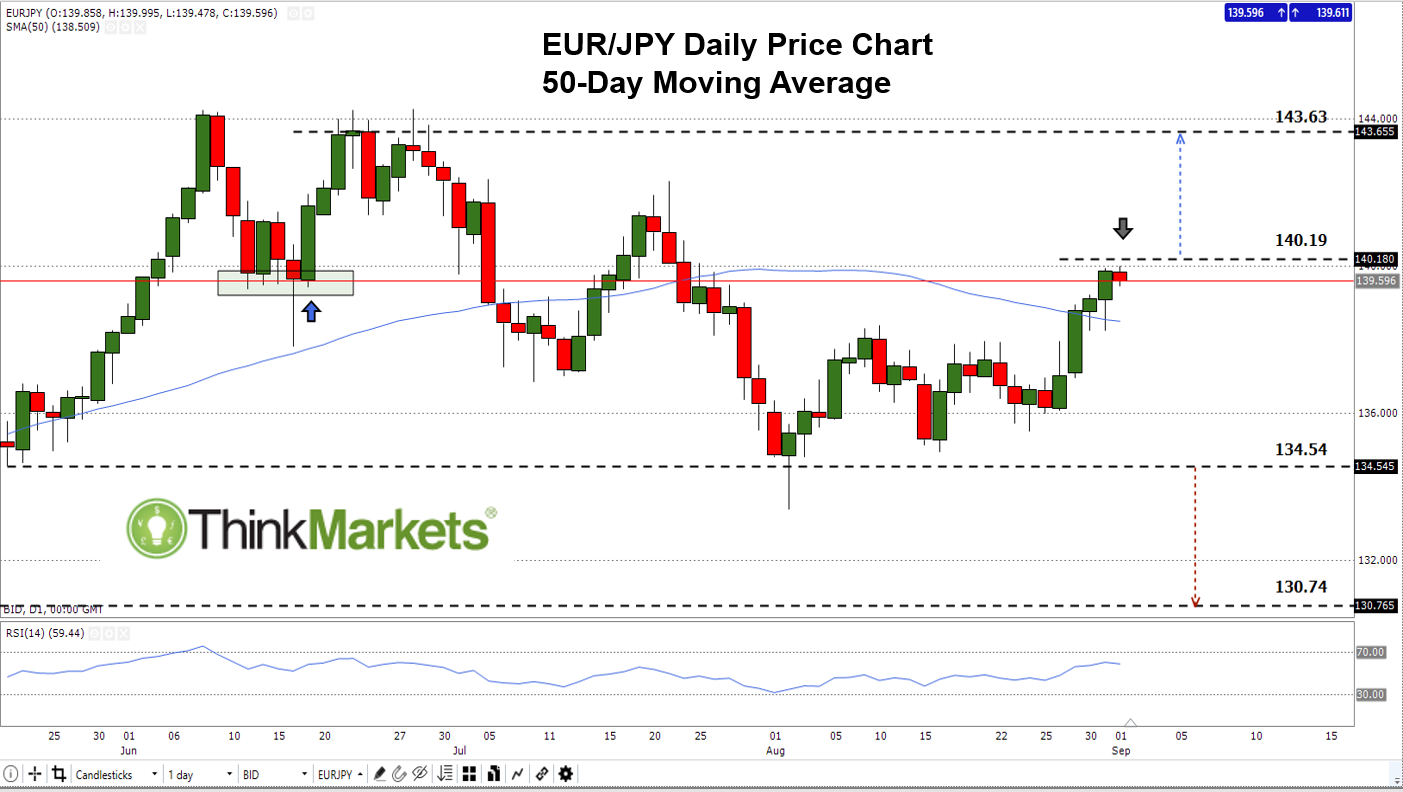
On August 16, the EUR/JPY corrected higher and created a higher low at 134.94 and trading in a sideways move since then, now the price moves in the trading zone134.54 - 140.19. A daily close above the high end of the mentioned trading zone could send the price towards 134.63, while any failure in closing above the high end signals a possible retreat towards the low end of the mentioned trading zone.
Any opinions, news, research, analyses, prices or other information contained on this website is provided as general market commentary and does not constitute investment advice. ThinkMarkets will not accept liability for any loss or damage including, without limitation, to any loss of profit which may arise directly or indirectly from use of or reliance on such information.

Learn and earn more today.
Visit our Education Centre