 DE
DE
Articles (17)
Trading the Non-farm payroll (NFP) report
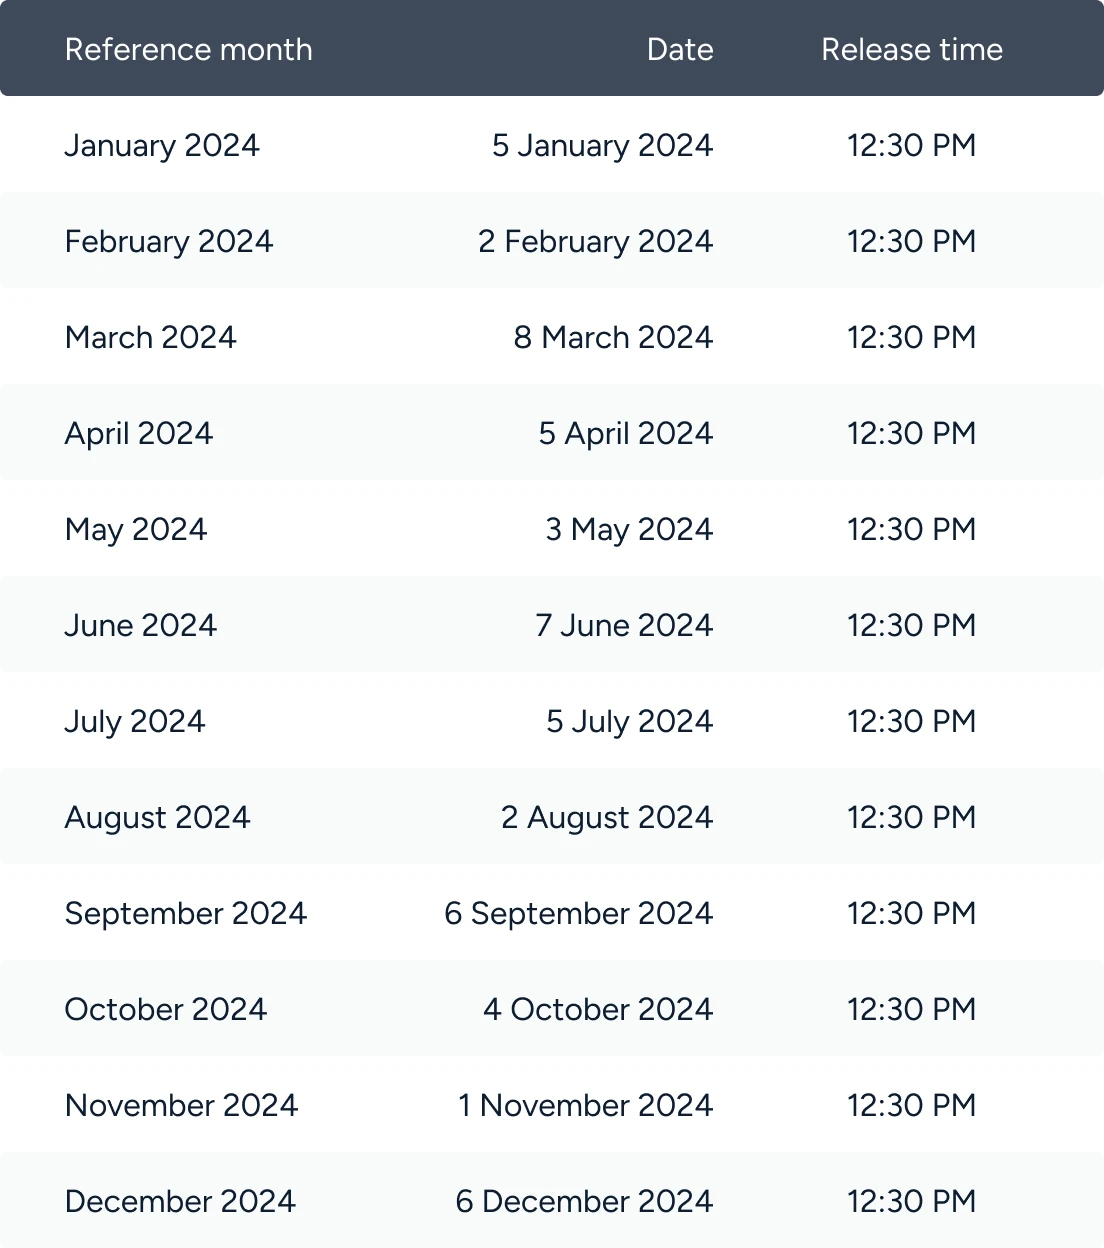
<h2>What is the NFP report?</h2> <p>Non-farm payroll (NFP) is a monthly report on nonfarm employment numbers in manufacturing, construction and goods, which totals to around 80% of US jobs. It contains information related to the unemployment rate, job growth, and other key employment statistics.</p> <p>The report does not include US jobs in private households, the federal government, nonprofit organisations, and as the name suggests, farm workers. Data within the Non-farm payroll report is measured by the <a href="https://www.bls.gov" target="_blank">Federal Bureau of Labor Statistics</a> through the Employment Situation report and is typically released on the first Friday of every calendar month.</p> <h2>Why is the Non-farm payroll important?</h2> <p>The report is an important economic indicator of how the US economy is performing, as it reports on the number of people employed or unemployed in the US. It is considered one of the most consistent news announcements that can cause large rate movements that result in volatile markets, particularly affecting major currency pairs in forex. As a stand-alone report, it is important in its own right, as an indication of whether the economy will strengthen or decline; for example, if the unemployment rate is high, it could indicate a declining economy.</p> <p>However, it is also an important piece of a jigsaw when looking at other key factors that influence the US economy, such as economic policy-making. Interest rates, for example, are set by the <a href="https://www.federalreserve.gov/monetarypolicy/fomc.htm" target="_blank">Federal Open Market Committee (FOMC)</a> in the monthly Federal Reserve meeting, and the board will look at the Bureau of Labor statistics NFP figures when deciding if they are going to lower or raise interest rates in their monetary policy. Changing interest rates will have a big impact on markets such as forex, commodities and stocks, and can cause big volatility.</p> <h2>Non-farm payroll report calendar</h2> <p>The NFP is released typically every first Friday of the calendar month at 13.30pm (GMT), below you can see the dates for 2023.</p> <p><img alt="NFP-calendar" src="/getmedia/7ade571b-7f2e-4ac4-acb2-32f69f83074d/NFP-calendar.png" style="width: 552px; height: 760px;" title="NFP-calendar" /></p> <h2>How does the NFP affect the markets?</h2> <p>The NFP report is important to traders as it can be a cue to analyse how other factors will adapt, such as the Federal Reserve and other government agencies, to attempt to move the economy in a certain direction. It is just one factor of many that can act as a catalyst for volatility and market price changes.</p> <p>The government will adapt policies to combat issues within the economy such as inflation or recession. If the NFP report indicates employment is dropping, it could indicate that the economy is declining. This, in turn, will prompt the Federal reserve to adjust interest rates to restore balance. If rates adjust, this will trickle down into the markets.</p> <h5>Trading on Non-farm payrolls</h5> <p>Firstly, monitor the report. The primary focus of the NFP report are the employment figures, mainly on jobs added or reduced. However, there are smaller components you can also watch out for when trading.</p> <p><strong>Take note of sector specific data</strong></p> <p>If the NFP report shows a decline in employment, traders will monitor which industries or sectors this decline is coming from. It could indicate the sector itself is struggling, which can have a knock-on effect to stocks and shares.</p> <p><strong>Don't just focus on figures, also focus on earnings</strong></p> <p>If average hourly earnings have dropped, but the employment figures are stagnant, this could also indicate a decline. It could also point to trouble where we could see the workforce output fall as employees could leave the workplace due to declining earnings. On the other hand, higher earnings could indicate wage inflation.</p> <p><strong>Monitor previous reports</strong></p> <p>As the scale of the NFP report is so large, it is often subject to large revisions of the previous headline figures. If this happens, it could cause a sudden jolt in the markets.</p> <p>When trading on the Non-farm payroll report, economists will try to predict what the headline figures (or NFP number) will be on a monthly basis, while also monitoring other reports, rates and financial events. Trades will then be placed on whether they think this result will make markets go up or down. The markets most affected by the NFP report are forex, indices and commodities.</p> <p style="text-align: justify;">A declining report may not be bad news for traders since it's possible to potentially benefit from this outcome with <a href="/en/trading-academy/cfds/what-are-cfds">contracts for difference (CFDs)</a>. CFDs allow you to trade volatile markets whether they go up or down; you just need to correctly predict which way the market will go by going long or short. You can use <a href="/en/trading-academy/cfds/risk-management-tools-in-cfd-trading">risk management tool</a> such as stop loss and take profit to minimise your risk, but as always with trading, act with caution. Plan your strategy, monitor reports such as the NFP and take advantage of our built-in economic calendar to monitor other major financial events on our award-winning app ThinkTrader.</p>

What is the Consumer Price Index (CPI), and how does it affect the markets?
<p>What is the Consumer Price Index (CPI), and how does it affect the markets?</p> <h2>Types of CPI</h2> <p>The BLS regularly produces official CPI estimates based on two population groups – CPI for all urban consumers (CPI-U) and CPI for urban wage earners and clerical workers (CPI-W).<br /> <br /> The CPI-U covers almost 93% of the entire US population and is the main report used by the Federal Reserve. As such, when we talk about the CPI in this article, we’ll be pertaining to the CPI-U data.<br /> <br /> On the other hand, the CPI-W covers the prices paid by urban wage earners, clerical workers, self-employed individuals, short-term workers, unemployed individuals, and retirees.</p> <h2>How is the CPI market basket determined?</h2> <p>The US Bureau of Labor Statistics (BLS) surveys consumers in private households nationwide as a reference population, collecting information on their spending habits and frequently purchased items. The data collected determines the weight of the item categories in the CPI index structure.</p> <h2>What goods and services are covered by the CPI?</h2> <p>The BLS classified the average American expenditure and consumption patterns into eight major categories.<br /> <br /> <img alt="" src="/getmedia/a8ab296c-c0f7-4830-a75a-e9f3738c5890/article-what-is-cpi-pie-diagram.webp" style="width: 338px; height: 336px;" /></p> <ol> <li>Housing </li> <li>Food and beverages </li> <li>Transportation </li> <li>Commodities </li> <li>Healthcare </li> <li>Energy prices </li> <li>Education </li> <li>Other expenses</li> </ol> <p><br /> The change in price over time for each category is weighed and averaged to create the CPI data.</p> <h3>How is the CPI calculated?</h3> <p>The BLS enlists the help of price collectors to survey over 80,000 price data from 23,000 retail and service establishments throughout the country. They also monitor over 50,000 housing units to calculate the average price changes in rental properties.<br /> </p> <p>Below is the formula to calculate the annual CPI.</p> <br /> <br /> <strong>Annual CPI = (value of goods and services for the current year/value of goods and services in the previous year) x 100</strong><br /> <br /> Let’s look at an example to visualise it further. The price movements below are for illustrative purposes only, and the figures are oversimplified. Let’s assume that this table is the current total expenditure of an average urban consumer for 2021 and 2022.<br /> <br /> <img alt="" src="/getmedia/677c64a3-9049-4aa7-986f-26f99c025c46/article-what-is-cpi-table-expenditure.webp" style="width: 427px; height: 467px;" /> <p>Below is the formula to calculate the CPI.</p> <img alt="" src="/getmedia/ec721e29-4b2e-4159-8d81-778949e8dd49/article-what-is-cpi-calculation-annual.webp" style="width: 552px; height: 104px;" /><br /> <br /> Given this calculation, the annual <strong>CPI for 2022 is 112.31.</strong> <h2>How is the inflation rate calculated from the CPI report?</h2> <p>Inflation is the rise in prices of goods and services. The rate at which prices increase is called the inflation rate.<br /> <br /> A steady inflation rate is a significant economic indicator symbolising a country’s economic health. High inflation rates mean prices rise rapidly at the expense of the general public’s purchasing power. A low or negative inflation rate, called deflation, is also negative as the economy has become stagnant.<br /> <br /> <a href="~/en/trading-academy/federal-reserve">The Federal Reserve</a> aims to keep the inflation rate at 2% in the US. The Fed uses the CPI published monthly by the BLS to measure inflation. Below is the formula to calculate the US inflation rate:<br /> <br /> <strong>Inflation rate = (current CPI – previous CPI) x 100</strong><br /> <br /> Let’s use the example above to illustrate. Let’s assume that the 2021 CPI is 101.4.<br /> <br /> <img alt="" src="/getmedia/e443f689-1573-4297-ac57-af171047ca19/article-what-is-cpi-calculation-inflation.webp" style="width: 277px; height: 232px;" /><br /> <br /> Given this calculation, the inflation rate from 2021 to 2022 is 10.91%. That means the price of consumer goods and services rose by 10.91%.</p> <h2>How does the CPI affect the markets?</h2> <p>The release of CPI data is one of the most anticipated events by traders. It is normal to see volatility in charts before and after the release. However, one thing to note is that traders do not react to the CPI data. Traders react in anticipation of the Federal Reserve’s actions with regard to the CPI report.<br /> <br /> The Federal Reserve looks at the CPI report, the Price Producer Index (PPI), and the Personal Consumption Expenditures (PCE) price index to determine whether they should adjust the current monetary policy.<br /> <br /> The current mandate of the Federal Reserve is to keep inflation at a steady 2%. Suppose the rate falls below or above this level. In that case, the Fed may implement either an expansionary monetary policy, lowering the interest rates to stimulate the economy or a contractionary monetary policy, increasing interest rates to reduce the money supply in circulation.<br /> <br /> To find out how these policies affect the markets, read our article on the <a href="~/en/trading-academy/federal-reserve">Federal Reserve</a>.</p>
What is technical analysis in trading?
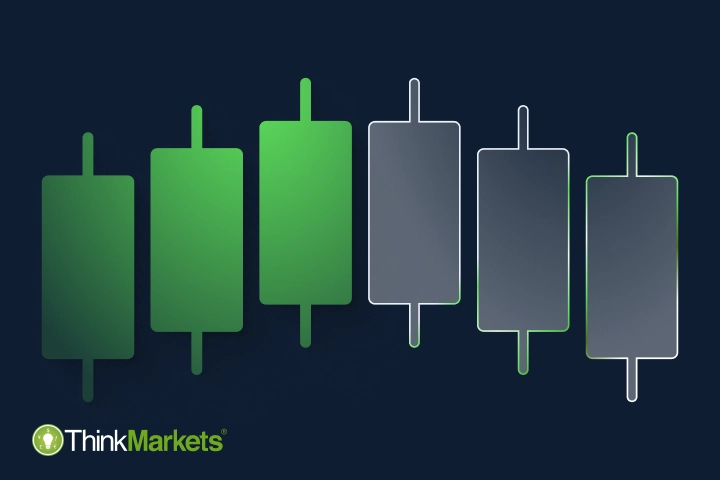
<p>The most important part of any trading strategy is knowing when to enter and exit the market. In our previous trading guides and articles, we covered various factors influencing price movements in financial markets, such as economic indicators and political climate.<br /> <br /> Analysing such factors is called fundamental analysis, and it is a very popular method to evaluate future price movements among traders.<br /> <br /> However, some traders consider insights found with the help of fundamental analysis insufficient to provide exact buy and sell levels. That’s where technical analysis can be useful.</p> <p>In this article, we’ll explain what technical analysis is, how it works, and its main types.</p> <h2>What is technical analysis?</h2> <p>Technical analysis is the process of evaluating past price movements of an instrument to determine its future moves. The reason it’s called technical is because it’s based purely on statistics and is not affected by news, economic or political factors.<br /> <br /> While this method is widely used by traders all over the globe, it’s important to understand that past prices don’t predict or dictate future prices, and all the insights gathered with the help of technical analysis are solely indicative.<br /> <br /> Technical analysis includes multiple tools. An experienced technical analyst usually uses various combinations of them to compare results and make an informed trading decision. These tools can be divided into three categories: trend lines, chart patterns and technical indicators.<br /> <br /> All three analyse price charts. So whichever type you choose, the single most important thing is to learn how to read price charts.</p> <h2>What is a price chart?</h2> <p>A price chart in trading is a graphic sequence of historical prices of an instrument. Charts are at the heart of trading as they help traders to monitor the value of their current positions, analyse past price movements and get cues as to where the price may move next. Understanding how to read a price chart is a key step in learning technical analysis.<br /> <br /> Each trading platform offers a different set of various chart types, and the choice depends purely on a trader’s personal preference. ThinkMarkets’ proprietary platform ThinkTrader, for example, has over 15 different charts to accommodate traders’ needs.<br /> <br /> <img alt="" src="/getmedia/6aae82dc-4ad4-43ba-9b7b-fdbf2373e549/article-what-is-technical-analysis-price-chart-1.webp" style="width: 552px; height: 464px;" /><br /> <br /> Some popular ones are candlestick, bar and line charts:<br /> <br /> <img alt="" src="/getmedia/ffc042b3-bc5a-4a9e-81e8-da5cb1ba5b5c/article-what-is-technical-analysis-chart-types.webp" style="width: 552px; height: 258px;" /><br /> <br /> As a candlestick chart is the most commonly used by traders, let’s see how it works in detail.</p> <h2>Candlestick chart</h2> <p>A candlestick chart is called so because each unit of it looks like a candle. The time frame of candles can be adjusted from one minute to one month, depending on the strategy:<br /> <br /> <img alt="" src="/getmedia/0f95f823-f6c9-42e1-a8f7-dcfb6ace79e7/article-what-is-technical-analysis-candlestick-chart.webp" style="width: 552px; height: 431px;" /><br /> <br /> Regardless of the chosen time frame, each candle consists of two main elements: the wick and the body that represent four prices of an instrument:</p> <ul> <li>Opening price</li> <li>Highest price reached during the chosen period</li> <li>Lowest price reached during the chosen period</li> <li>Closing price</li> </ul> <p><br /> The candles are coloured depending on whether the market rose or fell during the selected timeframe. Green candles (white on some platforms) indicate rising or bullish prices, and red (black) represent falling prices, also called bearish.<br /> <br /> <img alt="" src="/getmedia/38272a03-b39f-4a17-85b3-e0377aacfc0a/article-what-is-technical-analysis-candlestick-wicks.webp" style="width: 552px; height: 327px;" /><br /> <br /> In technical analysis, it is exactly the relationship between individual candlesticks that helps traders predict a future price movement.</p> <h2>Types of technical analysis</h2> <p>As we mentioned above, technical analysis tools can be segregated into three categories: trend lines, chart patterns and technical indicators.</p> <h5>Trend lines</h5> <p>Prices never move in straight lines. Influenced by many factors, they move up and down, forming highs and lows. A trend means the overall direction of the price movements. Trend lines are just straight lines that traders use to connect highs and lows on a price chart to identify a trend. Some trend lines, such as support and resistance, are used to identify an entry and exit level before opening a position.<br /> <br /> In one of our following articles, we’ll explain how trend analysis works and how to identify a trend in detail.</p> <h5>Chart patterns</h5> <p>A chart pattern is a graphic sequence of lines that can be identified on a price chart. Chart patterns are very popular among traders as they can often signal the beginning, end, strengthening or weakening of a trend.<br /> <br /> We’ll go through the most popular patterns in one of our next articles as well and explain how they work.</p> <h5>Technical indicators</h5> <p>Technical analysis indicators are mathematical calculations based on historical data and used to identify price action. As complex as it sounds, traders don’t need to do the actual math. Every trading platform offers technical indicators that can be simply applied to a price chart. The main goal for a trader is to learn how to read them.<br /> <br /> Depending on their types, technical indicators can analyse trend direction and strength and identify potential entry and exit points. We will cover this topic in detail in our following articles too.<br /> <br /> For now, to start getting familiar with technical analysis, we suggest creating a <a href="~/en/demo-account">risk-free demo account</a> on ThinkTrader and studying various price charts. You will be able to use the same platform to continue your journey with technical analysis, as it offers an extensive suite of analytical tools.<br /> </p>
Hanging Man vs Shooting Star candlestick patterns
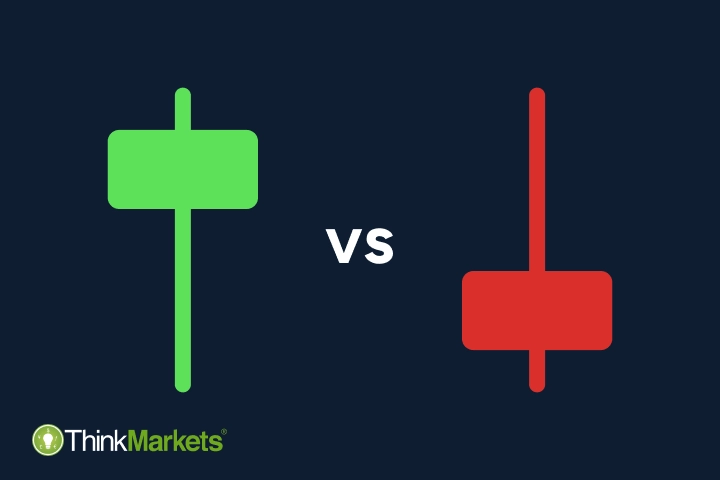
<p paraeid="{a93e94ed-6fea-4c9f-a350-f7bc6677a4d1}{52}" paraid="1878194966">The hanging man and shooting star candles are often considered a part of the hammers group, along with the hammer and inverted hammer. All four patterns are indeed very alike in their structure and are single-candle reversal chart patterns.<br /> <br /> As we mentioned in our previous article about <a href="~/en/trading-academy/forex/analysis/hammer-and-inverted-hammer-candlestick-patterns">hammer candle stick patterns</a>, the main difference is that the hanging man and shooting star appear in uptrends, while both hammers occur in a downtrend. Hence, the hanging man and shooting star patterns are considered bearish – the opposite of bullish hammers.<br /> <br /> <img alt="Hanging Man vs Shooting Star vs Hammer vs Inverted Hammer" src="~/getmedia/7bdfd60c-d229-4aa6-ade5-26a2e31a7679/Hanging-Man-vs-Shooting-Star-vs-Hammer-vs-Inverted-Hammer.png" /></p> <h2 paraeid="{a93e94ed-6fea-4c9f-a350-f7bc6677a4d1}{52}" paraid="1878194966">Hanging man candlestick pattern</h2> <br /> A Hanging man formation is the uptrend version of a hammer candlestick. Their structures are virtually the same – little to no upper shadow (wick), a small body with the high, closing and opening price close to each other and a long wick extending to the bottom. The lower wick is usually at least twice as long as the body. <br /> <br /> <img alt="Bearish and bullish Hanging Man pattern" src="~/getmedia/8c89ad4d-4b7e-43a4-bc9e-c257d070c474/Bearish-and-bullish-Hanging-Man-pattern.png" /><br /> <br /> A Hanging man candle can also be bullish (green) and bearish (red). Since this is a bearish reversal pattern, the red version of it is usually considered a stronger indication of the potential trend reversal.<br /> <h2>Shooting star candlestick pattern</h2> A shooting star candle is the uptrend version of the inverted hammer candlestick. Its short body is created by the closing, opening and high prices located near each other and a twice as long wick protruding upward. A lower shadow is usually either very short or doesn’t occur at all. <br /> <br /> <img alt="Bearish and bullish Shooting Star candlestick pattern" src="~/getmedia/a10c2061-e0ae-4a23-a28f-01798e0bd049/Bearish-and-bullish-Shooting-Star-candlestick-pattern.png" /><br /> <br /> Similar to the hanging man candle, a bearish shooting star formation is considered stronger due to the overall bearish nature of the pattern. <h2>How do hanging man and shooting star candles work?</h2> <br /> Occurring in an uptrend, both hanging man and shooting star indicate that the trend is losing its momentum, and bears are trying to overpower the bulls.<br /> <br /> The hanging man candle tells us that, although bulls still have some power that helped them to achieve a high close, bears were powerful enough to push the price much lower to create a long wick at the bottom.<br /> <br /> The shooting star pattern is considered stronger than the hanging man candle because bears managed to push the closing price to the bottom despite the long wick at the top created by bulls. <h2>How to trade with a hanging man and shooting star</h2> When a hanging man and shooting star patterns occur, traders have two options. The first option is to go short right away, using the candle’s closing price as an entry point and its high price as a stop loss. The second option is to wait for two to three candles to close and confirm a trend.<br /> <br /> There is no right or wrong decision, as it depends purely on the trader’s perception and risk appetite. However, it is important to keep in mind that neither hanging man nor shooting star candles serve as a direct trading signal. Just like any other chart pattern or technical indicator, they only suggest that a bullish trend is weakening, and price reversal may occur. It doesn’t necessarily mean that the price will reverse right after the hanging man or shooting star candle – it may take some back and forth between bulls and bears.<br /> <br /> As you can see on the image below, a shooting star was formed at the end of the uptrend. However, the price didn’t reverse immediately. It took a hanging man and some side traction for bears to assume power and turn the trend downward.<br /> <br /> <img alt="Identifying Shooting Star and Hanging Man candlestick patterns in a price chart" src="~/getmedia/c3064b11-26bb-441e-979f-6e7c8351b039/Identifying-Shooting-Star-and-Hanging-Man-candlestick-patterns-in-a-price-chart.png" /><br /> <br /> It may also be helpful to confirm the trading signal you identified with other technical analysis tools, such as <a href="/trading-academy/forex/analysis/trendline-in-technical-analysis">trendlines</a> and <a href="/trading-academy/forex/analysis/technical-indicators-beginners-guide">technical indicators</a>.<br /> <br /> Another important set of tools to use are risk management tools – stop loss and take profit. We suggest using them at all times to prevent larger than expected losses.<br /> <br /> Create a free demo account to practise identifying Hanging Man and Shooting Star candlesticks and opening positions in a risk-free environment. To discover more helpful chart patterns, head to our next article, where we will explain how a s<a href="/trading-academy/forex/analysis/spinning-top-candlestick-pattern">pinning top candle</a> works.
What are bullish and bearish Flag patterns?
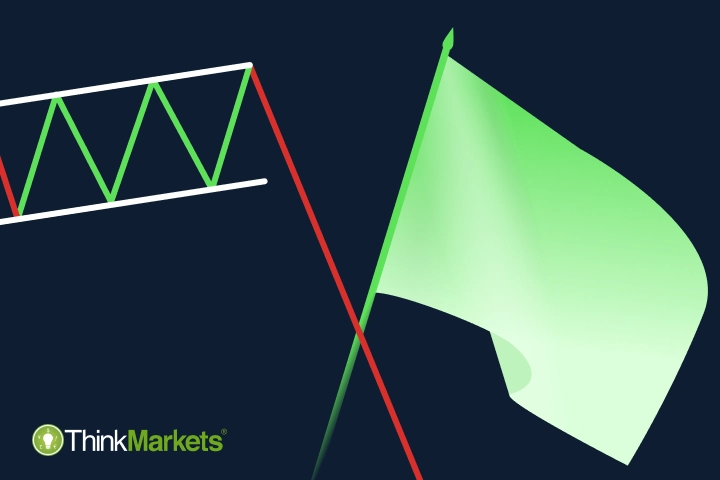
<p paraeid="{a93e94ed-6fea-4c9f-a350-f7bc6677a4d1}{52}" paraid="1878194966">Multi-candle chart patterns work roughly the same way as one-, two- and three-candle formations covered in previous articles. However, these formations don’t have a defined number of candles and serve as an indication of either continuation of the preceding trend or its reversal. </p> <p paraeid="{a93e94ed-6fea-4c9f-a350-f7bc6677a4d1}{100}" paraid="120959535">Bullish and bearish flags are continuation candlestick patterns that suggest that the current trend will resume after a short consolidation period. </p> <h2 aria-level="2" paraeid="{a93e94ed-6fea-4c9f-a350-f7bc6677a4d1}{112}" paraid="424967598" role="heading">Bullish flag chart pattern structure </h2> <p paraeid="{a93e94ed-6fea-4c9f-a350-f7bc6677a4d1}{118}" paraid="1431684069">As the name suggests, a bullish flag looks like a flag on a pole. <br /> <br /> <img alt="A graphical representation of a bullish flag pattern with a clear upward pole, followed by a consolidation zone and an upward breakout." src="~/getmedia/28d51a80-4048-4363-b2ef-3caeb2d92d3d/bullish-and-bearish-Flag-patterns.png" /><br /> <br /> </p> <p paraeid="{a93e94ed-6fea-4c9f-a350-f7bc6677a4d1}{151}" paraid="931113550">This pattern consists of a distinct pole comprising several candlesticks, a body in the opposite direction of the main trend and a breakout. To be considered a bullish flag, this formation needs to have the following characteristics: <br /> </p> <ul> <li paraeid="{a93e94ed-6fea-4c9f-a350-f7bc6677a4d1}{169}" paraid="1688653454">The “flagpole” is strongly bullish, with higher highs and higher lows; </li> <li paraeid="{a93e94ed-6fea-4c9f-a350-f7bc6677a4d1}{197}" paraid="2019845239">The “flag” is made up of candles with lower highs and lower lows that take place between two strictly parallel trend lines; </li> <li paraeid="{a93e94ed-6fea-4c9f-a350-f7bc6677a4d1}{216}" paraid="620551649">A breakout pierces the top line, resistance. </li> </ul> <h2 aria-level="2" paraeid="{a93e94ed-6fea-4c9f-a350-f7bc6677a4d1}{223}" paraid="266399962" role="heading">Bearish flag chart pattern structure </h2> <p paraeid="{a93e94ed-6fea-4c9f-a350-f7bc6677a4d1}{229}" paraid="1408549199">A bearish flag has exactly the same structure but upside down – a descending pole, an upward-facing flag and a breakout at the bottom. <br /> <br /> <img alt="Bear flag pattern" src="~/getmedia/4dc5c5f8-956f-48a4-b982-bbf7008cc76f/Bear-flag-pattern.png" /><br /> <br /> </p> <p paraeid="{64733bf8-a523-4804-8c65-248371739895}{3}" paraid="1799856450">Similar to a bullish flag, a bearish version needs to follow certain characteristics to be considered a valid chart pattern: <br /> </p> <ul> <li paraeid="{64733bf8-a523-4804-8c65-248371739895}{15}" paraid="1789624376">A strongly bearish pole with lower highs and lower lows; </li> <li paraeid="{64733bf8-a523-4804-8c65-248371739895}{22}" paraid="1336922437">A bullish series of candlesticks with higher highs and higher lows between two parallel trend lines; </li> <li paraeid="{64733bf8-a523-4804-8c65-248371739895}{38}" paraid="59528530">A breakout through support – the lower line, in the flag. </li> </ul> <h2 aria-level="2" paraeid="{64733bf8-a523-4804-8c65-248371739895}{60}" paraid="1886371726" role="heading">How do flag chart patterns work? </h2> <p paraeid="{64733bf8-a523-4804-8c65-248371739895}{66}" paraid="1274548335">Both bullish and bearish flags indicate that the prevailing power is strong to form a trend. At some point, the opposing power gains enough control to try and push the price in the opposite direction from the main trend. However, it is not strong enough to reverse the trend, so the price starts trading mostly sideways. This allows the dominant power to consolidate their efforts and push the price into a breakout, continuing the main trend. </p> <h2 aria-level="2" paraeid="{64733bf8-a523-4804-8c65-248371739895}{84}" paraid="86664609" role="heading">How to trade with Flag chart patterns </h2> <p paraeid="{64733bf8-a523-4804-8c65-248371739895}{90}" paraid="2133208689">Like with any other candlestick pattern, a rule of thumb is to wait for it to be completed and only then enter the market. </p> <h3 aria-level="3" paraeid="{64733bf8-a523-4804-8c65-248371739895}{110}" paraid="1221579474" role="heading">Trading with a bullish flag pattern </h3> <p paraeid="{64733bf8-a523-4804-8c65-248371739895}{116}" paraid="1452446115">As a bullish flag is a bullish continuation pattern appearing in an uptrend, it suggests opening a long trade once the breakout occurs.<br /> </p> <p paraeid="{64733bf8-a523-4804-8c65-248371739895}{128}" paraid="1353678010">The most common way of placing a position when trading with this pattern is to use the closing price of the breakout candle as an entry level. Stop loss can be placed at any point in the body, as any movement within it would invalidate the pattern and indicate that it’s better to exit the market. To determine a suitable take-profit level, traders commonly calculate the price change from the flagpole's base to its peak and then add this measurement to the breakout point.<br /> </p> <p paraeid="{64733bf8-a523-4804-8c65-248371739895}{166}" paraid="1990545706">Keep in mind that this scenario may be a better fit for risk-prone traders who choose to not wait for additional candles to close after the breakout, confirming the trend. If you decide to wait a little longer, the entry, stop-loss and take-profit levels may be different and need to be identified individually.<br /> </p> <p paraeid="{64733bf8-a523-4804-8c65-248371739895}{188}" paraid="1425264249">On the image below, you can see that there was a small pushback from bears, and the second candle after the breakout is bullish. However, the price shot higher right after it, validating the pattern’s suggestion. <br /> <br /> <img alt="An example of trading financial markets with a bullish Flag pattern" src="~/getmedia/f0a28f21-908e-49eb-b62d-49547334b7e5/An-example-of-trading-financial-markets-with-a-bullish-Flag-pattern.png" /><br /> <br /> </p> <h3 aria-level="3" paraeid="{64733bf8-a523-4804-8c65-248371739895}{217}" paraid="2059315071" role="heading">Trading with a bearish flag pattern </h3> <p paraeid="{64733bf8-a523-4804-8c65-248371739895}{223}" paraid="551449548">The appearance of a bearish flag in a downtrend suggests going short once the pattern is confirmed. Following the same logic, the closing price of a breakout candle can serve as an entry level.<br /> </p> <p paraeid="{64733bf8-a523-4804-8c65-248371739895}{229}" paraid="950932932">However, as you can see on the image below, a continuation of a trend indicated by a bearish flag can be short-lived. Shortly after the breakout, the price started moving sideways, eventually reversing into an uptrend. <br /> <br /> <img alt="An example of trading financial markets with a bearish Flag pattern" src="~/getmedia/cfe88a51-3394-4aa8-ba27-60e03aa3d933/An-example-of-trading-financial-markets-with-a-bearish-Flag-pattern.png" /><br /> <br /> </p> <p paraeid="{64733bf8-a523-4804-8c65-248371739895}{246}" paraid="379789178">To decrease the risk of false signals when trading with chart patterns, it is essential to gather additional insights from the price chart.<br /> </p> <p paraeid="{4b648553-9ecc-4fa5-8c8e-d32926d71f8e}{5}" paraid="151789271">In the example above, you can see that only three bearish candles formed once the breakout happened. The fourth candle was strongly bullish, forming a <a href="/trading-academy/forex/analysis/bullish-bearish-engulfing-patterns">bullish Engulfing pattern</a> and indicating a potential upcoming price reversal.<br /> </p> <p paraeid="{4b648553-9ecc-4fa5-8c8e-d32926d71f8e}{27}" paraid="732672989">Additionally, many traders use technical indicators to compare and confirm their findings, as chart patterns alone only indicate a potential outcome but do not guarantee them.<br /> </p> <p paraeid="{4b648553-9ecc-4fa5-8c8e-d32926d71f8e}{33}" paraid="954863878">Another safety measure traders should always take is trading with a risk-free <a href="https://portal.thinkmarkets.com/account/individual/demo" target="_blank">demo account</a> first to hone their skills before trading with real money. Create one now and practise trading with bullish and bearish Flag chart patterns. To learn more about chart patterns, check out our next article, where we explain how <a href="/trading-academy/forex/analysis/what-are-bullish-and-bearish-pennant-patterns">Pennant patterns</a> work. </p>
What is the Doji candle pattern?
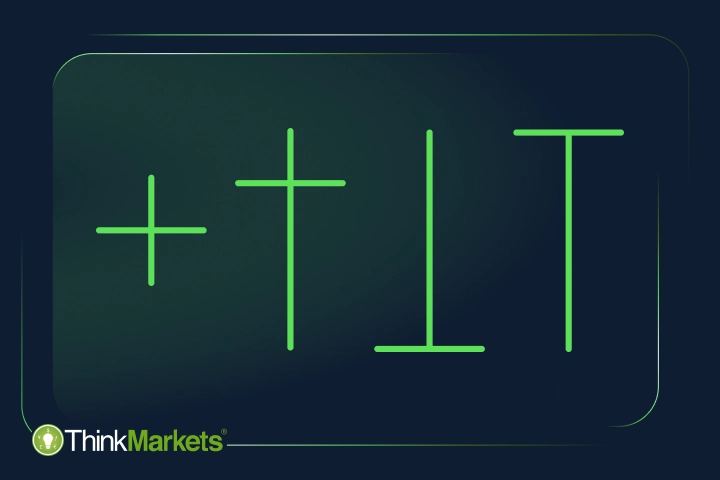
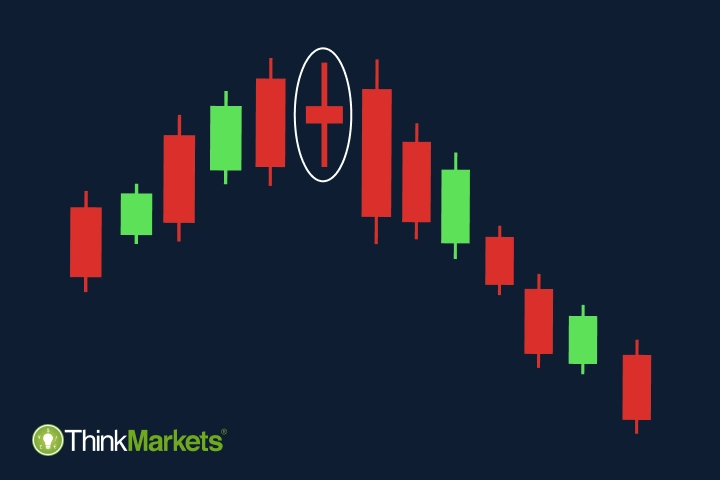
<p paraeid="{a93e94ed-6fea-4c9f-a350-f7bc6677a4d1}{52}" paraid="1878194966">A doji candlestick is a short-term pattern made of a single candle. Doji translates as “the same thing” from Japanese. It’s the perfect name for a candle that has its open and close prices at the same or almost the same level, making the body of a doji candle very small.<br /> <br /> The reason for this is the balanced power of bulls and bears, with neither being in control. Dominated by wicks, a doji candle often indicates indecision in the market.<br /> <br /> This type of candlestick can be classified as both a reversal and continuation pattern. The signal doji provides depends on the shape of a candle and its positioning within the trend.</p> <h2 paraeid="{a93e94ed-6fea-4c9f-a350-f7bc6677a4d1}{52}" paraid="1878194966">Types of doji candles</h2> Analysts distinguish five types of doji patterns:<br /> <ul> <li paraeid="{baba8067-8a56-43db-9e63-3cfb447b3ed4}{152}" paraid="2026840356">Doji Star (Neutral) </li> <li paraeid="{baba8067-8a56-43db-9e63-3cfb447b3ed4}{163}" paraid="1061156071">Four-price doji </li> <li paraeid="{baba8067-8a56-43db-9e63-3cfb447b3ed4}{174}" paraid="1506677825">Long-legged doji </li> <li paraeid="{baba8067-8a56-43db-9e63-3cfb447b3ed4}{183}" paraid="1347664177">Gravestone doji </li> <li paraeid="{baba8067-8a56-43db-9e63-3cfb447b3ed4}{190}" paraid="1797960963">Dragonfly doji </li> </ul> <h2>Doji star candlestick pattern (neutral doji)</h2> <img alt="Doji Star candle" src="~/getmedia/f06ed2c2-224a-4ec9-ad3d-d0b00f809296/Doji-Star-candle.png" /><br /> <br /> A doji star candle looks like a cross with a very short body in the middle and both wicks of similar length. This type of candlestick can occur at the end of the downtrend or in the closing stages of the uptrend. This may signal the trend weakening and a potential upcoming reversal. <h2>Four-price doji</h2> <img alt="Four-price Doji candle" src="~/getmedia/21738b3c-89de-4037-9d05-8750295aac1c/Four-price-Doji-candle.png" /><br /> <br /> The four-price doji is a very rare formation that looks like a horizontal line with high, low, opening and closing prices at the same, or nearly the same, level. This doji pattern signals very low volatility and high indecisiveness in the market. Similar to the neutral doji, the four-price doji may indicate the trend weakening. <h2>Long-legged doji candlestick pattern</h2> <img alt="Long-legged Doji candle" src="~/getmedia/540cf30b-9488-46c8-a9a6-bbe92e3e67bf/Long-legged-Doji-candle.png" /><br /> <br /> A long-legged foji, or a ‘rickshaw man’, is similar to a doji star but has longer wicks on either side. This type of candle also signals indecision as there is no clear indication about the future trend but with much higher volatility on the market.<br /> <br /> A long-legged doji candlestick formation can occur in both strong uptrends and downtrends, suggesting that the current trend may be in the closing stages, and a reversal may take place soon. <h2>Gravestone doji candlestick pattern</h2> <img alt="Gravestone Doji – a bearish reversal candlestick pattern" src="~/getmedia/e9104f26-7bfc-4b19-9cdb-0b66743c996a/Gravestone-Doji-%e2%80%93-a-bearish-reversal-candlestick-pattern.png" /><br /> <br /> A gravestone doji candle has a very long upper wick and a considerably shorter lower wick, with the candle’s body located close to the bottom.<br /> <br /> It is a bearish reversal pattern that often takes place at the end of the uptrend. The gravestone doji suggests that the bulls have pushed the price higher but could not force a close near the candle’s high price. As a result, the bears were able to return the price lower, bringing the open, close, and low prices to almost the same level, which may indicate the impending reversal of the price direction.<br /> <br /> On the other hand, when found in the downtrend, the gravestone doji may indicate its continuation. <h2>Dragonfly doji candlestick pattern</h2> <img alt="Dragonfly Doji – a bullish reversal candlestick chart pattern" src="~/getmedia/630b1b89-7ccc-4496-aa66-0af48ad588de/Dragonfly-Doji-%e2%80%93-a-bullish-reversal-candlestick-chart-pattern.png" /><br /> <br /> A dragonfly doji candlestick formation is the opposite of a gravestone doji.<br /> <br /> It’s a bullish signal with a very long lower wick, a much shorter upper wick, and the body located closer to the top. Thus, in a dragonfly doji candle, the open, high, and close prices are all very close to each other.<br /> <br /> This type of candle can occur in both uptrend and downtrend, but it is considered to be stronger when it takes place at the bottom of the downtrend and often suggests an upcoming price reversal.<br /> Found in the uptrend, a dragonfly doji may indicate its continuation. <h2>How to trade with the doji candlestick</h2> The doji candle alone is usually not strong enough to provide a definitive trading signal, so it is often used in combination with other technical analysis tools to support the findings.<br /> <br /> Support and resistance level are some of the most commonly used tools with a doji candle. For example, on the image below, you can see a gravestone doji that closed near the resistance level of the uptrend. It means that the higher price was rejected, and bears pushed the price to stay within the trend channel. Since bears had slightly more control over the market, they kept pushing the price down, causing the trend to change its direction.<br /> <br /> <img alt="Trading with a Doji candle and support and resistance levels" src="~/getmedia/9c17bd9d-3e86-49de-8426-f5a9874cf14e/Trading-with-a-Doji-candle-and-support-and-resistance-levels.png" /><br /> <br /> Another way to trade with a doji candle is to spot two consecutive doji candles, which usually means even greater indecisiveness on the market. When two candles appear one after another in a trend channel, it often results in a trend reversal. <br /> <br /> <img alt="Trading with a double Doji candle" src="~/getmedia/e1a02e93-7d33-4bdc-b100-5b9b7338f7cb/Trading-with-a-double-Doji-candle.png" /><br /> <br /> One more popular method of trading with a doji candle is to use it with the RSI oscillator. As you can see on the image below, doji candles appeared in the uptrend, signalling indecisiveness. At the same time, RSI suggests the instrument is overbought. These two factors resulted in the trend reversal. <br /> <br /> <img alt="Trading with a Doji candlestick and RSI indicator" src="~/getmedia/ad2dabe0-1248-4e82-af28-d691c091705e/Trading-with-a-Doji-candlestick-and-RSI-indicator.png" /><br /> <br /> These are just a few examples of potential positions with doji candles. Keep in mind that the appearance of these candlestick patterns does not guarantee trend reversal or continuation – it is merely an indication. That’s why using risk management tools is crucial to prevent unexpected losses should the market move in the opposite direction of your prediction.<br /> <br /> Create a demo account to practise trading with doji candles, stop loss and take profit. Ready for more technical analysis tools? Move to our next article, where we explain how the <a href="hammer-and-inverted-hammer-candlestick-patterns">hammer and inverted hammer chart patterns work</a>.
What are Hammer and Inverted Hammer candlestick patterns?
<p paraeid="{a93e94ed-6fea-4c9f-a350-f7bc6677a4d1}{52}" paraid="1878194966">The hammer and the inverted hammer candlestick patterns are among the most popular single-candle formations. They’ve been named as such because of their visual resemblance to a hammer – a short body on one end and a long wick on another.<br /> <br /> The hammers’ description may sound similar to a <a href="/trading-academy/forex/analysis/doji-candlestick-pattern">Doji candle</a>. However, while the body of a doji candle is so short that it looks like a horizontal line, both hammer and inverted hammer have slightly longer, visible bodies. Let’s see how they look. </p> <h2 paraeid="{a93e94ed-6fea-4c9f-a350-f7bc6677a4d1}{52}" paraid="1878194966">Hammer candlestick pattern</h2> In a hammer candle, the opening, closing and high prices are located near each other creating a body at the top, while a long wick extends lower. The wick is usually twice as big as the body.<br /> <br /> <img alt="Bearish and bullish Hammer candlestick pattern" src="~/getmedia/4d7f35dd-f359-4793-90df-61e310983c66/Bearish-and-bullish-Hammer-candlestick-pattern.png" /><br /> <br /> Irrespective of the colour of the body, both examples on the image above are hammers. The green candle is usually considered a stronger signal as the close occurs at the top of the candle, signalling strong momentum. <h2>Inverted hammer candlestick pattern</h2> An inverted hammer is exactly what the name itself suggests – a hammer turned upside down. A long upper shadow (wick), accompanied by the closing, opening and low prices are all registered near the same level at the bottom. Again, the upper wick should be twice as big as the body.<br /> <br /> <img alt="Bullish and bearish Inverted Hammer candlestick pattern" src="~/getmedia/d6575102-a644-49c1-b119-5e9d0d6b2389/Bullish-and-bearish-Inverted-Hammer-candlestick-pattern.png" /><br /> <br /> Like with a hammer, the green version of the inverted hammer is more bullish because of its higher close. <h2>How do hammer and inverted hammer candles work?</h2> As noted earlier, both of these patterns are considered to be powerful reversal patterns.<br /> <br /> At some point in a downtrend, the bulls increase their presence and push the price higher, causing a higher closing. That's when the hammer pattern occurs, signalling a potential trend, as the bears are unable to prevent a higher close.<br /> <br /> It is exactly the closing price at the top of a candle that signals that the bulls overpowered the bears and gained control over the market.<br /> <br /> The inverted hammer pattern also generates the same signal but in a different manner. This candle's opening and closing prices are at the bottom, indicating selling pressure and domination of bears. However, the long wick at the top of the candle means that bulls were powerful enough to push the price higher and suggests a potential reversal.<br /> <br /> The hammer candle, with its closing price at the top, is considered to provide a stronger bullish reversal pattern than the inverted hammer, with the closing price at the bottom. <h2>How to trade with a hammer and inverted hammer</h2> A trading strategy with hammer and inverted hammer candlesticks depends on a trader's risk appetite. As both candles are bullish signals, traders with a high risk appetite may open a position as soon as they see this pattern formed, anticipating trend reversal. In this case, the hammer's closing price often serves as an entry point, and its low price (the end of the wick) can suggest a stop loss.<br /> <br /> Risk-averse traders may wait for the other two-three candles to close for trend confirmation. In either scenario, most traders go long once they confirm a hammer or an inverted hammer.<br /> <br /> The image below shows an example of how the downtrend reversed and started moving upward right after the hammer appeared.<br /> <br /> <img alt="Hammer candle and trend reversal in a price chart" src="~/getmedia/2f428ae5-c105-4678-9b38-90ecb94aa8ba/Hammer-candle-and-trend-reversal-in-a-price-chart.png" /><br /> On the other hand, if you have a short position open in a downtrend, both hammer candles may be considered an exit signal before the trend reversal.<br /> <br /> It is important to note that just like any other candlestick pattern, neither hammer nor inverted hammer is a direct trading signal but a suggestion. There is always a possibility that the market will move in the opposite direction of your prediction.<br /> <br /> Many traders use additional technical analysis tools to confirm their findings and get more trading insights. For example, trendlines can confirm the price breakout, as illustrated on the image below.<br /> <br /> <img alt="Hammer candle and trendlines in a price chart" src="~/getmedia/bd60c4c1-e3f1-4f2e-9a16-9bb0f8de7a21/Hammer-candle-and-trendlines-in-a-price-chart.png" /><br /> <br /> Moreover, it can be helpful to determine horizontal support and resistance levels to place stop-loss and take-profit orders and update them as the market moves. Risk management tools are essential in every trading strategy.<br /> <br /> <img alt="Hammer candle and support and resistance in a price chart" src="~/getmedia/9c94caa6-fcb5-4b54-b07d-875738df6044/Hammer-candle-and-support-and-resistance-in-a-price-chart.png" /> <h2>Hammers vs shooting star vs hanging man</h2> Traders who are more familiar with candlesticks may notice that both hammer and inverted hammer look exactly like the hanging man and shooting star patterns. They are, indeed, very alike. The main difference is that both the hanging man and shooting star occur in an uptrend, while both hammers take place in a downtrend.<br /> <br /> <img alt="Hammer vs Inverted Hammer vs Hanging Man vs Shooting Star" src="~/getmedia/ac940462-55a2-4ce2-845a-4e21ab058a38/Hammer-vs-Inverted-Hammer-vs-Hanging-Man-vs-Shooting-Star.png" /><br /> In our next article, we'll explain how <a href="/trading-academy/forex/analysis/hanging-man-pattern">hanging man and shooting star candlestick patterns</a> work and how you can identify trading opportunities with their help.<br /> <br /> Meanwhile, create a risk-free demo account and practise finding Hammer and Inverted Hammer candles in a chart.
What is a Spinning Top candlestick pattern?
<p paraeid="{a93e94ed-6fea-4c9f-a350-f7bc6677a4d1}{52}" paraid="1878194966">A Spinning Top is another common candlestick pattern that indicates indecisiveness on the market. Similar to a <a href="/trading-academy/forex/analysis/doji-candlestick-pattern">Doji candle</a>, a Spinning Top is a single-candle formation that is considered a neutral pattern, although appearing at the end of a trend, many end in reversals.<br /> <br /> Due to its conflicting nature, a Spinning Top candle alone is not considered a strong trading signal. However, this pattern is much stronger in a trending market, whether uptrend or downtrend. When it takes place in a sideways trend, it can be seen as another signal that there is no clarity in the price action.</p> <h2 paraeid="{a93e94ed-6fea-4c9f-a350-f7bc6677a4d1}{52}" paraid="1878194966">Spinning Top candlestick structure</h2> A Spinning Top candle is formed by a short body in the middle and two long wicks on both sides of it. Ideally, these two wicks should be of similar length, and the difference between the opening and closing prices is very small.<br /> <br /> <img alt="Bullish and bearish Spinning Top candlestick chart patterns" src="~/getmedia/7260dcfb-14c9-4ef9-9b53-c04cb6f327d8/Bullish-and-bearish-Spinning-Top-candlestick-chart-patterns.png" /><br /> <br /> Because the Spinning Top is considered a neutral pattern, neither the bullish (green) nor bearish (red) version of it is particularly stronger than the other one. As with almost all candlestick patterns, the role of the next candle is important.<br /> <br /> A reversal may happen if the next candle after the Spinning Top opposes the current trend. On the other hand, a candle that goes in the same direction as a trend may signal its continuation. <h2>Doji vs Spinning Top candlestick patterns</h2> The shape of the Spinning Top candle is very similar to a Doji candlestick pattern. Both have wicks that extend higher and lower and are considered neutral patterns.<br /> <br /> <img alt="Doji candles vs Spinning Top candles" src="~/getmedia/421a31a0-fcf8-40f9-a836-306d541acecf/Doji-candles-vs-Spinning-Top-candles.png" /><br /> However, Doji candles have a shorter wick and no, or almost no body. Spinning tops have longer wicks extending to both sides, while the body is also longer, although still short. <h2>How does a Spinning Top candle work?</h2> A Spinning Top candlestick pattern forms when the price moves in one direction and then aggressively reverses in the opposite one. At the end of the candle's timeframe, both sides settle for a draw as the closing price appears near the opening price. This means neither bulls nor bears have the upper hand on the market. Both powers are strong enough to push the price higher and lower, but neither could force a close on their side. That’s why it is classified as a neutral pattern.<br /> <br /> At the same time, in a strong uptrend or downtrend, the Spinning Top shows that there is a new balance of forces, where the opposite side of the prevailing trend is gaining more control. This indicates that the short-term outcome is uncertain, and the trend may weaken. <h2>How to trade with a Spinning Top pattern</h2> Like with any other candlestick pattern, a trading strategy with a Spinning Top candle depends on traders’ risk appetite. Moreover, it is also important whether they open long-term or short-term positions.<br /> <br /> For example, the image below shows that the downtrend has reversed after the Spinning Top candle appeared. However, it didn’t happen right away. The first candle after the Spinning Top was strongly bearish, and many traders could have considered it a trend continuation signal.<br /> <br /> <img alt="Trading with a Spinning Top candle" src="~/getmedia/ba322613-3865-4999-bbd5-1a8525e4f279/Trading-with-a-Spinning-Top-candle.png" /><br /> Risk-tolerant bears had a chance to capitalise on the short-term downward price movement, but in the long term, the price went upward, although with a lot of volatility on its way. That’s why a Spinning Top is considered a suggestion and not a strong entry signal.<br /> <br /> Risk-averse traders usually wait for a trend confirmation before they open a position – three higher highs and higher lows for an uptrend and three lower highs and lower lows for a downtrend. As you can see, there was no strong uptrend confirmation either, as the second candle after the Spinning Top had a lower low than the first one, indicating market volatility and indecisiveness.<br /> <br /> In such cases, adding insights provided by other technical analysis tools can help traders decide on a trading opportunity.<br /> <br /> For example, the image below illustrates a Spinning Top candle used with trendlines to find a price breakout. Moreover, because a strong uptrend preceded it, this candle indicated a trend reversal.<br /> <br /> <img alt="Spinning Top candle with trendlines in a price chart" src="~/getmedia/812d4d52-085c-492f-9d03-0ca9bcae376f/Spinning-Top-candle-with-trendlines-in-a-price-chart.png" /><br /> <br /> If you are familiar with technical indicators, they may also be handy in clarifying market signals. However, keep in mind that no technical tool provides 100% accurate trading signals, and it is important to always use risk management tools to prevent bigger than expected losses.<br /> <br /> Using a demo account proves to be helpful as well when it comes to planning a trading strategy. Create one for free and practise finding candlestick patterns and opening positions in a risk-free market environment. If you want to know more patterns, head to our next article, where we explain how <a href="/trading-academy/forex/analysis/bullish-bearish-engulfing-patterns">Engulfing candles</a> work.
Three White Soldiers and Three Black Crows candlestick patterns
<p paraeid="{a93e94ed-6fea-4c9f-a350-f7bc6677a4d1}{52}" paraid="1878194966">The Three White Soldiers and Three Black Crows candlestick patterns are reversal patterns made of three candles, as their names suggest. Both formations indicate a potential change in the direction of a trend and are only valid when they appear after a strong uptrend or downtrend.</p> <h2 paraeid="{a93e94ed-6fea-4c9f-a350-f7bc6677a4d1}{52}" paraid="1878194966">Three White Soldiers pattern structure</h2> A Three White Soldiers is a bullish reversal pattern occurring in a strong downtrend and signals a potential upcoming change in price direction. The formation consists of three consecutive bullish candles, each opening and closing higher than the previous candle did.<br /> <br /> <img alt="A Three White Soldiers candlestick pattern" src="~/getmedia/88b2dfb8-8864-44ed-9dc0-96bd9c68d551/A-Three-White-Soldiers-candlestick-pattern.png" /><br /> All three candles may have short wicks or no wicks at all. Long wicks usually indicate that the opposing power – bears – remain strong, making the pattern less reliable. <h2>Three Black Crows pattern structure </h2> The opposite version of Three White Soldiers is called Three Black Crows. This is a bearish reversal formation, which occurs near the top of an uptrend. Like the bullish version, the Three Black Crows pattern consists of three consecutive bearish candles, preferably with long bodies. <br /> <br /> <img alt="A Three Black Crows candlestick pattern" src="~/getmedia/1d4b2a72-2aa2-4223-af17-bad129553cfb/A-Three-Black-Crows-candlestick-pattern.png" /><br /> The pattern follows the same logic as Three White Soldiers but in reverse – each candle has to open and close lower than the previous one and has no long wicks. <h2>How do Three White Soldiers and Three Black Crows patterns work?</h2> Belonging to the family of reversal patterns, the Three White Soldiers and Three Black Crows are considered powerful patterns. They occur in a strong trend when the opposing power gains more strength, pushing for a reversal.<br /> <br /> Besides indicating that the trend may change, both patterns serve as a trend confirmation themselves, as they are made of three candles in the same direction.<br /> <br /> While this is an advantage of these two patterns compared to the other reversal formations, the apparent weakness is that the three candles carry the price level far away from the recent low/high, making it more difficult to identify stop loss and take profit. <h2>How to trade with a Three White Soldiers candlestick pattern</h2> Trading with a Three White Soldiers pattern is very intuitive. All you need to do once you confirm that it’s been formed is open a position in the direction of a new trend.<br /> <br /> On the image below, you can see a price chart with a strong downtrend. At one point, bulls take control of the price and push it higher for three consecutive days, creating a strong reversal.<br /> <br /> <img alt="A trading example with a Three White Soldiers Pattern" src="~/getmedia/64c0d8d2-b1c4-4737-809a-274bbfb28103/A-trading-example-with-a-Three-White-Soldiers-Pattern.png" /><br /> To enter the market, most traders use the third candle’s closing price as a starting point. As we mentioned earlier, stop loss is quite hard to identify in this case. Risk-takers may set it at the lowest point of the first candle in the pattern, while less risky traders would choose a closer placement.<br /> <br /> Just like in any trade, higher risk often comes with higher gains but also with higher losses. On the other hand, less risky trades provide better protection from large losses but may limit trading opportunities as well. That's why it is important to assess your risk appetite before you start trading to not fall prey to your emotions.<br /> <br /> For take-profit orders, it is advisable to use support and resistance and identify the levels where the price has been stopped previously. This is why the pattern itself does not provide a take profit level. <h2>How to trade with a Three Black Crows candlestick pattern</h2> Trading with the Three Black Crows works exactly the same but in reverse. In the same chart earlier, we can see that the downtrend was created earlier by the three consecutive bearish candles.<br /> <br /> <img alt="A trading example with a Three Black Crows candlestick pattern" src="~/getmedia/3278e632-5a1d-4361-a5f9-df2603513e18/A-trading-example-with-a-Three-Black-Crows-candlestick-pattern.png" /><br /> <br /> Once this pattern was fully formed, traders had a chance to open a short position, taking the closing price at the openinging of the first candle. The take-profit level would need to be identified using something else than the pattern.<br /> <br /> You can notice that although this downtrend had a few upswings, the price never reached the opening price of the first candle's opening price. This means the swings didn't trigger the stop loss. However, if they missed the opportunity to lock their profit at the right time, it was erased by the Three White Soldiers that appeared at the end of this downtrend.<br /> <br /> As it is impossible to predict the movements of the markets with a 100% guarantee, experienced traders usually use a few additional technical analysis tools before they make a decision.<br /> <br /> On the other hand, beginners can identify the risk level they are comfortable with using a risk-free demo account. Sign up today to practise trading with chart patterns and build your trading strategy.<br /> <br /> If you’d like to know more about chart patterns, head to our next article, where we will explain how complex patterns with multiple candles, such as Flags, work.
What is the Marubozu candlestick pattern?
<h2 paraeid="{a93e94ed-6fea-4c9f-a350-f7bc6677a4d1}{52}" paraid="1878194966">Marubozu candlestick structure</h2> A Marubozu candle is very easy to spot because of its prominent structure. A candle consists of a long body created by a big gap between the opening and closing price and a very short wick on either side or no wicks at all. <br /> Depending on the presence and location of a wick, analysts define three types of Marubozu candles: <br /> <br /> <img alt="Marubozu candle patterns" src="~/getmedia/c3c4ac1e-313d-4c9d-99f8-06d7a5f36964/Marubozu-candle-patterns.png" /><br /> <br /> In all three cases, this candle has bullish and bearish versions. <br /> <br /> In general, for a pattern to be classified as a Marubozu candlestick formation, at least one of its wicks has to be missing. In the bullish Marubozu Full, for example, the opening price is the lowest level, and the closing price is the highest price of the candle. This means that the instrument’s price opens the session, starts rallying in a certain direction and closes at the exact end. Thus, open and close are at the same price as the high and low. <br /> <br /> As for the bullish Marubozu Open, the opening price is also the session low, indicating that buyers took control from the very start of the trading session. However, the closing price on the other side of the body can slightly differ from the high/low, leaving some room for a short wick. <br /> <br /> The Marubozu Close candle is the opposite version of the Marubozu Open. <h2>How does a Marubozu pattern work?</h2> Marubozu candle patterns send a powerful message – the market is moving in one direction. This applies to Marubozu Open and Close candles, too, despite their small wicks, as buying or selling pressure was so strong that it overwhelmed the other side of the market. <br /> <br /> In general, bearish Marubozu candles signal that the sellers are in full control as they dominated the session in the desired direction, and vice versa for the bullish Marubozu candles. <h2>How to trade with a Marubozu candlestick pattern</h2> The rule of thumb with Marubozu candles is to trade in the direction of a candle. It is generally considered a continuation pattern, but due to the length of its body, continuation implies following the direction of the candle itself, not necessarily the trend's direction. <h2>How to trade with a bullish Marubozu</h2> For example, in the price chart below, you can see a bullish Marubozu Open candlestick in action.<br /> <br /> <img alt="a bullish Marubozu" src="~/getmedia/ae326ae9-a8d9-48f8-8760-2fda6d6e4ed2/a-bullish-Marubozu.png" /><br /> <br /> After a downtrend, the price movements consolidated into trading sideways with short-term highs and lows. At one point, bulls took charge by pushing the price higher, creating a Marubozu Open candle. <br /> <br /> This means that bulls controlled the market from the candle’s opening price to the closing. Following such a strong bullish signal, the trend continued moving upward. <h2>How to trade with a bearish Marubozu</h2> On the second image, you can see the opposite scenario. A long bearish Marubozu candle was formed in an uptrend, leading to its reversal. The candle indicated that bears gained control, and the market started forming new lows and lower highs.<br /> <br /> <img alt="a bearish Marubozu" src="~/getmedia/f428c190-f8e8-41ff-996f-1cc110439790/a-bearish-Marubozu.png" /><br /> <br /> However, in both trading charts, you can see other Marubozu candles and where the market didn’t follow their directions. It happens because this pattern is not as precise as some other Japanese candlestick patterns. Moreover, it only confirms the fact that there is never a guaranteed outcome in the financial markets and all technical analysis tools provide only a suggestion. That’s why professional traders use several tools to combine their findings and make informed decisions.<br /> <br /> For example, support and resistance levels can be very helpful when you trade with a Marubozu candle. If a candle closes right before one of those levels, the price will likely bounce off and move in the opposite direction – away from the level. <br /> <br /> In some cases, a Marubozu candle opens at a support/resistance level, crosses it and closes on the other side. This means that bears/bulls were strong enough to break through an earlier established barrier and may indicate a stronger suggestion to trade in the direction of the candle.<br /> <br /> It is also very important to place a stop loss according to your risk appetite. Many traders have their stop loss at the candle’s opening or closing price depending on if trading the bullish or bearish pattern. Create a free demo account today and try finding Marubozu candles on the charts. Learn how you can use technical analysis and risk management tools in a risk-free trading environment with ThinkMarkets. To learn more about candlestick patterns, check out our next article, where we explain how <a href="/trading-academy/forex/analysis/tweezer-top-bottom-candlesticks">Tweezer candles</a> work.
.png?width=744&height=496&ext=.png)
How to trade bullish and bearish Engulfing candlestick patterns
Bullish and bearish Engulfing candlestick patterns, also called Outside bars, are powerful dual-candle formations. Found at the end of a downtrend or uptrend, these patterns often indicate a potential reversal. Engulfing patterns are also easy to spot, which adds to their popularity and makes trading with them very straightforward. <br /> <br /> The difference between this pattern's bullish and bearing versions depends on the candle order within it. <h2>Bullish Engulfing candlestick pattern</h2> A bullish Engulfing pattern occurs at the end of a downtrend and consists of two candles. The first candle is bearish (red) and has a relatively small body and short shadows, also known as wicks. The second candle, on the other hand, is bullish (green) and has longer wicks and a longer body that engulfs the body of the previous bearish candle. <br /> <br /> <img alt="Bullish Engulfing candlestick pattern (Outside Bar)" src="~/getmedia/4908dd05-65dd-4e63-8e2c-91688f3ef6cd/Bullish-Engulfing-candlestick-pattern-(Outside-Bar).png" /><br /> <br /> The body of the first candle doesn't necessarily need to be exactly in the middle as long as it's completely overwhelmed by the body of the second candle. For a candlestick pattern to qualify as bullish Engulfing, the high price of the second candle should be higher than the high price of the first candle. The same scenario applies to the low prices – the second candle must have a lower low price than the first one. <br /> <br /> If the closing price (top of the body) of the second candle is higher than the high price (top of the wick) of the first candle, the Engulfing pattern is considered a much stronger bullish reversal signal. The reason is that the second candle indicates that bulls gained control over the price. <h2>Bearish Engulfing candlestick pattern</h2> A bearish Engulfing pattern works exactly the same way. The only difference is that it is a bearish reversal pattern that occurs at the top of an uptrend, with a bullish (green) candle on the left and a bearish (red) one on the right. <br /> <br /> <img alt="Bearish Engulfing candlestick pattern" src="~/getmedia/b35bbf54-f9e5-4090-a3ae-155c631dcdb8/Bearish-Engulfing-candlestick-pattern.png" /> <h2>How do Engulfing patterns work?</h2> As we mentioned above, both patterns take place at the end of a strong trend. The first candle in both formations (either bullish or bearish) signals the continuation of a trend. On the other hand, the second candle (bearish or bullish, respectively) is powerful enough to completely shut down the first one and initiate a new trend. <br /> <br /> Engulfing candles in trading are very significant when conducting analysis, as traders usually aim to capitalise on new trends when markets change direction. Reversal patterns, such as bullish and bearish Engulfing patterns, signal an impending change in the price direction, as the so far dominant force has started losing momentum, which allows the other force to step in. <br /> However, as with other candlestick patterns, Engulfing formations have their own limitations. While they are quite powerful at the end of a strong trend, they are almost non-tradeable when they appear in a sideways market. <h2>Engulfing vs Harami candlestick patterns</h2> An Engulfing pattern has an opposite version – a Harami candlestick formation, also called an Inside Bar. Its structure is identical, but the candles within it swap places. The first candle is long, entirely overwhelming the second smaller candle. A Harami candle can also exist in two variations – bullish and bearish. <br /> <br /> <img alt="Bullish and bearish Harami candlestick pattern (Inside bars)" src="~/getmedia/418d3953-c8d9-46f8-b205-af678bcf1aeb/Bullish-and-bearish-Harami-candlestick-pattern-(Inside-bars).png" /><br /> <br /> However, in general, this pattern doesn't provide a strong signal. Once it occurs, it may indicate an upcoming reversal, but the price often starts trading sideways instead or continues following the trend. That's why this pattern is not particularly popular among traders. <h2>How to trade with Engulfing patterns</h2> A trading strategy with Engulfing patterns is pretty straightforward as they provide a powerful signal on their own. <h2>Trading with a bearish Engulfing pattern</h2> On the image below, you can see a series of highs and lows that created an uptrend. Following a new short-term high price (the first candle in the bearish Engulfing pattern), the price suddenly drops lower to create a strong, powerful bearish candle. <br /> <img alt="Trading with a bearish Engulfing pattern" src="~/getmedia/e13e4fd6-918a-47a1-8d3f-669a1d94f57e/Trading-with-a-bearish-Engulfing-pattern.png" /><br /> All elements are in place, and the bearish Engulfing pattern occurs. After that, the price still has both lows and highs but ultimately trades at lower levels. <br /> <br /> In this particular example, you can see the power of a bearish Engulfing pattern. The trend reversed after the second candle generated a signal that the bears had taken control of the price, and the downtrend may be finished. <br /> In such cases, traders tend to go short, using the second candle as an entry point and its high price as a stop loss. The take-profit level is derived using other technical indicators. <br /> <br /> For a more complete trading strategy, you may also use additional technical analysis tools, such as support and resistance or technical indicators. <br /> For example, if we zoom out of the previous price chart, we can see a potential placement of two support levels that may (and did, in this case) affect a newly formed trend. <br /> <br /> <img alt="A bearish Engulfing candlestick pattern with support lines in a price chart" src="~/getmedia/097e5469-ff87-4b8d-92c0-5528ed694c04/A-bearish-Engulfing-candlestick-pattern-with-support-lines-in-a-price-chart.png" /><br /> <br /> On the other hand, if you have a long position open in an uptrend, a bullish Engulfing candle pattern may serve as a signal to exit the market before it reverses. <h2>Trading with a bullish Engulfing pattern</h2> A strategy with a bullish Engulfing formation would work exactly the same, but you would go long following the same logic. With a short position in a downtrend, this pattern would also serve as an exit signal. <br /> <br /> For example, the image below shows a bullish Engulfing pattern in action – the downward reversed right after the formation occurred. <br /> <br /> <img alt="Trading with a bullish Engulfing pattern" src="~/getmedia/13a3792d-d4e9-4eed-9fe4-0bbbd24b7401/Trading-with-a-bullish-Engulfing-pattern.png" /><br /> <br /> Keep in mind that even the most accurate trading signals never guarantee that the market will move in the predicted direction. That's why experienced traders always have risk management tools, such as stop loss and take profit in place. <br /> <br /> Create a demo account to solidify your knowledge in a risk-free market environment. Alternatively, move to our next article, where we explain how <a href="/trading-academy/forex/analysis/marubozu-candlestick-pattern">Marubozu candles</a> work. <br />
Technical indicators: beginner’s guide
<p>Technical indicators are powerful tools that complement <a href="/trading-academy/forex/analysis/support-resistance">trendlines</a> and chart patterns in technical analysis. They provide traders with a comprehensive view of price movements and potential trading opportunities in financial markets.<br /> <br /> Despite their popularity and effectiveness, many novice traders feel hesitant to use indicators due to the perceived complexity associated with the term "technical". While it's true that learning about trading indicators requires effort, dedicating time to studying and practising with them is usually beneficial and can ultimately improve your trading strategy.<br /> <br /> In this article, we will help you grasp the concept of technical indicators, understand their functionality, and explore the main types based on their functionality.</p> <h2>What are technical indicators?</h2> <p>Technical indicators are pre-made mathematical calculations that analyse an instrument’s performance to help predict its future price movements.<br /> <br /> As you probably know by now, it’s impossible to forecast financial markets’ behaviour with 100% accuracy due to their fluid nature and dependence on unpredictable factors. However, technical indicators can help you identify some tendencies and make an informed trading prediction.</p> <h2>How do technical indicators work?</h2> <p>You can apply technical indicators on your trading platform in just a couple of clicks. Most trading platforms offer a wide array of indicators, and ThinkMarkets' proprietary platform, ThinkTrader, stands out with its selection of 120+ indicators:<br /> <br /> <img alt="Technical indicators" src="~/TMXWebsite/media/TMXWebsite/Technical-indicators.png" /><br /> <br /> Experienced traders often combine multiple indicators with chart patterns to gain deeper insights. However, as a beginner, it's crucial not to overload your charts with too many indicators, as it can create excessive noise and lead to conflicting signals.<br /> <br /> To start your journey with technical indicators, it's advisable to experiment with a few indicators within each group and determine which ones align with your trading style. Now, let's explore the main types of indicators that might suit your needs.</p> <h2>Types of technical indicators</h2> <p>It's worth noting that technical indicators can be categorised in various ways, and you may find the same indicator placed in different groups. This occurs because many indicators have overlapping functionalities, and the categorisation often relies on each trader's perception of the indicator's primary function.<br /> <br /> One common approach to differentiate indicators is by classifying them as either trend indicators or oscillators. While both types serve the purpose of identifying trend directions or reversals and providing buy or sell signals, they have distinct characteristics and applications. There are also other types as well below.<br /> <br /> <img alt="Types of technical indicators" src="~/TMXWebsite/media/TMXWebsite/Types-of-technical-indicators.png" /></p> <h2>Trend indicators</h2> <p>In our <a href="/trading-academy/forex/analysis/support-resistance">Trendlines in technical analysis</a>: support and resistance explained article, we discussed how to draw trendlines in a price chart to identify a trend direction or potential reversal.<br /> <br /> Trend indicators work the same way. Their primary function is to identify whether the price is going to move up, down or sideways. The difference is that indicators’ lines aren’t necessarily straight, as they analyse different data, providing some additional trading insights.<br /> <br /> Some of the most popular trend indicators are:<br /> </p> <ul> <li>Simple Moving Average indicator</li> <li>Average Directional Index (ADX/DMS) indicator</li> <li>Ichimoku Cloud indicator</li> <li>Parabolic SAR indicator</li> <li>Alligator indicator</li> </ul> <p> </p> <h2>Support and resistance indicators</h2> <p>Similar to trend indicators, support and resistance indicators resemble the functionality of support and resistance levels but automatically detect them in a price chart.<br /> <br /> Here are some of the most commonly used support and resistance indicators:<br /> </p> <ul> <li>Pivot points</li> <li>Fibonacci retracement levels</li> <li>Bill Williams Fractals indicator</li> </ul> <p> </p> <h2>Volatility indicators</h2> <p>Volatility indicators can help traders identify the periods of high and low volatility of an instrument. This insight is valuable for traders because high volatility usually comes with big price swings that bring a lot of trading opportunities but also an increased risk of losses. When traders know what volatility to expect, it allows them to adjust their trading strategy according to their risk appetite.<br /> <br /> Some of the most popular volatility indicators are:<br /> </p> <ul> <li>Bollinger Bands indicator</li> <li>Average True Range (ATR) indicator</li> </ul> <p> </p> <h2>Volume indicators</h2> <p>direction of a price movement depends on how much bullish (buying) or bearish (selling) power is present in the market. If bulls overpower bears, the price moves up. In the reverse scenario, when bears outnumber bulls, the price goes down. Volume indicators help measure bullish and bearish movements to understand whether they are strong enough for the price to continue moving in the same direction or weak enough to expect a reverse.<br /> <br /> Check out these popular volume indicators:<br /> </p> <ul> <li>On-Balance Volume (OBV) indicator</li> <li>Volume Weighted Average Price (VWAP) indicator</li> <li>Chaikin Money Flow indicator</li> <li>Money Flow Index (MFI) indicator</li> </ul> <p> </p> <h2>Oscillators (Momentum indicators)</h2> <p>The second group, oscillators, works slightly differently than overlays. An oscillator is an indicator that swings between two boundaries and suggests the overbought or oversold levels of an instrument, which may indicate a trend reversal.<br /> <br /> Oscillators are not applied directly over the price chart but are usually at the bottom of it. They are also called momentum indicators because they may indicate momentum or how fast the price is moving in a particular direction.<br /> <br /> Check out these popular volume indicators:<br /> </p> <ul> <li>On-Balance Volume (OBV) indicator</li> <li>Volume Weighted Average Price (VWAP) indicator</li> <li>Chaikin Money Flow indicator</li> <li>Money Flow Index (MFI) indicator</li> </ul> <br /> <img alt="Oscillators" src="~/TMXWebsite/media/TMXWebsite/Oscillators.png" /><br /> <br /> Here are some of the widely used oscillators:<br /> <ul> <li>Relative Vigor Index (RVI) indicator</li> <li>Moving Average Convergence Divergence (MACD)</li> <li>Momentum indicator</li> <li>Relative Strength Index (RSI)</li> <li>Force Index indicator</li> <li>Awesome Oscillator</li> </ul> <br /> <br /> The Bill Williams Awesome Oscillator is an oscillator that traders use to measure momentum in a Bill Williams Accelerator<br /> <ul> <li>Bill Williams Accelerator Oscillator</li> <li>Commodity Channel Index (CCI)</li> <li>DeMarker Indicator</li> <li>Gator Oscillator</li> <li>Stochastic Oscillator</li> <li>Williams Percent Range</li> </ul> <p> </p> <h2>How to choose a technical indicator</h2> <p>There are no good or bad indicators; they all provide different insights. The most important part of trading with indicators is to have a solid understanding of how they work and to be able to read the signals they provide.<br /> <br /> If you are a new trader, go through our list of indicators, study how they function and apply them using a demo account, comparing the findings. After some practice, you will have a better idea of which indicator fits your trading strategy.</p>
Ready to trade?
Ready to start your trading journey with ThinkMarkets? Apply for an account in just a matter of minutes.


