Dragonfly doji candlestick pattern
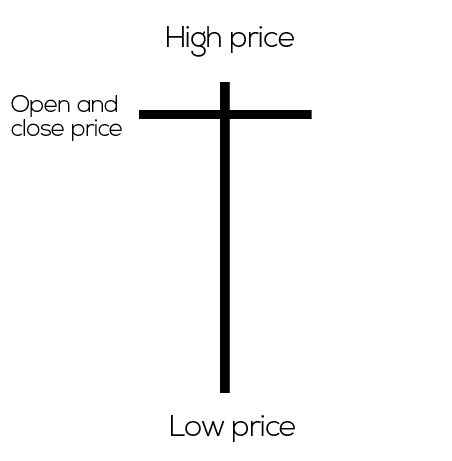
A dragonfly doji candlestick formation is the opposite of gravestone doji as the open, high, and close are near the same price in the upper half of the candle.
It can occur in both an uptrend and a downtrend, but it is considered to be stronger when it takes place at the bottom of the downtrend.
As you can see from the picture, a dragonfly doji looks very similar to a hanging man or a hammer candlestick pattern.
However, the same difference applies to the case of the gravestone doji and the shooting star, as doji has no body but only wicks, while the hanging man and hammer have a short body at the top of the candle.
Both patterns send the same message - the bears may lose the momentum soon and a reversal may be on the cards as the bears failed to force a close near the candle’s low.
You can check all types of doji candlesticks on
MetaTrader 4 or
5 and witness yourself how they impact the price action.
Any opinions, news, research, analyses, prices or other information contained on this website is provided as general market commentary and does not constitute investment advice. ThinkMarkets will not accept liability for any loss or damage including, without limitation, to any loss of profit which may arise directly or indirectly from use of or reliance on such information.