Types of Continuation Patterns
As outlined earlier, we divide continuation patterns into bullish and bearish formations. Many different types of chart patterns are considered to have a role in facilitating a continuation of the same trend, but these five patterns are widely accepted as the most effective continuation chart patterns.
Triangles
There are three types of the triangle pattern - ascending, descending, and symmetrical. The ascending triangle is a bullish formation that occurs in a mid-trend and signals an impending continuation of the existing trend. It consists of two converging trend lines, where the upper (resistance) trend line is flat, or nearly flat, while the lower trend line (support) is ascending. It signals that the price action is consolidating with the higher lows pushing for a breakout to the upside.
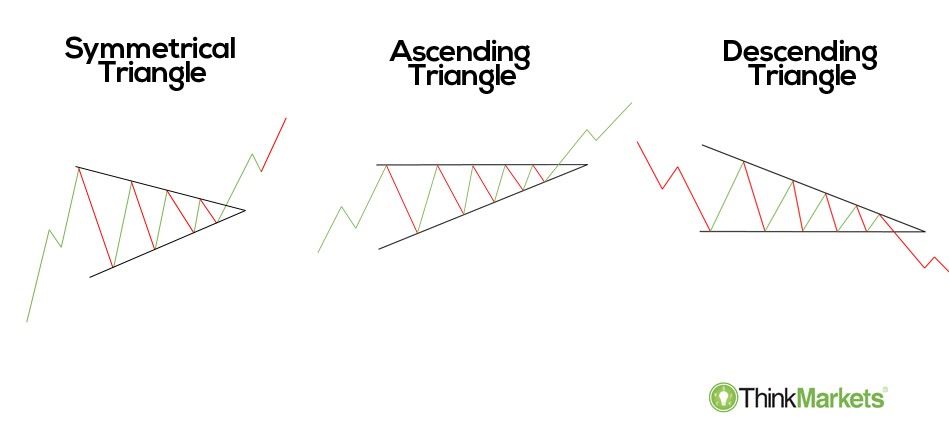
The descending triangle is a bearish formation that occurs in a mid-trend. It usually takes place in a downtrend, and it signals that the impending breakdown will continue the overall bearish trend. Unlike the ascending and descending triangles, which are continuation patterns, the outcome of the symmetrical triangle is difficult to predict, as the breakout can occur in both directions.
Rectangles
The rectangle pattern is similar to a triangle formation as the price action occurs in between two trend lines. However, unlike the triangle, these two trend lines are not converging, but rather trend in parallel. Hence, the consolidation takes place in a rectangle before the breakout takes place.
There are two types of rectangles - bullish and bearish rectangle patterns. The bullish version occurs in a mid-trend, while the price action trades within an overall uptrend. As such, the chances of a breakout are higher since the overall environment is bullish. The bearish rectangle forms within a downtrend as the sellers take a breather before pushing to break the rectangle to the downside. Both formations are classified as continuation patterns as they facilitate an extension of the prevailing trend.
Flags
This type of formation occurs after an explosive move upwards or downwards. The price action moves in a very steep manner - the flagpole - before the consolidation phase takes place. This phase occurs within two parallel lines, before the breakout in the direction of a prevailing trend.
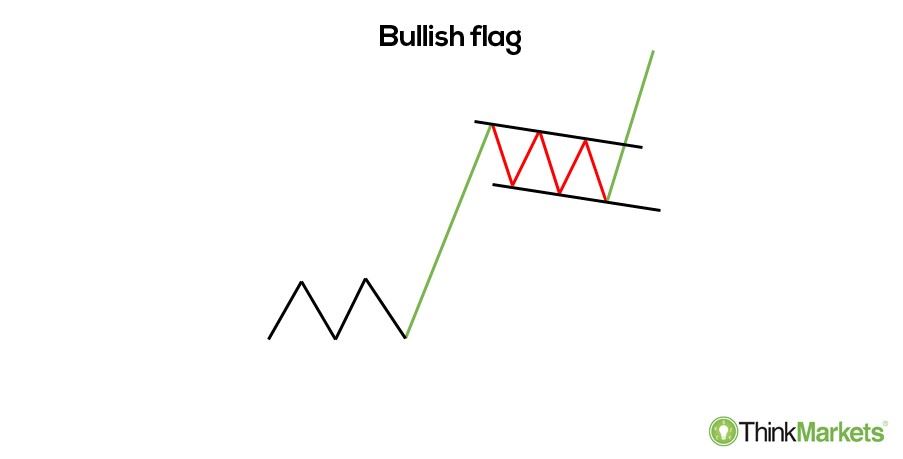
The bullish flag occurs during an uptrend. After an initial bullish move, the price action consolidates within the two parallel lines before breaking out higher.
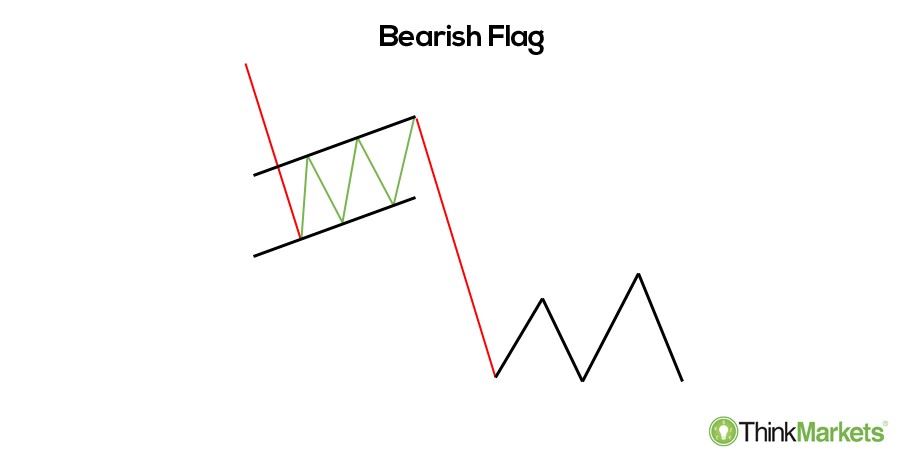
The bear flag facilitates the extension of a downtrend. After a brief consolidation period in a slight uptrend, the sellers re-assume control with a breakdown of the flag.
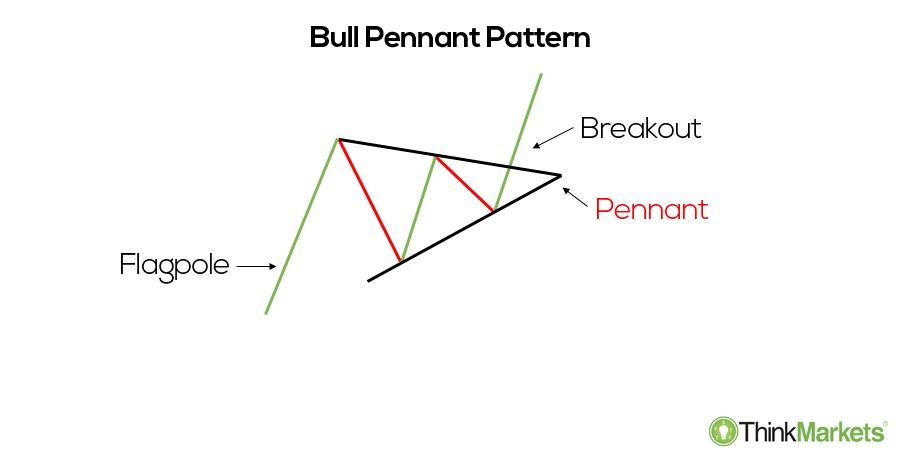
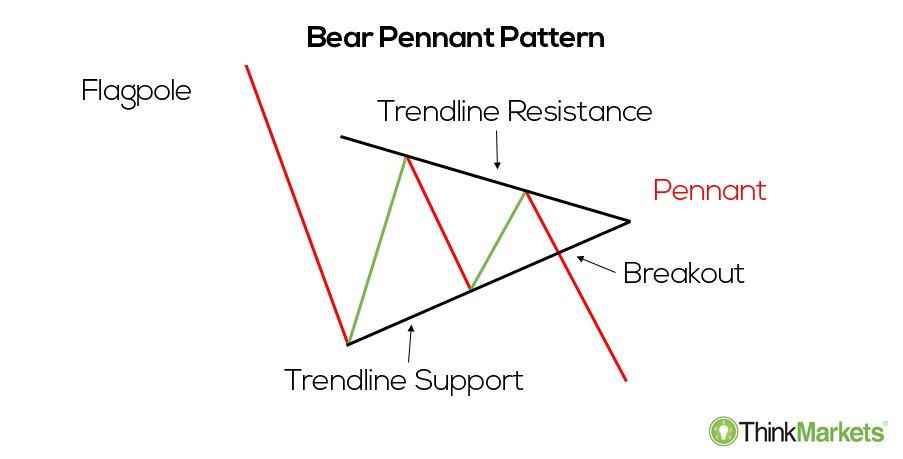
Pennants
This continuation pattern is very similar to the flag. Both start with a strong, explosive move up or down. Unlike the flag where the price action consolidates within the two parallel lines, the pennant is a triangular pattern that helps the price action to consolidate. It looks like a triangle, although the symmetrical triangles are larger and take more time to develop.
The bearish pennant is a continuation pattern that helps extend the downtrend.
The bullish pennant occurs in an uptrend. After the consolidation phase, the buyers are able to push the price action higher to extend the prevailing bullish trend.