Please note ThinkMarkets does not provide CFD services to residents of the US.

Please note ThinkMarkets does not provide CFD services to residents of the US.

Learn To Trade
 
Indicators & Chart Patterns

Deepen your knowledge of technical analysis indicators and hone your skills as a trader.

Find your detailed guides here
Trading Glossary

From beginners to experts, all traders need to know a wide range of technical terms. Let us be your guide.

Learn more
Knowledge Base

No matter your experience level, download our free trading guides and develop your skills.

Learn more
Learn To Trade

Trade smarter: boost your skills with our training resources.

Create a live account
Market Analysis
 
Market News

All the latest market news, with regular insights and analysis from our in-house experts

Learn more
Economic Calendar

Make sure you are ahead of every market move with our constantly updated economic calendar.

Learn more
Technical Analysis

Harness past market data to forecast price direction and anticipate market moves.

Learn more
Live Webinars

Boost your knowledge with our live, interactive webinars delivered by industry experts.

Register now
Special Reports

Engaging, in-depth macroeconomic analysis and expert educational content from our in-house analysts

Learn more
Market Analysis

Harness the market intelligence you need to build your trading strategies.

Create a live account
Partnership
 
Affiliate Programme

Grow your business and get rewarded. Find out more about our Affiliate Programme today.

Learn more
Introducing Broker

ThinkMarkets ensures high levels of client satisfaction with high client retention and conversion rates.

Learn more
Proprietary Trading

Partner with us to build your own prop trading business. Enquire with our account managers today.

Learn more
White Label

We supply everything you need to create your own brand in the Forex industry.

Learn more
Regional Representatives

Partner with ThinkMarkets today to access full consulting services, promotional materials and your own budgets.

Learn more
Refer a friend

Receive $50 for you and your friend when you convert them into an active trader of ThinkMarkets.

Learn more
Partnership

Plug into the next-gen platforms and the trades your clients want.

Partner Portal
About ThinkMarkets
 
Sponsorships

Check out our sponsorships with global institutions and athletes, built on shared values of excellence.

Learn more
About Us

Find out more about ThinkMarkets, an established, multi-award winning global broker you can trust.

Learn more
Careers

Discover a range of rewarding career possibilities across the globe

Apply now
ThinkMarkets News

Keep up to date with our latest company news and announcements

Learn more
Trading Infrastructure

When it comes to the speed we execute your trades, no expense is spared. Find out more.

Learn more
Contact Us

Our multilingual support team is here for you 24/7.

Learn more
About ThinkMarkets

Global presence, local expertise - find out what sets us apart.

Create a live account
Log in Create account

Everything About the Bear Flag Candlestick Pattern

The bearish flag is a candlestick chart pattern that signals the extension of the downtrend once the temporary pause is finished. As a continuation pattern, the bear flag helps sellers to push the price action further lower. 

After a strong downtrend, the price action consolidates within the two parallel trend lines in the opposite direction of the downtrend. Once the supporting trend line gets broken, the bear flag pattern is activated as the price action continues trading lower. 

In this blog post we look at what a bear flag is, its structure, as well as its main strengths and weaknesses. Furthermore, we will also share a simple trading strategy to show how to trade a bear flag and make profit.

What the Bear Flag Tells Us

As it’s the case with a bull flag, its bearish counterpart consists of the flagpole and a flag. The former is constituted after the price action trades in a downtrend, making the lower highs and lower lows. 

Once the new low is in place, the price action starts to rebound higher as the sellers take a breather. This consolidation takes place within a parallel channel, unlike in the bearish pennant where the consolidation is formatted in a wedge or a triangle. 

The buyers use the consolidation to try and weaken the momentum of the sellers, who are in control of the price action. On the other hand, the bears take a step back to consolidate the most recent gains and prepare for another push lower. 


Bearish flag - an illustration


This consolidation phase shouldn’t extend too high. Depending on the strength of a downtrend, the rebound may be sharper or milder. In general, the rebound shouldn’t extend above the 50% Fibonacci retracement of the flagpole. 

In a textbook example, a pullback should end at around 38.2% Fibonacci retracement. The shorter the rebound, the stronger the downtrend is, and the stronger the breakout is expected to be.

These three elements are integral for the bearish flag to occur:

  • The flagpole - the asset’s price must trade lower in a series of the higher highs and higher lows;

  • Flag - a consolidation must take place between two parallel trend lines in an uptrend;

  • A breakout - a break of the supporting trend line signals the activation of the pattern.

Strengths and Weaknesses

As said earlier, the bear flag is a continuation pattern that facilitates the extension lower. As a chart pattern itself, the bear flag makes sure that traders are able to identify the stage which the downtrend is currently in. 

More precisely, the flag will tell us whether the consolidation phase is over as the sellers increase their pressure. The breakout provides us with precisely defined levels to play with, as you will see in the example below.

In general, the bear flag is considered to be a strong technical pattern. This is especially the case when the retracement ends at around 38.2%, creating a textbook bear flag pattern. Therefore, its greatest advantage is that it offers a very attractiverisk-reward ratio, as levels are clearly defined.

The apparent weakness is that the consolidation phase may result in a change of the trend direction. Sellers may lose momentum as the consolidation drags on, while the buyers may grow in confidence that this current phase is not a consolidation, but rather a reversal. 

Therefore, it's advised not to trade flags that have long and choppy consolidation phases, as well as those that extend higher than 50%.

Spotting the Bear Flag Chart Pattern

As mentioned earlier, the bear flag is a bearish continuation pattern. The first step in identifying the bear flag is to look for a downtrend. Next, the rebound should take place within an ascending channel, while we monitor the degree of the correction. 


EUR/USD has been moving lower in an aggressive downtrend before a mild rebound started, which was short-lived given the overall strength of the initial move lower. Still, the price action consolidated within the two parallel lines before the bears had retaken control.


SpSpotting the bear flag - EUR/USD H1 char


In this case, the rebound didn’t even manage to extend to the first Fibonacci retracement level of 23.6% before the sellers were successful in pushing the action lower. Hence, the overall downtrend usually dictates the power and pace of a rebound. 

Trading the Bear Flag Pattern

The process of trading the bearish flag is based on the same principles we apply when we trade other candlestick patterns. Once we spot the flag, we move to a wait-and-see regime to see whether a break of the supporting trend line will occur.

Many traders are too eager to enter the market and frequently “jump the gun” before the actual breakout has even occurred. Hence, do remember the pattern goes “live” only when the breakout takes place. 

In our example, we are presented with both standard entry options after the breakout occurs. The first option results in the opening of a trade as soon as the breakout candle closes below the flag

On the other hand, we may eventually opt to wait for a throwback, when the price action returns to the “crime scene” to retest the broken channel. This option offers a better risk-reward since the entry is at a higher price. Contrarily, the first option means you can’t miss out on a trade as there are no guarantees that a throwback may take place at all.


Trading the bear flag - EUR/USD H1 chart


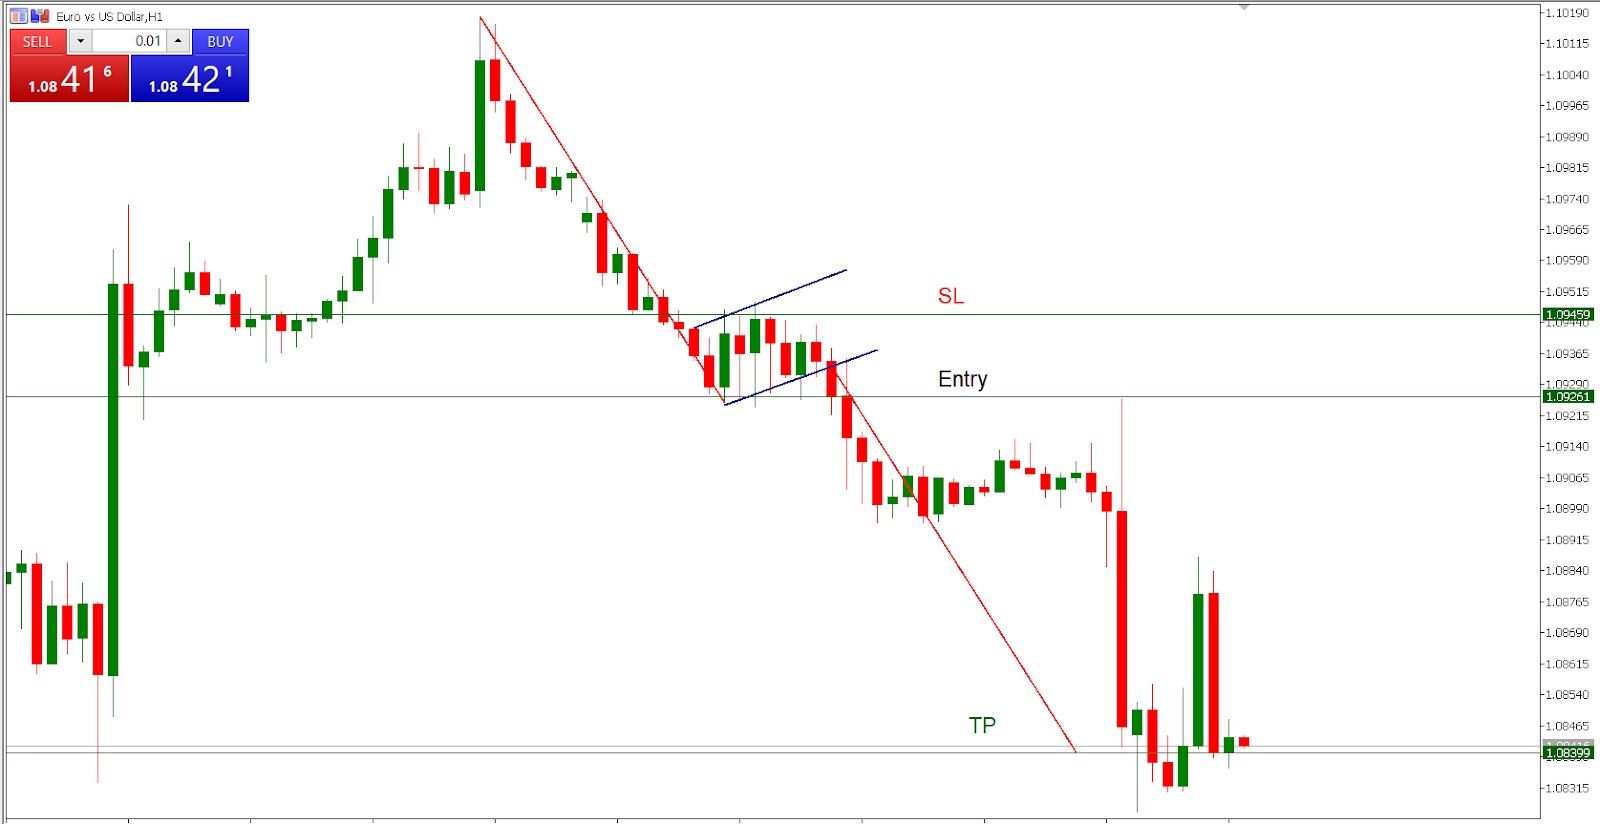
Just to make sure that we are in a trade, we choose option no.1. Hence, a sell trade is entered after the breakout candle closed comfortably below the lower trend line. The stop loss is around 20 pips higher from the entry and within the channel territory. As with the bull flag, a clean move to the inside of the flag invalidates the bear flag pattern. 

The take profit level is calculated by measuring the distance of the flagpole. The trend line is then copy-pasted, starting from the point where the breakout occurred, with the ending point signalling a level where we should consider booking our profits, if the opportunity arises. 

Ultimately, our take-profit order is hit, which results in gains of around 85 pips. Once compared with the associated risk of 20 pips, this makes for a very attractive R:R ratio. In case we opted for the second option, we would have gained 5 pips more and risked the same number of pips less.

Any opinions, news, research, analyses, prices or other information contained on this website is provided as general market commentary and does not constitute investment advice. ThinkMarkets will not accept liability for any loss or damage including, without limitation, to any loss of profit which may arise directly or indirectly from use of or reliance on such information.
Back to top