Please note ThinkMarkets does not provide CFD services to residents of the US.

Please note ThinkMarkets does not provide CFD services to residents of the US.

Learn To Trade
 
Indicators & Chart Patterns

Deepen your knowledge of technical analysis indicators and hone your skills as a trader.

Find your detailed guides here
Trading Glossary

From beginners to experts, all traders need to know a wide range of technical terms. Let us be your guide.

Learn more
Knowledge Base

No matter your experience level, download our free trading guides and develop your skills.

Learn more
Learn To Trade

Trade smarter: boost your skills with our training resources.

Create a live account
Market Analysis
 
Market News

All the latest market news, with regular insights and analysis from our in-house experts

Learn more
Economic Calendar

Make sure you are ahead of every market move with our constantly updated economic calendar.

Learn more
Technical Analysis

Harness past market data to forecast price direction and anticipate market moves.

Learn more
Live Webinars

Boost your knowledge with our live, interactive webinars delivered by industry experts.

Register now
Special Reports

Engaging, in-depth macroeconomic analysis and expert educational content from our in-house analysts

Learn more
Market Analysis

Harness the market intelligence you need to build your trading strategies.

Create a live account
Partnership
 
Affiliate Programme

Grow your business and get rewarded. Find out more about our Affiliate Programme today.

Learn more
Introducing Broker

ThinkMarkets ensures high levels of client satisfaction with high client retention and conversion rates.

Learn more
Proprietary Trading

Partner with us to build your own prop trading business. Enquire with our account managers today.

Learn more
White Label

We supply everything you need to create your own brand in the Forex industry.

Learn more
Regional Representatives

Partner with ThinkMarkets today to access full consulting services, promotional materials and your own budgets.

Learn more
Refer a friend

Receive $50 for you and your friend when you convert them into an active trader of ThinkMarkets.

Learn more
Partnership

Plug into the next-gen platforms and the trades your clients want.

Partner Portal
About ThinkMarkets
 
Sponsorships

Check out our sponsorships with global institutions and athletes, built on shared values of excellence.

Learn more
About Us

Find out more about ThinkMarkets, an established, multi-award winning global broker you can trust.

Learn more
Careers

Discover a range of rewarding career possibilities across the globe

Apply now
ThinkMarkets News

Keep up to date with our latest company news and announcements

Learn more
Trading Infrastructure

When it comes to the speed we execute your trades, no expense is spared. Find out more.

Learn more
Contact Us

Our multilingual support team is here for you 24/7.

Learn more
About ThinkMarkets

Global presence, local expertise - find out what sets us apart.

Create a live account
Log in Create account

How do Heikin Ashi candles work?

Heikin Ashi is a Japanese term that means “average bar”.

Heikin Ashi candles are a modified way of displaying data on your candlestick chart, most notably the ability to smooth out volatility of a currency pair - allowing you to build more sophisticated trading strategies.

A typical candlestick chart will both show the overall trend and how volatile the markets were in a particular candlestick itself.

Heikin Ashi smooths out the price action on a chart by displaying values using averages to create something that does look very similar to the candlestick, but without a lot of noise.

The main purpose of using the Heikin Ashi indicator is to see past the choppiness and volatility that is so common in the markets. The Heikin Ashi candles will apply a mathematical formula in order to give a clear picture of whether or not the market is in a bullish or bearish trend.
How Heikin Ashi is calculated While the traditional bar or candlestick chart plots the open, close, high, and low of a time period, the Heikin Ashi calculates these values slightly differently.

The Heikin Ashi formula used to come up with the average values on each candle is:
  • Open of candle: (open of previous bar + close of previous bar) / 2
  • Close of candle: (open + high + low + close) / 4
  • High of candle: the maximum value from the high, open, or even close of the current period
  • Low of candle: the lowest value from the low, open, or close of the current period

As you can see, this is quite different from just plotting the values as usual. This helps slow down the churn and keeps the same trend visualized for longer.

While the indicator is slow to change, it does help keep the trade going longer when on the correct side of it.

heikin ashi 1
 
Practise trading with $25,000 virtual funds
Using Heikin Ashi As with a conventional candlestick chart, you can use the Heikin Ashi on any timeframe.

While they can come in any color, the standard version with the MetaTrader 4 platform uses red for a bear candlestick, while it will use white for a bull candlestick.

In order to use Heikin Ashi candles on the MetaTrader 4 platform, you go to the pulldown 'insert' menu, click on the 'indicators'' submenu, followed by the 'custom' submenu, and choose 'Heikin Ashi'.

One advantage of the Heikin Ashi indicator is that in a downtrend, candles tend to stay red, while in an uptrend they tend to stay white. Normal candlesticks will sometimes alternate color, even if it is against the overall trend.

You may have a couple of random hourly candlesticks that are slightly bullish in an overall bearish trend. This can make the look of the trend a little noisier than what is either useful or necessary.

There are five main signals that identify trends using Heikin Ashi:
  • White candles with no lower “wicks” indicate a strong uptrend.
  • White candles in general signify an uptrend.
  • Candles with a small body surrounded by both an upper and lower wick suggest that a potential trend change may be presenting itself. (Also known as a “doji”.)
  • Red candles indicate a downtrend.
  • Red candles with no higher shadows indicate a strong downtrend.

heikin ashi 2


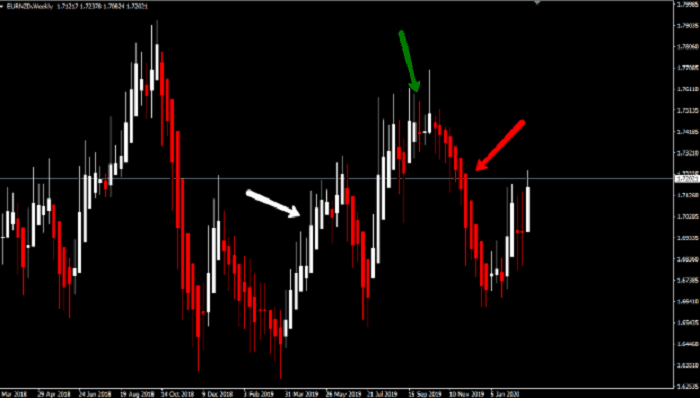
Notice on the chart above that where the white arrow highlights, there are multiple white candlesticks in a row that had no wick on the bottom. This shows that there was in fact a significant uptrend in effect.

Also, notice how there were a couple of candlesticks that had long wicks on both sides highlighted by the green arrow, showing a potential trend change.

Finally, notice that the red arrow points out several red candlesticks in a row that have no upper shadow, showing a very strong downtrend, and change in attitude.

Note that when there are several long wicks in a row on one side of the candle, it can present that there is a significant amount of pressure building in the marketplace. For example, when you see several red candles with long wicks on the bottom, that shows that buying pressure is starting to build.

Ultimately, if you see several white candlesticks in a row that have long wicks to the upside, it also can suggest that selling pressure is starting to make its presence known. The wick suggests that the market was moving in a direction, but in the case of the downtrend found buyers that managed to push back up, and of course vice versa for an uptrend.

Most traders will use Heikin Ashi candlesticks to keep themselves in a trade much longer once a trade begins, choosing not to change their position or close out until the candlestick changes color. For example, if there are four red candlesticks and suddenly a white candlestick appears, then a trader who is short of the market may close out their position, or even possibly go long at that point.

Remember, the candles are meant to change slowly, so the fact that they do suggests something important could be afoot.

However, for those that are more aggressive, the fact that a candle has wicks on both sides of it, or form a doji, will kick off a potential trade in the other direction. It is a matter of personal preference, but it should be tested in a demo environment if you wish to try it out. This is true not only with Heikin Ashi, but any indicator or strategy.

Join thousands of traders who choose a mobile-first broker.
Some things to keep in mind with Heikin Ashi systems

Because the candles tend to leave behind smaller corrections and consolidations, this means that when the direction changes on a Heikin Ashi graph, its likely a larger trend change. The ability to filter out the noise of a trend has a major effect on how you can exit a trade.

For example, the chart below shows an uptrend that eventually formed a couple of long wicks at the top. After those candles, the next three were red, while the second and third had no wick whatsoever on the top.

This shows that the color change quickly identified the change in trend as the market dropped from there.


heikin ashi 3


The more candles you see without a wick going against the trend, the more likely the trend is to continue.

If you see a large majority of bullish candles without a lower wick, this shows just how much bullish momentum there is in the market.

This allows you to be more confident in the trend, and therefore hang onto a profitable trade, the very essence of what makes a profitable trader. Obviously, the same thing applies to a downtrend that features multiple red candles without a wick on the top. Looking at the chart below, the uptrend that is marked by the white arrow shows multiple white candles without any lower shadows.

In fact, when the market does start to show wicks on the bottom of the candles, there is a red one, and then another few smaller white candles. This was the last gasp of the uptrend, before rolling over. The lack of range on the last few candles, as well as lower wicks, showed things were changing.

The Heikin Ashi candles allow trading of patterns and candle shapes like any other type of charting. However, one particular candlestick that seems to carry more weight than in other forms is the doji.

The doji candlestick is when the market opens and closes at the same (or at least close to) price. This is particularly interesting and telling on a Heikin Ashi chart when it appears at the top or bottom of a trend. This is because the averaging formula will take into account what has been going on, and if the candles start to slow down, this clearly means that the momentum is dropping.

Take a look at the uptrend in the CHF/JPY 4 hour chart below.

The blue rectangle shows where the market runs out of steam, as there are multiple dojis. Notice that the next candle with any length to it at all is a red one, showing that the momentum is rolling over. Shortly afterwards, the market started a downtrend. This is quite common with the Heikin Ashi indicator, as it takes out so much noise.


heikin ashi 4


It should also be noted that the very nature of the candles seem to form a lot of flags. The same chart from the previous example, zoomed out a bit, formed a couple of flags as marked on the chart.

This is a perfect example of how the Heikin Ashi indicator lays out the trend. The shape of the flag shows that there is a pullback after initially surging to the upside. You can see that the trend accelerated at this point and went much higher.

Let’s think about this: The smoothing mechanism of the Heikin Ashi system shows the nature and average of the trend, not all of the noise that may not have made it clear that a flag was setting up.

This allows the trader to look at the trend and ignore the individual noisy moves. It is a great way to see the overall move, and not get caught up in the minutiae, making it easy to trail right along with the trend, if and when it forms.

Start trading GER30 from as low as 0.4 pips with ThinkTrader
A review of the benefits of Heikin Ashi
  • Heikin Ashi features a smoothing mechanism that takes the average of the recent move, not just the simple high, low, open, and close. This means that you get a better overall “feel” of the trend, or even if there is one.
 
  • The candles will show whether there is real momentum based upon whether or not there are wicks on the candle. If the market is in an uptrend and there are no wicks on the bottom of the candle, this allows the trader to stay with the momentum, trailing a stop loss. This also works in the opposite direction as well.
 
  • Patterns and specific candlesticks can be signals as well, just like any other charting system. For example, flags are just as valid with Heikin Ashi as they are on bar charts or candlestick charts. Furthermore, one of the most potent signals while using Heikin Ashi candles is the common doji, because the Heikin Ashi indicator smooths out the overall momentum, and a flat close like that can show a trend ending. In other words, it takes much more to form a doji in a trend using these candles than typical ones.
 
  • Heikin Ashi is built into MetaTrader 4, and many other platforms that are available.
Any opinions, news, research, analyses, prices or other information contained on this website is provided as general market commentary and does not constitute investment advice. ThinkMarkets will not accept liability for any loss or damage including, without limitation, to any loss of profit which may arise directly or indirectly from use of or reliance on such information.
Back to top