How to trade with Ichimoku Clouds
Let's break down the trading with the Ichimoku indicator in simple steps. For this, we'll look at the USD/JPY hourly chart.
As seen below, there are two situations we want to explain here. In the first situation, Tenkan drops below Kijun and provides us with a trading signal that the price action may change its course and form the uptrend shift to a downtrend.
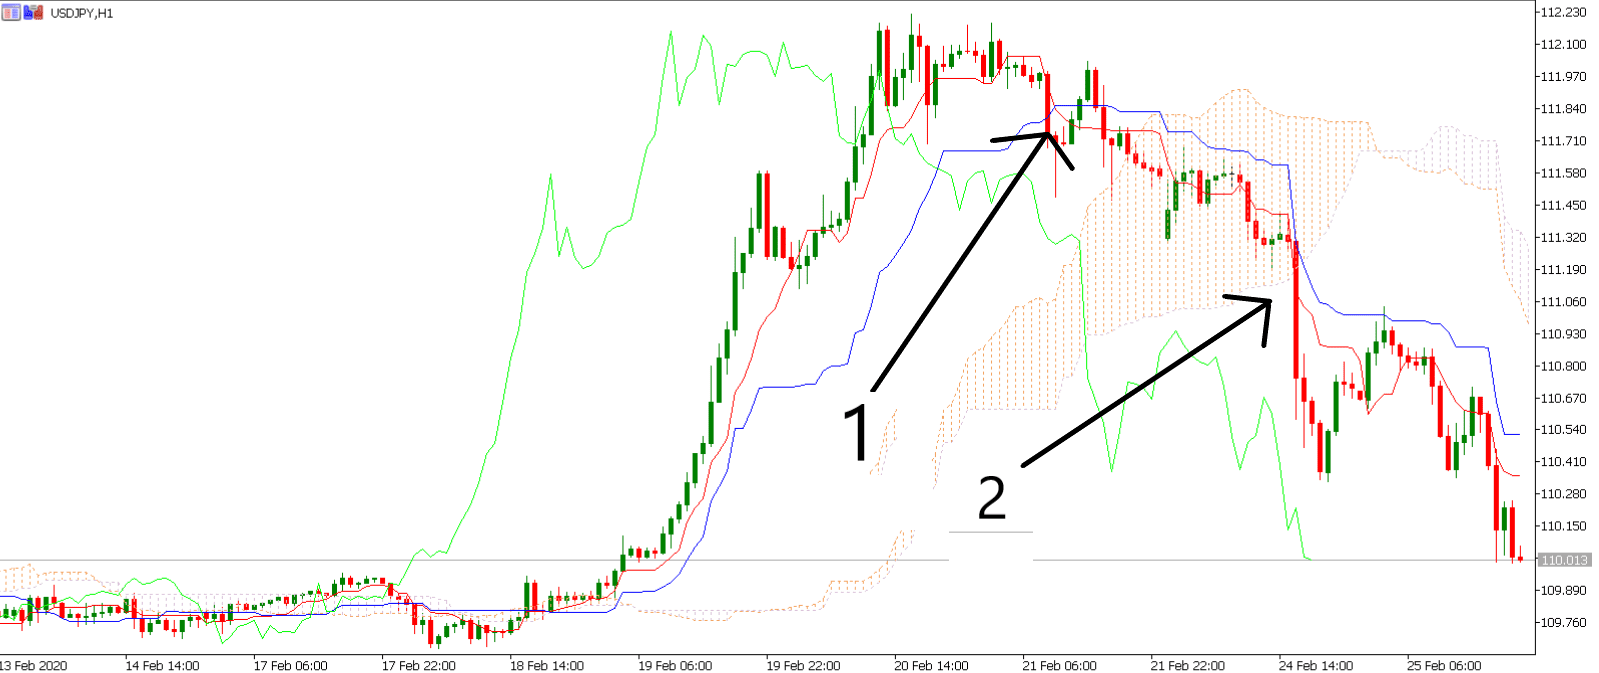
However, at this point both the cloud and Chikou Span are trading below the price action, meaning that the trading signal generated by the relationship between Tenkan and Kijun is not confirmed.
The situation marked by number #2 is different. For some time now, the price action has been moving lower. At one point, USD/JPY breaks under the cloud as the red line still trades below the blue line.
Finally, Chikou is trading below the market’s price, which means that finally all three elements are providing the same bearish signal.
Of course, for the bullish signal you should just apply the reverse logic. You want to enter a long trade if the blue line trades above red, the price action is above the cloud and above Chikou Span.
You are now in a trade and there are two more decisions to be made. One, the stop-loss should be placed above the high of the candle within the cloud formation. Ideally, you should also consult other support and resistance levels before deciding on a stop-loss.
The same applies for a take profit order, which should be set based on the money management principles and risk tolerance. Again, always consult other indicators and technical levels of support and resistance.