
Articles (61)
What is forex?
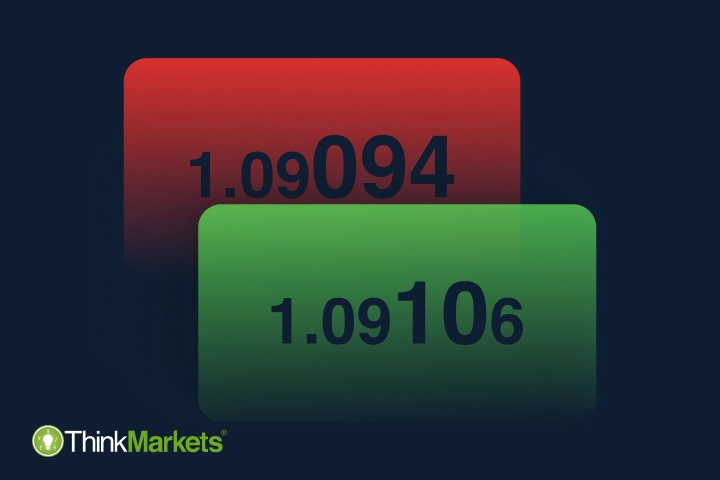
<p>In the world of financial markets, forex has a special place. It is the world's most popular and biggest financial market, and as of April 2022, it has an average daily trading volume of USD 7.5 trillion. But what does forex mean, and how can you trade it? In this article, we’ll walk you through the basics of the forex market and the terms you need to know to start forex trading. </p> <h2>What is forex, and what is forex trading?</h2> <p>Forex, commonly referred to as FX, stands for the foreign exchange market. It’s a global marketplace where dozens of currencies are converted into one another for various purposes, such as international trade, tourism or personal gain. Due to its nature, forex trading involves a wide range of participants in this exchange process – governments, banks, multinational corporations, institutional investors, retail traders and even regular people. In fact, anyone who has ever travelled abroad and exchanged their home country’s currency for a local currency of their destination has done a transaction on a foreign exchange market.</p> <h2>Why is the forex market so popular?</h2> <p>There are many reasons why the currency market is so popular among online traders. Here are some of its main benefits:</p> <h3>Easier to follow</h3> <p>There are only a few currencies that most traders follow – these include the US dollar, Euro, and British pound. Other favoured but less frequently traded currencies are the Canadian, Australian, and New Zealand Dollars, and the Japanese Yen. As there are only a handful of popular currencies to focus on, it can help make it easier for traders to develop a deeper understanding of their behaviour and the factors that influence their movements. </p> <h3>Liquidity</h3> <p>The large number of participants and transactions bring high liquidity to forex trading, resulting in very low trading costs. And the ever-present supply and demand makes trading on leverage highly accessible. The latter allows good traders even with a small amount of capital to extract value from the forex markets, something that’s difficult to do when trading stocks.</p> <h3>Volatility</h3> <p>Forex prices can be influenced by various factors, which often cause high volatility and, as a result, numerous trading opportunities. Take a value stock as a comparison, it may hardly move some days, making it difficult to day trade. This is not the case with Forex trading, and you can find opportunities anytime during the day, whether it be after, before, or during work hours. </p> <h3>Round-the-clock access five days a week</h3> <p>Due to its decentralisation, forex transactions can be carried out at any time, except during the weekend. There is no centralised exchange, instead central banks, large banks, hedge funds, and retail brokers have built electronic networks, and deal directly with each other to facilitate trading outside traditional trading hours.</p> <h3>How does forex work?</h3> <p>When a forex trader exchanges a currency, you sell it and buy another one. Since there are always two currencies involved in this process, forex instruments are quoted in pairs – for example, EUR/USD or GBP/USD. The first currency is referred to as the base, and the second one is called the quote.</p> <br /> <br /> <img alt="base currency EUR - USD Quote currency" src="/getmedia/6ce661c1-e988-483e-ad7a-39908fb6f085/what-is-forex-trading-image01.png" style="display: flex; margin: 20px auto;" title="base currency EUR - USD Quote currency" /> <h2>Types of pairs in the forex market</h2> <p>Forex pairs are divided into three large groups depending on what currencies are included in them.</p> <h3>Major currency pairs</h3> <p>Major pairs include the currencies of the most developed countries traded against the USD. The US dollar is always present in these pairs as the base or quote currency because it is an official reserve currency worldwide, meaning it is widely used in international trade and held as a reserve by central banks across the world. It makes USD the dominant currency in forex and other markets like commodities that are also traded against it. Some of the most popular major pairs are EUR/USD, GBP/USD and USD/JPY.</p> <h3>Minor currency pairs</h3> <p>Minor pairs also include currencies of large economies but are not tied to the USD – EUR/GBP, EUR/CHF or GBP/CAD, for example.</p> <h3>Exotic currency pairs</h3> <p>Exotic pairs usually consist of one currency of a major economy traded against the currency of a developing country. Some examples are AUD/MXN, USD/HKD and GBP/ZAR.</p> <h2>How does currency trading work?</h2> <p>The value of a forex pair indicates the value of a base currency against the quote currency. In other words, it shows how many units of the quote currency you can get for 1 unit of the base currency. This is also called an exchange rate.<br /> For example, the EUR/USD currency pair exchange rate at the time of writing was 1.02839, which means for 1 euro, you would get 1.02839 US dollars.</p> <br /> <img alt="base currency EUR - USD Quote currency" src="/getmedia/b7de8307-5d14-4929-8cd6-d1aa06f5dc55/what-is-forex-trading-image02.png" style="display: flex; margin: 20px auto;" title="base currency EUR - USD Quote currency" /> <p paraeid="{b45da9f9-ab40-462f-8ec2-c07bc0d46b8a}{75}" paraid="900764359">It is important to note that since the forex market is decentralised, the exchange rate may vary from one broker or bank to another. </p> <p paraeid="{b45da9f9-ab40-462f-8ec2-c07bc0d46b8a}{91}" paraid="1272472748">When it comes to online trading, brokers source their exchange rates from a group of establishments called liquidity providers – usually banks and other large financial institutions and display them as bid and ask prices.</p> <h2>What are bid and ask prices in forex?</h2> <p>In forex trading, you have probably come across "bid" and "ask" prices. Think of the "bid" as the price you'll receive when you want to sell a currency. The "ask" is the price you'll pay when you want to buy. For example, if you're looking at EUR/USD, the "bid" tells you how many US dollars you'll receive for selling 1 Euro, while the "ask" represents how many US dollars you need to spend to buy 1 Euro. As you can see in the image below, you would receive 1.02839 USD for selling one Euro, while if you were to buy one Euro, you would need to pay 1.02847. This buy price is slightly higher than the sell price because of the spread, which is the difference between the “bid” and “ask” prices. </p> <br /> <img alt="table with instrument sell buy columns" src="/getmedia/0dc1949c-bd93-47ef-a868-7acf8d50ef8f/what-is-forex-trading-image03.png" style="display: flex; margin: 20px auto;" title="table with instrument sell buy columns" /> <h2>What is the spread in forex trading?</h2> <p paraeid="{b6259188-8ad3-442e-91ef-fc8790f06976}{19}" paraid="909016290">A spread in forex trades means the difference between the buy and sell prices that represents the transaction cost of every currency pair. Whether you buy or sell a currency, you will always be charged this amount upon opening a trade. The spread is what your broker earns for enabling you to trade. It is a markup, the same way as retailers adds a markup in any other product. However, the high competition in the forex markets ensures it’s the cheapest financial market to trade. </p> <p paraeid="{b6259188-8ad3-442e-91ef-fc8790f06976}{75}" paraid="1881540912">In the image below we see that the cost of trading is 0.8, for a 100,000 Euro transaction the cost would be 8 USD, making it unbeatably cheap. </p> <p paraeid="{b6259188-8ad3-442e-91ef-fc8790f06976}{95}" paraid="643707991">When you open a trade, the spread is deducted from the start. In a winning trade, the spread cost is deducted from a profit, and in a losing one, it is added to the loss. </p> <br /> <img alt="table with instrument sell buy columns" src="/getmedia/0d6ce7ac-c7be-40f0-82b6-4a292c3855ac/what-is-forex-trading-image04.png" style="display: flex; margin: 20px auto;" title="table with instrument sell buy columns" /> <p>It’s important to note that a spread directly depends on the liquidity of a currency pair. For example, the most liquid pairs (majors) usually have very tight spreads, meaning traders can open positions at a lower cost and make a profit faster if the market moves in their favour. Minor pairs are traded less often and have wider spreads, slightly increasing the trading cost, and exotic currency pairs have the widest spreads.</p> <p>The spread amount also varies from broker to broker and can even be different depending on the account type within the same broker. For example, if you trade forex with ThinkMarkets, a Standard account will give you access to tight spreads – just a few pips, but if you choose a ThinkZero trading account, most pairs will have 0 spreads.</p> <h2>What are pips in forex?</h2> <p>In forex trading, pip stands for percentage in point or price interest point. It is the smallest one-digit movement of a currency’s price measured by the fourth decimal point and used to calculate a spread.</p> <p>Here is a little graphic to help you understand how the price of a currency works:</p> <br /> <img alt="EUR/USD" src="/getmedia/5a1f9093-0c16-4fcd-b1c7-7e8274bec12c/what-is-forex-trading-image05.png" style="display: flex; margin: 20px auto;" title="EUR/USD" /> <p>Forex pairs that have Japanese yen as a quote currency are displayed only until the third decimal point, so the pip is measured by the second one.</p> <img alt="USD/JPY" src="/getmedia/5ee3c9cb-3972-4b49-b098-7c761624aefb/what-is-forex-trading-image06.png" style="display: flex; margin: 20px auto;" title="USD/JPY" /> <p>To calculate a spread, you need to subtract the sell price from the buy price. In our previous example, the spread is:</p> <br /> <img alt="1.02847 - 1.02839 = 0.8 pips" src="/getmedia/72f5e4d8-fc4b-4dbe-aa5f-b081b3ec9fbd/what-is-forex-trading-image07.png" style="display: flex; margin: 20px auto;" title="1.02847 - 1.02839 = 0.8 pips" /> <p>On ThinkMarkets’ proprietary platform, ThinkTrader, the spreads are displayed within each price quote for your convenience, so you don’t need to calculate them.</p> <p>Now, your next question may be how to calculate your profit or loss in pips when you trade forex and how to trade forex in the first place. Head over to our <a href="~/en/trading-academy/forex/what-affects-forex-exchange-rates">next article</a>, where we discuss it in detail. You can also create a demo trading account on ThinkTrader to apply your newly obtained knowledge in practice.</p>
What affects forex exchange rates?
<p>Financial markets' moves are difficult to predict. However, your chances of success are much higher when you understand how the markets work and what exactly affects the prices of financial instruments. Understanding these details can help you plan your trades strategically instead of randomly guessing your next step and hoping for good luck.<br /> <br /> When it comes to predicting currency exchange rates, it's important to understand that forex, like all financial markets, is heavily influenced by supply and demand. A decreasing supply paired with an increasing demand usually leads to rising prices. Similarly, an increased supply with decreased demand drives the prices down.<br /> <br /> Factors affecting supply and demand and, therefore, the exchange rate movements of every currency pair can vary depending on the main pillars of each country's economy. For example, Australian and Canadian economies rely on natural resources export, which affects the exchange rate of the Australian and Canadian dollar (AUD and CAD) against other currencies. On the other hand, the United Kingdom and the pound (GBP) are more sensitive to political developments and interest rate movements.<br /> <br /> Despite these differences, trading experts have identified the common factors affecting supply and demand on forex.<br /> <br /> <img alt="" src="/getmedia/f3d6d0f9-9b0d-468f-8431-0d3ee0757d1d/article-forex-what-affects-forex-rates.webp" /></p> <h2>Main factors affecting foreign exchange rates</h2> <h3>International trade</h3> <p>Trading activities between different countries directly affect the value of their currencies. When a country exports some goods, in many cases, a buyer pays for the products in the exporter's local currency. If a country's exports are higher than its imports, it creates a high demand for its currency and, as a result, increases its value.<br /> <br /> The amount of exports and imports of every country, in turn, depends on the country's needs and production structure. For example, the US and Brazil are long-term trading partners. Let's assume the US has been importing coffee from Brazil for USD 2 per kg, but suddenly Colombia offered a price of USD 1 per kg. If the US, one of the largest coffee importers, were to go for Colombian coffee instead of Brazilian because of more attractive import prices, it would decrease Brazilian exports significantly. As a result, the demand for the Brazilian real (BRL) and its exchange rate against a foreign currency, USD in this case, would also decline. At the same time, favourable export prices would increase demand for the Colombian peso (COP), strengthening it against USD.<br /> <br /> Some specific countries, like Australia and New Zealand depend strongly on exports, and there is a high correlation between the price of what they export and their currency. However, for most other large economies, the state of their trade balance has minimal impact on the currency exchange rate. This was not the case 30 or 40 years ago when capital restrictions limited capital flow. </p> <h3>Inflation</h3> <p paraeid="{94c33f92-f774-48ac-9997-dda5c9bbd5a4}{50}" paraid="2063613172">Inflation means a rise in prices of goods over time that leads to the decreasing purchasing power of a country's currency. For example. if inflation in the UK increases by 10% over a year, that means that the British Pound has dropped 10% in value compared to the year earlier. In terms of exchange rates, if inflation is at 2% in the USA, then the GBP/USD exchange rate should depreciate by 8% in favour of the US Dollar to compensate for the difference in inflation between the two countries. </p> <p paraeid="{94c33f92-f774-48ac-9997-dda5c9bbd5a4}{138}" paraid="1186889332">To track inflation rate changes, traders usually keep an eye on the Consumer Price Index (CPI) reports. Most countries release these reports monthly, except in Australia and New Zealand, which publish them quarterly. CPI is a widely considered measure of inflation because it tracks the percentage change in the price of a basket of goods commonly purchased by consumers. </p> <h3>Interest rates</h3> <p>High interest rates attract foreign capital to a country, promising foreign investors higher returns on their capital. With more investors entering the country's local market, the demand for its currency increases, driving its value higher. On the flip side, low interest rates make a country less attractive for foreign investment.<br /> <br /> Interest rates and inflation are directly correlated – growing inflation is usually followed by increasing interest rates as governments are trying to battle currency depreciation. This, in turn, strengthens the currency and affects exchange rates.<br /> <br /> In 2022 trading world witnessed a clear example of this process when the US Federal Reserve announced the sharpest interest rate hike since the 1980s, which resulted in the almost immediate US dollar strengthening while other currencies traded against it crashed.<br /> <br /> Experienced traders usually keep an eye on central banks’ interest rate decisions to find trading opportunities.</p> <h3>Economic indicators and political stability</h3> <p>Besides inflation and interest rates, it's worth watching Gross Domestic Product (GDP), which provides a snapshot of the economic conditions of a country, the balance of payments, government debt, the unemployment rate and other factors. All of them influence the country's currency value in one way or another. Traders are able to see a schedule of these releases in the economic calendar, which is a very popular tool for identifying potential trading opportunities.<br /> <br /> The number of different reports to check can get a little overwhelming for a new trader, but the good news is you don't have to check them all at once. Beginners tend to stick to the most important and self-explanatory ones. For example, GDP is the ultimate indicator of the economic health of any country. Fast GDP growth usually implies a strong economy and high demand for its currency, which in turn drives its price up.<br /> <br /> The political environment of a country also has a significant influence on its currency exchange rate. Similar to the low interest rates, political turmoil makes a country less appealing for foreign capital, resulting in a declining exchange rate of its currency.<br /> <br /> Both economic figures and political updates are usually heavily covered in the news, making news trading the most attractive trading strategy for beginners.<br /> <br /> Once you get more comfortable with the basic figures we discussed above, you can move on to an in-depth analysis of multiple numbers suggesting changes in exchange rates. Keep in mind that any of the factors mentioned above can rarely influence price movements on their own. A comprehensive approach requires comparing a few numbers and drawing a general conclusion based on your findings.</p> <h3>Market sentiment</h3> <p>In anticipation of a currency's rise or fall, many traders start buying or selling a currency before it changes its value. This, in turn, increases its demand or supply, resulting in price swings triggered solely by traders' activity. This factor is usually hard to predict as it depends only on the human factor and traders' perception of the upcoming events.<br /> <br /> This is where technical analysis with chart patterns and indicators come into play, which we will discuss in detail in our <a href="~/en/trading-academy/what-is-technical-analysis-in-trading">Technical analysis in trading</a> blog.<br /> <br /> Before you dive deeper into analysing forex, it may be a good idea to practice your newly obtained knowledge on a <a href="~/en/demo-account">risk-free demo account</a>. Our proprietary, award-winning trading platform ThinkTrader, for example, offers dozens of forex pairs and USD 10,000 of virtual money.</p>
How to trade forex
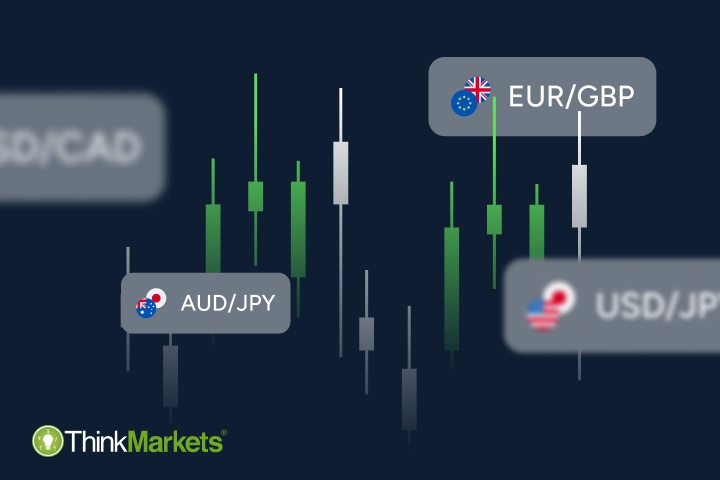
<p>Besides the obvious way of trading forex in the form of the physical foreign exchange transaction, a large part of forex transactions is executed by retail traders who trade forex pairs online for personal gain. As there is no physical exchange of currencies in online trading, forex pairs are traded via derivatives.<br /> <br /> One of the most popular ways to trade currency pairs online is via CFDs – contracts for difference. If you are not familiar with the concept of derivatives or CFD trading, check out our <a href="~/en/trading-academy/cfds/what-are-cfds">CFD trading: a beginner’s guide</a>, where we explain it in detail.</p> <h2>How to trade forex with CFDs</h2> <p>When you trade forex with CFDs, you predict the direction of a future price movement of a currency pair. If the price moves according to your prediction, you gain a profit, and if the market moves against your prediction, you incur a loss. Let's see how it works following simple forex trading examples from the previous What is forex trading article.<br /> <br /> Imagine that the current buy price of the EUR/USD pair is 1.02839. Your research indicates that the euro will soon start strengthening against the US dollar, and the pair's price will go up.<br /> <br /> You open a long (buy) CFD position on the pair. If your prediction is correct and the price goes up to 1.03039, the price difference – 0.0020 or 20 pips, is your profit. If the price moves in the opposite direction and goes down to 1.02639 instead, the price difference becomes your loss.<br /> <img alt="" src="/getmedia/32be74e5-7189-44de-add9-f61a6f466526/article-how-to-trade-forex-long-cfd.webp" style="width: 552px; height: 441px;" /><br /> <br /> In the opposite scenario, where you think the price of the pair will decrease, you open a short (sell) position. If your prediction is correct and the price drops to 1.02639, you gain a profit of 0.0020 or 20 pips. Should the market move against your prediction and reach 1.03039 instead, you lose.<br /> <br /> <img alt="" src="/getmedia/2a0c3c54-37cf-462d-a39a-ac653e6bad4b/article-how-to-trade-forex-short-cfd.webp" style="width: 552px; height: 443px;" /><br /> <br /> The USD 0.0020 seems like a small amount to win or lose. However, this number applies only to 1 unit of a currency – 1 euro in this example, while in CFD trading, currencies are traded in lots.</p> <h2>What is a lot in forex trading?</h2> <p>A lot in CFD trading (whether it's forex or any other financial market) is a measurement of a contract size. It usually varies depending on the market and instrument. In forex, one standard lot of all currency pairs is 100,000 units of a currency. So, one lot of EUR/USD would mean EUR 100,000. Most brokers allow traders to open much smaller positions, also called mini and micro-lots. With ThinkMarkets, for example, you can trade as little as 1,000 units of EUR/USD or EUR 1,000, which is 0.01 lot.<br /> <br /> <img alt="" src="/getmedia/2b6dc4f9-9a54-4222-8318-0d87eaba69b2/article-how-to-trade-forex-lot.webp" style="width: 552px; height: 343px;" /><br /> <br /> If you were trading one lot in our example, the amount of profit or loss – 0.0020 – would be multiplied by 100,000, resulting in a much bigger number:<br /> <br /> <img alt="" src="/getmedia/4c1103c3-3d42-40cc-9ee0-93b72af0becd/article-how-to-trade-forex-lot-formula-1.webp" style="width: 439px; height: 21px;" /><br /> <br /> With this formula, you can always calculate your potential profit or loss:<br /> <br /> <img alt="" src="/getmedia/1ff7f27d-5dbb-408a-987f-1b7b65007ced/article-how-to-trade-forex-lot-formula-2.webp" style="width: 520px; height: 24px;" /><br /> <br /> Now, if you trade one lot of EUR/USD, which means trading EUR 100,000, it may sound like a very large amount to open a trade with. However, when you trade CFDs, you don't need to pay the full amount to open a trade of that size because you trade with leverage.</p> <h2>What is leverage in forex?</h2> <p>Leverage is a term used to describe the process of borrowing funds from a broker to open trades larger than your capital. This term is not forex-specific and applies to any instrument and market traded with CFDs or other types of trading contracts that have this feature. We explain how it works in our <a href="~/en/trading-academy/cfds/what-are-cfds">CFD trading: a beginner’s guide</a> too.<br /> To give a brief example based on our EUR/USD currency pair, let's assume you are trading 1 lot with 200:1 leverage. It means that you only need to pay 1/200th part, or USD 500, to open this trade. The higher the leverage, the smaller the amount you need to deposit to open a trade.<br /> <br /> <img alt="" src="/getmedia/15264210-73a6-4725-a562-a37415119a09/article-how-to-trade-forex-leverage-200-to-one.webp" style="width: 552px; height: 308px;" /><br /> <br /> Please keep in mind that using risk management tools when trading with leverage is crucial for every forex trader because while leverage increases buying power, it can also increase losses if a trade happens to be losing.</p> <p paraeid="{22306c66-6283-487d-9399-a4aca021fe63}{241}" paraid="451896581">The maximum level of leverage depends on multiple factors, such as the broker's offering, account type, market, instrument, or country of trader's residence. For example, the maximum allowed leverage in the UK, Australia, and the EU is 30:1 due to regulating bodies within those regions, while in other parts of the world, it can be as high as 500:1. </p> <p paraeid="{250ca595-575b-4406-8923-97f21a83a46f}{2}" paraid="1503769214">However, there is a difference between maximum and optimal leverage, and very few people ever trade effectively at the maximum level, the same way you would not drive a sports car at top speed in a built-up area. </p> <p paraeid="{250ca595-575b-4406-8923-97f21a83a46f}{36}" paraid="1266073801">Instead, people will tend to trade with no more than ten times leverage. So, if a trader has deposited $10,000 to trade, they would rarely open positions larger than $100,000. </p> <h2>How to start trading the foreign exchange market</h2> <p>Here is a list of the first three important steps you need to do to start trading forex online:</p> <h3>Choose a forex broker</h3> <p>Most online trading brokers offer a variety of financial markets, not just currency trading, so you don't need to be focused on finding a forex-specific broker. It's crucial, however, to look for a well-regulated trading partner licensed by reputable regulators. ThinkMarkets, for example, has multiple licences and is regulated by the UK’s Financial Conduct Authority (FCA), the Australian Securities and Investments Commission (ASIC) and the Cyprus Securities and Exchange Commission (CySEC), among others.</p> <h3>Choose a trading platform</h3> <p paraeid="{250ca595-575b-4406-8923-97f21a83a46f}{138}" paraid="1017778112">Most forex brokers usually offer several trading platforms. Explore your options and compare trading account types associated with them to find the one you are most comfortable with. Pay attention to the ease of use, offered spreads and leverage. </p> <p paraeid="{250ca595-575b-4406-8923-97f21a83a46f}{144}" paraid="390720054">ThinkMarkets' proprietary trading platform, ThinkTrader, may be a good option if you are a manual trader. It offers a user-friendly, intuitive design, a wide variety of currency pairs, tight competitive spreads and fast execution. Available as a mobile and desktop app, as well as in a web browser, ThinkTrader is also equipped with a powerful suite of advanced tools to help you grow as a trader. Moreover, you can create a free demo account first and practise trading with virtual funds risk-free. </p> <p paraeid="{250ca595-575b-4406-8923-97f21a83a46f}{178}" paraid="1797459728">ThinkMarkets also offers MetaTrader 4 and 5 for traders who may prefer these platforms, and for their EA or custom indicator capability. </p> <p><br /> <br /> <img alt="" src="/getmedia/e77ab2f8-dd0c-4075-8a02-481d68a8d02f/article-how-to-trade-forex-platform.webp" style="width: 552px; height: 235px;" /></p> <h3>Choose a currency pair to trade</h3> <p>Most new traders tend to start their forex trading journey with the most traded major currency pairs because there is more information about them, and they present diverse trading opportunities. Here are some of the most popular forex pairs among beginners and experienced forex traders:<br /> <br /> <img alt="" src="/getmedia/57fd89e8-5fff-4c02-a731-17275c6196e3/article-how-to-trade-forex-pairs.webp" style="width: 552px; height: 300px;" /><br /> Keep in mind that there are quite a few factors that may cause price swings, so it is necessary to research before selecting a pair and placing a forex trade. In our <a href="~/en/trading-academy/forex/what-affects-forex-exchange-rates">next article</a>, we'll find out what moves the forex market prices to help you identify potential trading opportunities. Once you have that knowledge, you can move on to getting to know trading strategies and building your own forex trading strategy.</p>
Trading the Non-farm payroll (NFP) report
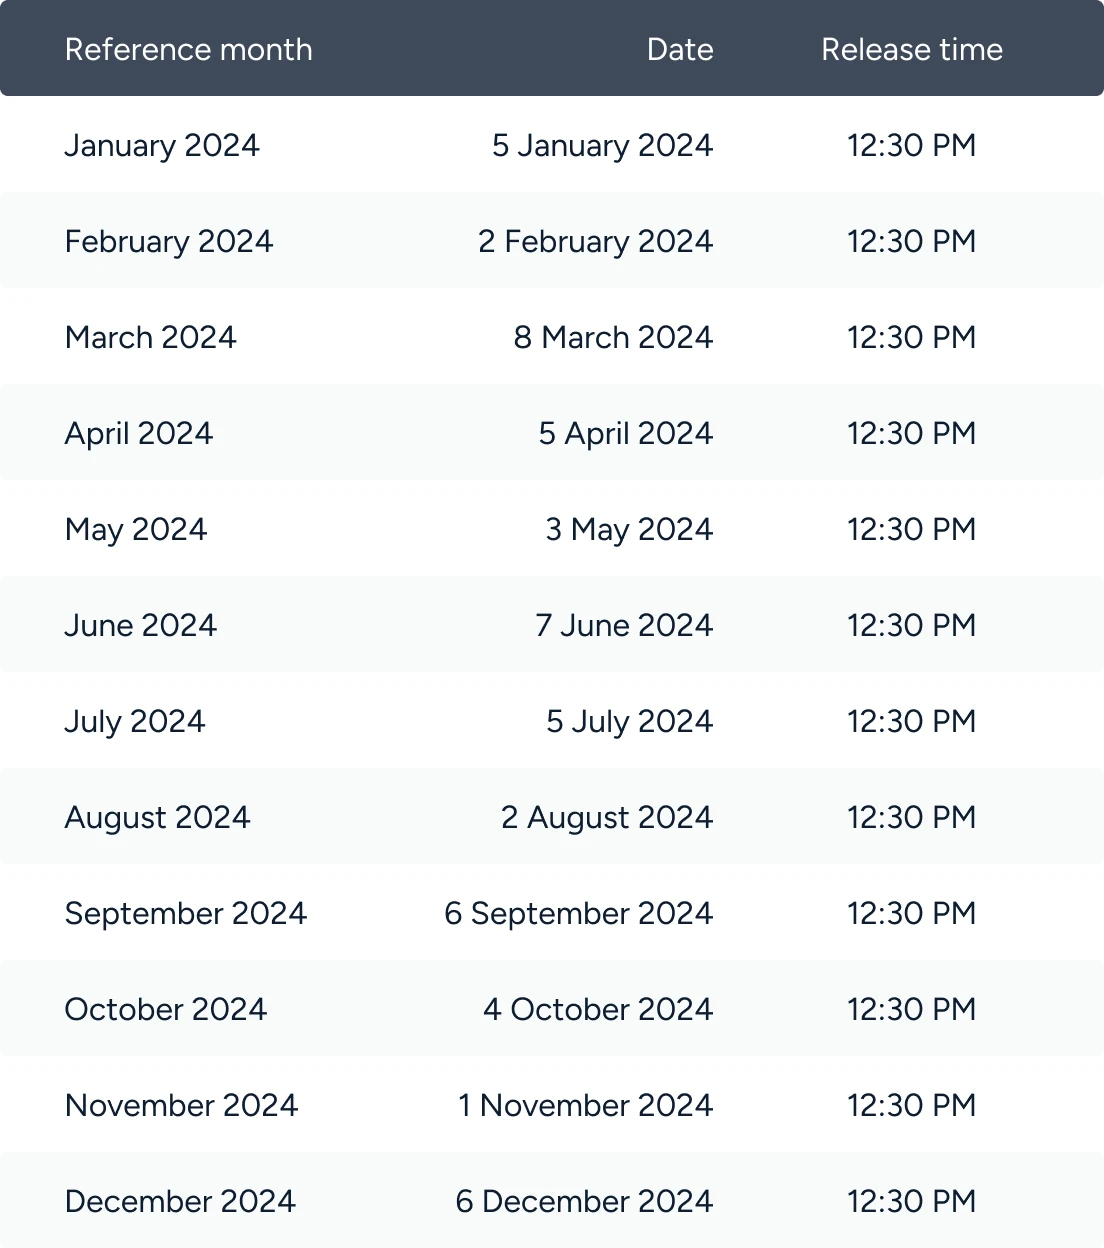
<h2>What is the NFP report?</h2> <p>Non-farm payroll (NFP) is a monthly report on nonfarm employment numbers in manufacturing, construction and goods, which totals to around 80% of US jobs. It contains information related to the unemployment rate, job growth, and other key employment statistics.</p> <p>The report does not include US jobs in private households, the federal government, nonprofit organisations, and as the name suggests, farm workers. Data within the Non-farm payroll report is measured by the <a href="https://www.bls.gov" target="_blank">Federal Bureau of Labor Statistics</a> through the Employment Situation report and is typically released on the first Friday of every calendar month.</p> <h2>Why is the Non-farm payroll important?</h2> <p>The report is an important economic indicator of how the US economy is performing, as it reports on the number of people employed or unemployed in the US. It is considered one of the most consistent news announcements that can cause large rate movements that result in volatile markets, particularly affecting major currency pairs in forex. As a stand-alone report, it is important in its own right, as an indication of whether the economy will strengthen or decline; for example, if the unemployment rate is high, it could indicate a declining economy.</p> <p>However, it is also an important piece of a jigsaw when looking at other key factors that influence the US economy, such as economic policy-making. Interest rates, for example, are set by the <a href="https://www.federalreserve.gov/monetarypolicy/fomc.htm" target="_blank">Federal Open Market Committee (FOMC)</a> in the monthly Federal Reserve meeting, and the board will look at the Bureau of Labor statistics NFP figures when deciding if they are going to lower or raise interest rates in their monetary policy. Changing interest rates will have a big impact on markets such as forex, commodities and stocks, and can cause big volatility.</p> <h2>Non-farm payroll report calendar</h2> <p>The NFP is released typically every first Friday of the calendar month at 13.30pm (GMT), below you can see the dates for 2023.</p> <p><img alt="NFP-calendar" src="/getmedia/7ade571b-7f2e-4ac4-acb2-32f69f83074d/NFP-calendar.png" style="width: 552px; height: 760px;" title="NFP-calendar" /></p> <h2>How does the NFP affect the markets?</h2> <p>The NFP report is important to traders as it can be a cue to analyse how other factors will adapt, such as the Federal Reserve and other government agencies, to attempt to move the economy in a certain direction. It is just one factor of many that can act as a catalyst for volatility and market price changes.</p> <p>The government will adapt policies to combat issues within the economy such as inflation or recession. If the NFP report indicates employment is dropping, it could indicate that the economy is declining. This, in turn, will prompt the Federal reserve to adjust interest rates to restore balance. If rates adjust, this will trickle down into the markets.</p> <h5>Trading on Non-farm payrolls</h5> <p>Firstly, monitor the report. The primary focus of the NFP report are the employment figures, mainly on jobs added or reduced. However, there are smaller components you can also watch out for when trading.</p> <p><strong>Take note of sector specific data</strong></p> <p>If the NFP report shows a decline in employment, traders will monitor which industries or sectors this decline is coming from. It could indicate the sector itself is struggling, which can have a knock-on effect to stocks and shares.</p> <p><strong>Don't just focus on figures, also focus on earnings</strong></p> <p>If average hourly earnings have dropped, but the employment figures are stagnant, this could also indicate a decline. It could also point to trouble where we could see the workforce output fall as employees could leave the workplace due to declining earnings. On the other hand, higher earnings could indicate wage inflation.</p> <p><strong>Monitor previous reports</strong></p> <p>As the scale of the NFP report is so large, it is often subject to large revisions of the previous headline figures. If this happens, it could cause a sudden jolt in the markets.</p> <p>When trading on the Non-farm payroll report, economists will try to predict what the headline figures (or NFP number) will be on a monthly basis, while also monitoring other reports, rates and financial events. Trades will then be placed on whether they think this result will make markets go up or down. The markets most affected by the NFP report are forex, indices and commodities.</p> <p style="text-align: justify;">A declining report may not be bad news for traders since it's possible to potentially benefit from this outcome with <a href="/en/trading-academy/cfds/what-are-cfds">contracts for difference (CFDs)</a>. CFDs allow you to trade volatile markets whether they go up or down; you just need to correctly predict which way the market will go by going long or short. You can use <a href="/en/trading-academy/cfds/risk-management-tools-in-cfd-trading">risk management tool</a> such as stop loss and take profit to minimise your risk, but as always with trading, act with caution. Plan your strategy, monitor reports such as the NFP and take advantage of our built-in economic calendar to monitor other major financial events on our award-winning app ThinkTrader.</p>

What is the Consumer Price Index (CPI), and how does it affect the markets?
<p>What is the Consumer Price Index (CPI), and how does it affect the markets?</p> <h2>Types of CPI</h2> <p>The BLS regularly produces official CPI estimates based on two population groups – CPI for all urban consumers (CPI-U) and CPI for urban wage earners and clerical workers (CPI-W).<br /> <br /> The CPI-U covers almost 93% of the entire US population and is the main report used by the Federal Reserve. As such, when we talk about the CPI in this article, we’ll be pertaining to the CPI-U data.<br /> <br /> On the other hand, the CPI-W covers the prices paid by urban wage earners, clerical workers, self-employed individuals, short-term workers, unemployed individuals, and retirees.</p> <h2>How is the CPI market basket determined?</h2> <p>The US Bureau of Labor Statistics (BLS) surveys consumers in private households nationwide as a reference population, collecting information on their spending habits and frequently purchased items. The data collected determines the weight of the item categories in the CPI index structure.</p> <h2>What goods and services are covered by the CPI?</h2> <p>The BLS classified the average American expenditure and consumption patterns into eight major categories.<br /> <br /> <img alt="" src="/getmedia/a8ab296c-c0f7-4830-a75a-e9f3738c5890/article-what-is-cpi-pie-diagram.webp" style="width: 338px; height: 336px;" /></p> <ol> <li>Housing </li> <li>Food and beverages </li> <li>Transportation </li> <li>Commodities </li> <li>Healthcare </li> <li>Energy prices </li> <li>Education </li> <li>Other expenses</li> </ol> <p><br /> The change in price over time for each category is weighed and averaged to create the CPI data.</p> <h3>How is the CPI calculated?</h3> <p>The BLS enlists the help of price collectors to survey over 80,000 price data from 23,000 retail and service establishments throughout the country. They also monitor over 50,000 housing units to calculate the average price changes in rental properties.<br /> </p> <p>Below is the formula to calculate the annual CPI.</p> <br /> <br /> <strong>Annual CPI = (value of goods and services for the current year/value of goods and services in the previous year) x 100</strong><br /> <br /> Let’s look at an example to visualise it further. The price movements below are for illustrative purposes only, and the figures are oversimplified. Let’s assume that this table is the current total expenditure of an average urban consumer for 2021 and 2022.<br /> <br /> <img alt="" src="/getmedia/677c64a3-9049-4aa7-986f-26f99c025c46/article-what-is-cpi-table-expenditure.webp" style="width: 427px; height: 467px;" /> <p>Below is the formula to calculate the CPI.</p> <img alt="" src="/getmedia/ec721e29-4b2e-4159-8d81-778949e8dd49/article-what-is-cpi-calculation-annual.webp" style="width: 552px; height: 104px;" /><br /> <br /> Given this calculation, the annual <strong>CPI for 2022 is 112.31.</strong> <h2>How is the inflation rate calculated from the CPI report?</h2> <p>Inflation is the rise in prices of goods and services. The rate at which prices increase is called the inflation rate.<br /> <br /> A steady inflation rate is a significant economic indicator symbolising a country’s economic health. High inflation rates mean prices rise rapidly at the expense of the general public’s purchasing power. A low or negative inflation rate, called deflation, is also negative as the economy has become stagnant.<br /> <br /> <a href="~/en/trading-academy/federal-reserve">The Federal Reserve</a> aims to keep the inflation rate at 2% in the US. The Fed uses the CPI published monthly by the BLS to measure inflation. Below is the formula to calculate the US inflation rate:<br /> <br /> <strong>Inflation rate = (current CPI – previous CPI) x 100</strong><br /> <br /> Let’s use the example above to illustrate. Let’s assume that the 2021 CPI is 101.4.<br /> <br /> <img alt="" src="/getmedia/e443f689-1573-4297-ac57-af171047ca19/article-what-is-cpi-calculation-inflation.webp" style="width: 277px; height: 232px;" /><br /> <br /> Given this calculation, the inflation rate from 2021 to 2022 is 10.91%. That means the price of consumer goods and services rose by 10.91%.</p> <h2>How does the CPI affect the markets?</h2> <p>The release of CPI data is one of the most anticipated events by traders. It is normal to see volatility in charts before and after the release. However, one thing to note is that traders do not react to the CPI data. Traders react in anticipation of the Federal Reserve’s actions with regard to the CPI report.<br /> <br /> The Federal Reserve looks at the CPI report, the Price Producer Index (PPI), and the Personal Consumption Expenditures (PCE) price index to determine whether they should adjust the current monetary policy.<br /> <br /> The current mandate of the Federal Reserve is to keep inflation at a steady 2%. Suppose the rate falls below or above this level. In that case, the Fed may implement either an expansionary monetary policy, lowering the interest rates to stimulate the economy or a contractionary monetary policy, increasing interest rates to reduce the money supply in circulation.<br /> <br /> To find out how these policies affect the markets, read our article on the <a href="~/en/trading-academy/federal-reserve">Federal Reserve</a>.</p>

What is technical analysis in trading?
<p>The most important part of any trading strategy is knowing when to enter and exit the market. In our previous trading guides and articles, we covered various factors influencing price movements in financial markets, such as economic indicators and political climate.<br /> <br /> Analysing such factors is called fundamental analysis, and it is a very popular method to evaluate future price movements among traders.<br /> <br /> However, some traders consider insights found with the help of fundamental analysis insufficient to provide exact buy and sell levels. That’s where technical analysis can be useful.</p> <p>In this article, we’ll explain what technical analysis is, how it works, and its main types.</p> <h2>What is technical analysis?</h2> <p>Technical analysis is the process of evaluating past price movements of an instrument to determine its future moves. The reason it’s called technical is because it’s based purely on statistics and is not affected by news, economic or political factors.<br /> <br /> While this method is widely used by traders all over the globe, it’s important to understand that past prices don’t predict or dictate future prices, and all the insights gathered with the help of technical analysis are solely indicative.<br /> <br /> Technical analysis includes multiple tools. An experienced technical analyst usually uses various combinations of them to compare results and make an informed trading decision. These tools can be divided into three categories: trend lines, chart patterns and technical indicators.<br /> <br /> All three analyse price charts. So whichever type you choose, the single most important thing is to learn how to read price charts.</p> <h2>What is a price chart?</h2> <p>A price chart in trading is a graphic sequence of historical prices of an instrument. Charts are at the heart of trading as they help traders to monitor the value of their current positions, analyse past price movements and get cues as to where the price may move next. Understanding how to read a price chart is a key step in learning technical analysis.<br /> <br /> Each trading platform offers a different set of various chart types, and the choice depends purely on a trader’s personal preference. ThinkMarkets’ proprietary platform ThinkTrader, for example, has over 15 different charts to accommodate traders’ needs.<br /> <br /> <img alt="" src="/getmedia/6aae82dc-4ad4-43ba-9b7b-fdbf2373e549/article-what-is-technical-analysis-price-chart-1.webp" style="width: 552px; height: 464px;" /><br /> <br /> Some popular ones are candlestick, bar and line charts:<br /> <br /> <img alt="" src="/getmedia/ffc042b3-bc5a-4a9e-81e8-da5cb1ba5b5c/article-what-is-technical-analysis-chart-types.webp" style="width: 552px; height: 258px;" /><br /> <br /> As a candlestick chart is the most commonly used by traders, let’s see how it works in detail.</p> <h2>Candlestick chart</h2> <p>A candlestick chart is called so because each unit of it looks like a candle. The time frame of candles can be adjusted from one minute to one month, depending on the strategy:<br /> <br /> <img alt="" src="/getmedia/0f95f823-f6c9-42e1-a8f7-dcfb6ace79e7/article-what-is-technical-analysis-candlestick-chart.webp" style="width: 552px; height: 431px;" /><br /> <br /> Regardless of the chosen time frame, each candle consists of two main elements: the wick and the body that represent four prices of an instrument:</p> <ul> <li>Opening price</li> <li>Highest price reached during the chosen period</li> <li>Lowest price reached during the chosen period</li> <li>Closing price</li> </ul> <p><br /> The candles are coloured depending on whether the market rose or fell during the selected timeframe. Green candles (white on some platforms) indicate rising or bullish prices, and red (black) represent falling prices, also called bearish.<br /> <br /> <img alt="" src="/getmedia/38272a03-b39f-4a17-85b3-e0377aacfc0a/article-what-is-technical-analysis-candlestick-wicks.webp" style="width: 552px; height: 327px;" /><br /> <br /> In technical analysis, it is exactly the relationship between individual candlesticks that helps traders predict a future price movement.</p> <h2>Types of technical analysis</h2> <p>As we mentioned above, technical analysis tools can be segregated into three categories: trend lines, chart patterns and technical indicators.</p> <h5>Trend lines</h5> <p>Prices never move in straight lines. Influenced by many factors, they move up and down, forming highs and lows. A trend means the overall direction of the price movements. Trend lines are just straight lines that traders use to connect highs and lows on a price chart to identify a trend. Some trend lines, such as support and resistance, are used to identify an entry and exit level before opening a position.<br /> <br /> In one of our following articles, we’ll explain how trend analysis works and how to identify a trend in detail.</p> <h5>Chart patterns</h5> <p>A chart pattern is a graphic sequence of lines that can be identified on a price chart. Chart patterns are very popular among traders as they can often signal the beginning, end, strengthening or weakening of a trend.<br /> <br /> We’ll go through the most popular patterns in one of our next articles as well and explain how they work.</p> <h5>Technical indicators</h5> <p>Technical analysis indicators are mathematical calculations based on historical data and used to identify price action. As complex as it sounds, traders don’t need to do the actual math. Every trading platform offers technical indicators that can be simply applied to a price chart. The main goal for a trader is to learn how to read them.<br /> <br /> Depending on their types, technical indicators can analyse trend direction and strength and identify potential entry and exit points. We will cover this topic in detail in our following articles too.<br /> <br /> For now, to start getting familiar with technical analysis, we suggest creating a <a href="~/en/demo-account">risk-free demo account</a> on ThinkTrader and studying various price charts. You will be able to use the same platform to continue your journey with technical analysis, as it offers an extensive suite of analytical tools.<br /> </p>
Trading 101: Dynamic leverage – what it is, how it works, and more!
<p paraeid="{0188ab9a-1a10-4ca0-a0cd-0e583ff40dfe}{250}" paraid="278386506">ThinkMarkets has just launched its new set of account types. With it comes a powerful and advanced tool that can help improve your trading experience – Dynamic leverage. <br /> </p> <p paraeid="{53584117-4d11-4bc6-a2de-46df2c0cc4e6}{5}" paraid="1688564561">This comprehensive guide aims to help you understand the mechanics of dynamic leverage, what it is, and how it works, more importantly, how you can use dynamic leverage to maximise potential profit while minimising risk exposure. </p> <h2 aria-level="2" paraeid="{53584117-4d11-4bc6-a2de-46df2c0cc4e6}{23}" paraid="1399599748" role="heading">Understanding dynamic leverage: What it is </h2> <p aria-level="2" paraeid="{53584117-4d11-4bc6-a2de-46df2c0cc4e6}{23}" paraid="1399599748" role="heading">Dynamic leverage is a mechanism that adjusts a trader's leverage based on a specific criterion determined by a broker. For example, ThinkMarkets' dynamic leverage feature relies on a trader's trade size. <br /> </p> <p paraeid="{53584117-4d11-4bc6-a2de-46df2c0cc4e6}{55}" paraid="1957324963">Unlike fixed leverage, where a trader's leverage ratio remains constant, dynamic leverage automatically changes. </p> <h2 aria-level="2" paraeid="{53584117-4d11-4bc6-a2de-46df2c0cc4e6}{61}" paraid="1459467418" role="heading">Mechanics of dynamic leverage: How it works </h2> <p paraeid="{53584117-4d11-4bc6-a2de-46df2c0cc4e6}{71}" paraid="61956003">If you trade with ThinkMarkets on an account with dynamic leverage, your leverage automatically changes depending on the size of your trade orders. Leverage and trade size, in this situation, shares an inverse relationship. As your position size increases, the leverage applied to a portion of your trade decreases. <br /> </p> <p paraeid="{53584117-4d11-4bc6-a2de-46df2c0cc4e6}{93}" paraid="579399769">The process is automatic and recalculated in real time to guarantee that your risk exposure is reduced as you undertake bigger positions. This is a particularly nifty feature for risk mitigation and helping you avoid significant losses during volatile times. </p> <h2 aria-level="2" paraeid="{53584117-4d11-4bc6-a2de-46df2c0cc4e6}{113}" paraid="533089364" role="heading">Dynamic leverage example: XAUUSD scenario </h2> <p paraeid="{53584117-4d11-4bc6-a2de-46df2c0cc4e6}{119}" paraid="432313868">Let's look at an example to visualise properly how dynamic leverage works. </p> <p paraeid="{53584117-4d11-4bc6-a2de-46df2c0cc4e6}{131}" paraid="1408111790">You decide to open a long position of 25 lots on XAUUSD, priced at 1,800. Below is the table of leverage tiers used by ThinkMarkets. </p> <p paraeid="{53584117-4d11-4bc6-a2de-46df2c0cc4e6}{152}" paraid="899852099">According to the dynamic leverage tiers provided above: <br /> </p> <ul> <li paraeid="{53584117-4d11-4bc6-a2de-46df2c0cc4e6}{162}" paraid="367445120">For the first 10 lots, you get access to a leverage of 500:1 with a margin requirement of 0.2%. </li> <li paraeid="{53584117-4d11-4bc6-a2de-46df2c0cc4e6}{173}" paraid="1262078354">The following 10 lots fall under the tier with 200:1 leverage and a 0.5% margin requirement. </li> <li paraeid="{53584117-4d11-4bc6-a2de-46df2c0cc4e6}{180}" paraid="1527732668">The remaining 5 lots are at a leverage of 100:1 with a 1% margin requirement. </li> </ul> <h2 aria-level="2" paraeid="{53584117-4d11-4bc6-a2de-46df2c0cc4e6}{191}" paraid="1480331102" role="heading">Margin requirement calculation </h2> <table aria-rowcount="5" border="1" cellpadding="5" cellspacing="0" data-tablelook="1696" data-tablestyle="MsoTableGrid" style="width:550px;"> <thead style="background-color: #3e4a5a"> <tr aria-rowindex="1" role="row"> <td data-celllook="0" role="rowheader"> <p paraeid="{53584117-4d11-4bc6-a2de-46df2c0cc4e6}{197}" paraid="1477560330" style="text-align: center"><span style="color:#ffffff;"> Position size <br /> (lots)</span> </p> </td> <td data-celllook="0" role="columnheader"> <p paraeid="{53584117-4d11-4bc6-a2de-46df2c0cc4e6}{204}" paraid="1364141596" style="text-align: center"><span style="color:#ffffff;"> Leverage</span> </p> </td> <td data-celllook="0" role="columnheader"> <p paraeid="{53584117-4d11-4bc6-a2de-46df2c0cc4e6}{213}" paraid="91376119" style="text-align: center"><span style="color:#ffffff;">Margin requirement</span> </p> </td> <td data-celllook="0" role="columnheader"> <p paraeid="{53584117-4d11-4bc6-a2de-46df2c0cc4e6}{220}" paraid="246922951" style="text-align: center"><span style="color:#ffffff;">Margin calculation for XAUUSD at $1800 </span></p> </td> <td data-celllook="0" role="columnheader"> <p paraeid="{53584117-4d11-4bc6-a2de-46df2c0cc4e6}{231}" paraid="969306125" style="text-align: center"><span style="color:#ffffff;">Margin required </span></p> </td> </tr> </thead> <tbody> <tr aria-rowindex="2" role="row"> <td data-celllook="0" role="rowheader"> <p paraeid="{53584117-4d11-4bc6-a2de-46df2c0cc4e6}{243}" paraid="1594320989" style="text-align: center">10 </p> </td> <td data-celllook="0"> <p paraeid="{53584117-4d11-4bc6-a2de-46df2c0cc4e6}{250}" paraid="357531691" style="text-align: center">500:1 </p> </td> <td data-celllook="0"> <p paraeid="{45a7d192-07e9-41a6-8c56-d613f7c443b4}{2}" paraid="153041093" style="text-align: center">0.2% </p> </td> <td data-celllook="0"> <p paraeid="{45a7d192-07e9-41a6-8c56-d613f7c443b4}{9}" paraid="1663063140" style="text-align: center">10 lots x 100 oz x 1800 </p> <p paraeid="{45a7d192-07e9-41a6-8c56-d613f7c443b4}{19}" paraid="166789265" style="text-align: center">500 </p> </td> <td data-celllook="0"> <p paraeid="{45a7d192-07e9-41a6-8c56-d613f7c443b4}{26}" paraid="347818917" style="text-align: center">$3,600 </p> </td> </tr> <tr aria-rowindex="3" role="row"> <td data-celllook="0" role="rowheader"> <p paraeid="{45a7d192-07e9-41a6-8c56-d613f7c443b4}{34}" paraid="658483082" style="text-align: center">10 </p> </td> <td data-celllook="0"> <p paraeid="{45a7d192-07e9-41a6-8c56-d613f7c443b4}{41}" paraid="458902278" style="text-align: center">200:1 </p> </td> <td data-celllook="0"> <p paraeid="{45a7d192-07e9-41a6-8c56-d613f7c443b4}{48}" paraid="389634407" style="text-align: center">0.5% </p> </td> <td data-celllook="0"> <p paraeid="{45a7d192-07e9-41a6-8c56-d613f7c443b4}{55}" paraid="1145375416" style="text-align: center">10 lots x 100 oz x 1800 </p> <p paraeid="{45a7d192-07e9-41a6-8c56-d613f7c443b4}{61}" paraid="583617992" style="text-align: center">200 </p> </td> <td data-celllook="0"> <p paraeid="{45a7d192-07e9-41a6-8c56-d613f7c443b4}{68}" paraid="378543494" style="text-align: center">$9,000 </p> </td> </tr> <tr aria-rowindex="4" role="row"> <td data-celllook="0" role="rowheader"> <p paraeid="{45a7d192-07e9-41a6-8c56-d613f7c443b4}{76}" paraid="1192086914" style="text-align: center">5 </p> </td> <td data-celllook="0"> <p paraeid="{45a7d192-07e9-41a6-8c56-d613f7c443b4}{83}" paraid="498187169" style="text-align: center">100:1 </p> </td> <td data-celllook="0"> <p paraeid="{45a7d192-07e9-41a6-8c56-d613f7c443b4}{90}" paraid="505165159" style="text-align: center">1% </p> </td> <td data-celllook="0"> <p paraeid="{45a7d192-07e9-41a6-8c56-d613f7c443b4}{97}" paraid="304540604" style="text-align: center">10 lots x 100 oz x 1800 </p> <p paraeid="{45a7d192-07e9-41a6-8c56-d613f7c443b4}{103}" paraid="1766904942" style="text-align: center">100 </p> </td> <td data-celllook="0"> <p paraeid="{45a7d192-07e9-41a6-8c56-d613f7c443b4}{110}" paraid="664003524" style="text-align: center">$9,000 </p> </td> </tr> <tr aria-rowindex="5" role="row"> <td data-celllook="0" role="rowheader"> <p paraeid="{45a7d192-07e9-41a6-8c56-d613f7c443b4}{118}" paraid="2065218661" style="text-align: center">Total size </p> </td> <td data-celllook="0"> <p paraeid="{45a7d192-07e9-41a6-8c56-d613f7c443b4}{127}" paraid="1523390084" style="text-align: center">25 lots </p> </td> <td data-celllook="0"> <p paraeid="{45a7d192-07e9-41a6-8c56-d613f7c443b4}{134}" paraid="420359243" style="text-align: center"> </p> </td> <td data-celllook="0"> <p paraeid="{45a7d192-07e9-41a6-8c56-d613f7c443b4}{139}" paraid="1809839187" style="text-align: center"> </p> </td> <td data-celllook="0"> <p paraeid="{45a7d192-07e9-41a6-8c56-d613f7c443b4}{144}" paraid="581316709" style="text-align: center">$21,600.00 </p> </td> </tr> </tbody> </table> <p paraeid="{45a7d192-07e9-41a6-8c56-d613f7c443b4}{154}" paraid="1627421560"><br /> This means that for your 25-lot position on XAUUSD, the total margin required would be $21,600, given the price was 1,800. </p> <h2 aria-level="2" paraeid="{45a7d192-07e9-41a6-8c56-d613f7c443b4}{168}" paraid="675519154" role="heading">Advantages of dynamic leverage: Why it's good for traders </h2> <p paraeid="{45a7d192-07e9-41a6-8c56-d613f7c443b4}{180}" paraid="858754147">While the notion of Dynamic leverage might sound intimidating, it offers several benefits that can elevate your trading: </p> <h3 aria-level="3" paraeid="{45a7d192-07e9-41a6-8c56-d613f7c443b4}{196}" paraid="1962088252" role="heading">Risk management </h3> <p paraeid="{45a7d192-07e9-41a6-8c56-d613f7c443b4}{202}" paraid="1189862223">Dynamic leverage automatically adjusts to the size of your open positions, which helps manage risk more effectively. As you increase your position size, your leverage decreases, reducing the potential for significant losses relative to your account balance. This built-in risk control mechanism is especially valuable during times of increased market volatility, where price fluctuations can be more pronounced. </p> <h3 aria-level="3" paraeid="{45a7d192-07e9-41a6-8c56-d613f7c443b4}{236}" paraid="952117703" role="heading">Flexibility </h3> <p paraeid="{45a7d192-07e9-41a6-8c56-d613f7c443b4}{242}" paraid="1314929708">The ability to open positions with higher leverage allows you to maximise your trading potential even with limited capital. Higher leverage means less capital is required to open a position, giving you the opportunity to make significant profits from relatively small price movements. ThinkMarkets offers leverage as high as 2000:1 with the Mini account on select markets. Please note that higher leverage can increase profits but also increases the risk of losses. </p> <h3 aria-level="3" paraeid="{d5dc342c-a9cb-4381-a023-abdb11e42ca1}{15}" paraid="1933726148" role="heading">Capital preservation </h3> <p paraeid="{d5dc342c-a9cb-4381-a023-abdb11e42ca1}{21}" paraid="1498073827">One of the primary goals of trading is to preserve your capital while generating returns. By scaling down leverage on larger trades, dynamic leverage prevents you from overexposing yourself to the market. This is crucial for long-term trading sustainability, as it helps ensure that you do not quickly deplete your trading capital, allowing you to continue trading even after a series of losses. </p> <h2 paraeid="{d5dc342c-a9cb-4381-a023-abdb11e42ca1}{21}" paraid="1498073827">How to integrate Dynamic leverage into your trading strategy </h2> <p paraeid="{d5dc342c-a9cb-4381-a023-abdb11e42ca1}{57}" paraid="2049712165">Get a feel of dynamic leverage by starting small. Our Mini account allows traders up to 2000:1 leverage with only a required minimum deposit of $10. Take advantage of this higher leverage for potential greater returns. <br /> </p> <p paraeid="{d5dc342c-a9cb-4381-a023-abdb11e42ca1}{81}" paraid="1108824244">Make sure you closely monitor your positions to understand how your leverage changes as you scale your trade size. We recommend using take-profit and stop-loss orders to secure profits and manage risk effectively. <br /> </p> <p paraeid="{d5dc342c-a9cb-4381-a023-abdb11e42ca1}{95}" paraid="434903734">As you adjust to having Dynamic leverage in your trading, familiarise yourself with the leverage tiers offered on your preferred market. Calculate your margin requirements correctly to avoid prematurely triggering a margin call. <br /> </p> <p paraeid="{d5dc342c-a9cb-4381-a023-abdb11e42ca1}{107}" paraid="341621967">To sum up, Dynamic leverage offers traders a significant advantage and the flexibility to pursue aggressive strategies in small positions while preserving capital and managing risk as exposure grows. However, it's crucial to understand and anticipate the risks associated with trading. <br /> </p> <p paraeid="{d5dc342c-a9cb-4381-a023-abdb11e42ca1}{129}" paraid="475202109">Trade with Dynamic leverage in a simulated trading environment risk-free by creating a Mini demo account. </p>
Trading styles
<h3>Trading styles</h3> <p>Here we will discuss the trading styles you are likely to come across. What typically separates the trading styles is the length of time you intend to be in a trade, the timing of your entry and in some cases, the frequency of the trades.</p> <p>There are no strict rules as to which timeframes a particular trader would use to trade, however the table below provides typical timeframes you would expect to see a trader using.</p> <div class="smallmargin-bottom"><img alt="Trading styles" src="/TMXWebsite/media/TMXWebsite/trading_styles_1.png" /></div> <div class="text-center smallmargin-bottom"><img alt="Trading styles" src="/TMXWebsite/media/TMXWebsite/trading_styles_2.png" /></div> <h3>EOD (End of Day)</h3> <div class="smallmargin-bottom"><img alt="Trading styles" src="/TMXWebsite/media/TMXWebsite/trading_styles_3.png" /></div> <p>This is a popular trading style for anyone who works full time. They may analyse the markets on a daily or weekly basis and set pending orders to catch price moves as they evolve – they will not be watching the screens when their orders trigger.</p> <p>If you have a busy lifestyle this may be a suitable method because it requires less time in front of the screen to analyse or manage the trade.</p> <h3>Fundamental (Macro Trading)</h3> <div class="smallmargin-bottom"><img alt="Trading styles" src="/TMXWebsite/media/TMXWebsite/trading_styles_3-(1).png" /></div> <p>Using Fundamental information and/or financial models to assess the strength or weakness of a stock, currency, market, or country to anticipate future price value. The source of information would vary between stocks and forex as they are are also affected by internal news of a particular company, as well as macro information.</p> <h3>Intraday trading</h3> <div class="smallmargin-bottom"><img alt="Trading styles" src="/TMXWebsite/media/TMXWebsite/trading_styles_4.png" /></div> <p>An intraday trader opens and closes a trade within the same day. Swing trading the 1HR chart could be included as Day Trading, and day-trading has a lot more emphasis on Technicals over fundamentals.</p> <p>There are also different forms of intraday trading which are covered in detail below, including: Scalping; News Trading; Swing Trading; Trend Trading.</p> <h3>News trading</h3> <div class="smallmargin-bottom"><img alt="Trading styles" src="/TMXWebsite/media/TMXWebsite/trading_styles_5.png" /></div> <p>News traders tend to specialise in ‘Red News’ events and trade during, or around the release of an important news release. Extreme volatility can occur if a surprise figure is released (which is not widely anticipated by the markets) which creates opportunity to make more profit over a very short period of time. However, longer-term moves may also unfold after an important event which may get the interest of macro traders to trade on the longer term trend, however news trading typically relates to short-term events.</p> <h3>Position trading</h3> <div class="smallmargin-bottom"><img alt="Trading styles" src="/TMXWebsite/media/TMXWebsite/trading_styles_3-(2).png " /></div> <p>A type of trader who holds a position for the long term (from weeks, to months to years). Long-term traders are not concerned with short-term fluctuations because they believe that their long-term investment horizons will smooth these out.</p> <p>Position traders tend to use a lot more fundamental information due to the longer holding time of the trade, yet they may also be purely technical. Position traders and swing traders are more likely to use pending orders to enter the market, as they don’t need to be at the screen when their trade enters or exits.</p> <h3>Scalping</h3> <div class="smallmargin-bottom"><img alt="Trading styles" src="/TMXWebsite/media/TMXWebsite/trading_styles_6.png" /></div> <p>Scalping is a form of intraday trading, and unlike the other styles, you must stay glued to your screen as if your life depends on it.</p> <p>Whilst it is an extremely popular form of trading due to the higher potential for profits, it is also one of the harder styles to master as it requires a lot more discipline from the trader. Despite this last point, scalping typically attracts the most interest from newer traders.</p> <p>Intraday and scalpers will use 1-click trading to enter the market live because a quick entry is very important to them.</p> <h3>Swing trading</h3> <div class="smallmargin-bottom"><img alt="Trading styles" src="/TMXWebsite/media/TMXWebsite/trading_styles_7.png" /></div> <p>As a swing trader you are literally trying to trade the swing of a chart and hope to catch a big move. Popular timeframes are to enter on the daily chart, and hold a position for days, or sometimes weeks. However, the 1 hour charts are also very popular with a view to hold a position for a few hours, or maybe overnight and potentially for a few days.</p> <h3>Technical trading</h3> <div class="smallmargin-bottom"><img alt="Trading styles" src="/TMXWebsite/media/TMXWebsite/trading_styles_8.png" /></div> <p>Analyse, enter, manage and exit their trading using technical analysis. This can be performed on any timeframe, although generally speaking ‘technicals’ are more popular on intraday timeframes, however technical analysis can also be used for long-term forecasting.</p> <h3>Trend trading</h3> <div class="smallmargin-bottom"><img alt="Trading styles" src="/TMXWebsite/media/TMXWebsite/trading_styles_9.png" /></div> <p>The object here is to identify a trend and only trade in the same direction as the suspected trend. Traditionally trends traders were associated with long-term fund managers, however in reality you can become a trend trader on any timeframe you choose as all timeframes trend.</p>

Popular Forex Trading Strategies
<p dir="ltr"><strong>Identifying a successful forex trading strategy </strong>is one of the most important aspects of <a href="/en/forex-trading/">currency trading</a>. In general, there are numerous trading strategies designed by different types of traders to help you make profit in the market.<br /> </p> <p dir="ltr">However, an individual trader needs to find the best forex trading strategy that suits their trading style, as well as their risk tolerance. In the end, no one size fits all. <br /> </p> <p dir="ltr">In order to make profit, traders should focus on eliminating the losing trades and achieving more winning ones. Any trading strategy that leads you towards this goal could prove to be the winning one. <br /> </p> <h2 dir="ltr">How to choose the best forex trading strategy</h2> <p dir="ltr">Before we proceed to discussing the most popular forex trading strategies, it’s important that we understand the best methods of choosing a trading strategy. There are three main elements that should be taken into consideration in this process.<br /> </p> <h3 dir="ltr">Time frame </h3> <p dir="ltr">Choosing a time frame that suits your trading style is very important. For a trader, there’s a huge difference between trading on a 15-min chart and a weekly chart. If you are leaning more towards becoming a scalper, a trader that aims to benefit from smaller market moves, then you should focus on the lower time frames e.g. from 1-min to 15-min charts. <br /> </p> <p dir="ltr">On the other hand, swing traders are likely to use a 4-hour chart, as well as a daily chart, to generate profitable trading opportunities. Hence, before you choose your preferred trading strategy, make sure you answer the question: how long do I want to stay in a trade? <br /> </p> <p dir="ltr">Varying time periods (<strong>long, medium, and short-term</strong>) correspond to different trading strategies. <br /> </p> <h3 dir="ltr">Number of trading opportunities</h3> <p dir="ltr">When choosing your strategy, you should answer the question: how frequently do I want to open positions? If you are looking to open a higher number of positions then you should focus on a scalping trading strategy. <br /> </p> <p dir="ltr">On the other hand, traders that tend to spend more time and resources on analysing macroeconomic reports and fundamental factors are likely to spend less time in front of charts. Therefore, their preferred trading strategy is based on higher time frames and bigger positions.<br /> </p> <h3 dir="ltr">Position size</h3> <p dir="ltr">Finding the proper trade size is of the utmost importance.<strong> Successful trading strategies</strong> require you to know your risk sentiment. Risking more than you can is very problematic as it can lead to bigger losses. <br /> </p> <p dir="ltr">A popular piece of advice in this regard is to set a risk limit at each trade. For instance, traders tend to set a 1% limit on their trades, meaning they won’t risk more than 1% of their account on a single trade. </p> <p dir="ltr"> </p> <p dir="ltr"><img alt="Forex trading - ThinkMarkets" src="/TMXWebsite/media/TMXWebsite/3-strategies-image-1.jpg" /></p> <p dir="ltr">For example, if your account is worth $30,000, you should risk up to $300 on a single trade if the risk limit is set at 1%. Depending on your risk sentiment, you can move this limit to 0.5% or 2%. <br /> </p> <p dir="ltr">In general, the lower the number of trades you are looking to open the bigger the position size should be, and vice versa. <br /> </p> <h2>Three successful strategies</h2> <p dir="ltr">By now, you have identified a time frame, the desired position size on a single trade, and the approximate number of trades you are looking to open over a certain period of time. Below, we share three popular forex trading strategies that have proven to be successful. <br /> </p> <h3 dir="ltr">Scalping</h3> <p dir="ltr"><strong>Forex scalping</strong> is a popular trading strategy that is focused on smaller market movements. This strategy involves opening a large number of trades in a bid to bring small profits per each. <br /> </p> <p dir="ltr">As a result, scalpers work to generate larger profits by generating a large number of smaller gains. This approach is completely opposite of holding a position for hours, days, or even weeks. <br /> </p> <p dir="ltr">Scalping is very popular in forex due to its liquidity and volatility. Investors are looking for markets where the price action is moving constantly to capitalise on fluctuations in small increments.<br /> </p> <p dir="ltr">This type of trader tends to focus on profits that are around 5 pips per trade. However, they are hoping that a large number of trades is successful as profits are constant, stable and easy to achieve. <br /> </p> <p dir="ltr">A clear downside to scalping is that you cannot afford to stay in the trade too long. Additionally, scalping requires a lot of time and attention, as you have to constantly analyse charts to find new trading opportunities. <br /> </p> <p dir="ltr">Let’s now demonstrate how scalping works in practice. Below you see the EUR/USD 15-min chart. Our scalping trading strategy is based on the idea that we are looking to sell any attempt of the price action to move above the 200-period moving average (MA). </p> <p dir="ltr"> </p> <p dir="ltr"><img alt="EUR/USD 15-Minute Chart" src="/TMXWebsite/media/TMXWebsite/EUR-USD-chart.jpg" /></p> <p dir="ltr"> </p> <p dir="ltr">In about 3 hours, we generated four trading opportunities. Each time, the price action moved slightly above the 200-period moving average before rotating lower. A stop loss is located 5 pips above the moving average, while the price action never exceeded the MA by more than 3.5 pips. <br /> </p> <p dir="ltr">Take profit is also 5 pips as we focus on achieving a large number of successful trades with smaller profits. Therefore, in total 20 pips were collected with a scalping trading strategy. <br /> </p> <h3 dir="ltr">Day trading</h3> <p dir="ltr"><strong>Day trading</strong> refers to the process of trading currencies in one trading day. Although applicable in all markets, day trading strategy is mostly used in forex. This trading approach advises you to open and close all trades within a single day. <br /> </p> <p dir="ltr">No position should stay open overnight to minimise the risk. Unlike scalpers, who are looking to stay in markets for a few minutes, day traders usually stay active over the day monitoring and managing opened trades. Day traders are mostly using 30-min and 1-hour time frames to generate trading ideas. <br /> </p> <p dir="ltr">Many day traders tend to base their trading strategies on news. Scheduled events e.g. economic statistics, interest rates, GDPs, elections etc., tend to have a strong impact on the market. <br /> </p> <p dir="ltr">In addition to the limit set on each position, day traders tend to set a daily risk limit. A common decision among traders is setting a 3% daily risk limit. This will protect your account and capital.<br /> </p> <p dir="ltr"> </p> <p dir="ltr"><img alt="GBP/USD 1-Hour Chart" src="/TMXWebsite/media/TMXWebsite/GBP-USD-chart.jpg" /></p> <p dir="ltr"> </p> <p dir="ltr">In the chart above, we see GBP/USD moving on an hourly chart. This trading strategy is based on finding the horizontal support and resistance lines on a chart. In this particular case, we are focused on resistance as the price is moving upward. <br /> </p> <p dir="ltr">The price movement tags the horizontal resistance and immediately rotates lower. Our stop loss is located above the previous swing high to allow for a minor breach of the resistance line. Thus, a stop loss order is placed 25 pips above the entry point. <br /> </p> <p dir="ltr">On the downside, we use the horizontal support to place a profit-taking order. Ultimately, the price action rotates lower to bring us around 65 pips in profits. <br /> </p> <h3 dir="ltr">Position trading</h3> <p dir="ltr"><strong>Position trading</strong> is a long-term strategy. Unlike scalping and day trading, this trading strategy is primarily focused on fundamental factors. <br /> </p> <p dir="ltr">Minor market fluctuations are not considered in this strategy as they don’t affect the broader market picture.<br /> </p> <p dir="ltr">Position traders are likely to monitor central bank monetary policies, political developments and other fundamental factors to identify cyclical trends. Successful position traders may open just a few trades over the entire year. However, profit targets in these trades are likely to be at least a couple of hundreds pips per each trade. <br /> </p> <p dir="ltr">This trading strategy is reserved for more patient traders as their position may take weeks, months or even years to play out. You can observe the <strong>dollar index (DXY)</strong> reversing its trend direction on a weekly chart below.</p> <p dir="ltr"> </p> <p dir="ltr"><img alt="DXY - the dollar index weekly chart" src="/TMXWebsite/media/TMXWebsite/USDX-US-Dollar-Index.jpg" /></p> <p dir="ltr"> </p> <p dir="ltr">A reversal is a result of the huge monetary stimulus provided by the US Federal Reserve and the Trump administration to help the troubled economy. As a result, the amount of active dollars increases, which decreases the value of the dollar. Position traders are likely to start selling the dollar on trillion-dollar stimulus packages. <br /> <br /> <br /> Their target may depend on different factors: long-term technical indicators and the macroeconomic environment. Once they believe that the current bearish trend is nearing its end from a technical perspective, they will seek to exit the trade. In this example, we see the DXY rotating at the multi-year highs to trade more than 600 pips lower 4 months later (March - July).<br /> </p> <h2>Summary</h2> <ul dir="ltr"> <li role="presentation">Each trader needs to find the best forex trading strategy that suits their trading style;</li> <li role="presentation">Choose your own trading strategy by finding a preferred time frame, the desired position size and the number of trades you are looking to open;</li> <li role="presentation">Scalping is a popular trading strategy that involves opening numerous trades over a short period of time to capitalise on smaller market movements;</li> <li role="presentation">Day traders tend to open and close all trades within a single day;</li> <li role="presentation">Position trading is reserved for more patient traders with a background in finance and economics as they look to profit from long-term market trends.</li> </ul>
Traders’ Gym 101: How to use ThinkMarkets’ exclusive backtesting tool
<p paraeid="{7c90bd47-7d9d-45e3-adca-ddf4dd5c5c68}{192}" paraid="684400438">If you could go back in the past, what would you do differently? <br /> </p> <p paraeid="{7c90bd47-7d9d-45e3-adca-ddf4dd5c5c68}{208}" paraid="957565690">In the world of trading, split-second decisions can result in thousands of dollars of profit or loss. It is not uncommon to hear stories of distressed traders missing a golden opportunity because of hesitation or, worse, lamenting about a bad trade that lost them a huge amount of money. <br /> </p> <p paraeid="{7c90bd47-7d9d-45e3-adca-ddf4dd5c5c68}{226}" paraid="1861411546">When the markets are highly volatile, having a robust, tried and tested trading strategy is doubly important. With a game plan in mind, traders avoid making huge mistakes, such as impulsive trades brought upon by emotions or FOMO. <br /> <br /> So, how do you build a trading strategy that you think could work? With backtesting, of course! <br /> </p> <p paraeid="{39090e05-068c-41e7-9cf0-595c1a4b6e3f}{13}" paraid="2026032670">Introducing Traders' Gym, ThinkMarkets' exclusive backtesting tool. By using Traders' Gym, traders can access real-life historical data and test their trading strategies to determine how they would have fared at that particular time. </p> <h3 aria-level="2" paraeid="{39090e05-068c-41e7-9cf0-595c1a4b6e3f}{31}" paraid="26210393" role="heading">What is backtesting? </h3> <p paraeid="{39090e05-068c-41e7-9cf0-595c1a4b6e3f}{43}" paraid="851200962">Backtesting is a data-driven process to evaluate the performance and efficiency of a trading strategy using historical market data. With a backtesting tool, traders can assess how a plan would have performed had they opened a position at the time. </p> <h3 aria-level="2" paraeid="{39090e05-068c-41e7-9cf0-595c1a4b6e3f}{49}" paraid="1706898775" role="heading">What is Traders' Gym? </h3> <p paraeid="{39090e05-068c-41e7-9cf0-595c1a4b6e3f}{57}" paraid="1532789690">Traders' Gym is ThinkMarkets' backtesting tool, available exclusively on ThinkTrader, its proprietary and award-winning trading platform. </p> <p paraeid="{39090e05-068c-41e7-9cf0-595c1a4b6e3f}{63}" paraid="346267293">Accessible to all ThinkTrader live account holders, Traders' Gym allows traders to enter a simulated market and choose a specific timeframe for testing. It offers a unique opportunity to gain valuable insights into a strategy's effectiveness and how to improve decision-making. </p> <h3 aria-level="2" paraeid="{39090e05-068c-41e7-9cf0-595c1a4b6e3f}{69}" paraid="1623950747" role="heading">How to use Traders' Gym? </h3> <p paraeid="{39090e05-068c-41e7-9cf0-595c1a4b6e3f}{77}" paraid="1416734207">We created a beginner-friendly video on how you can develop and test your trading strategy using Traders' Gym here. <br /> <br /> <a href="https://www.youtube.com/watch?v=kJ7pQM8g_EE" rel="noreferrer noopener" target="_blank">Traders' Gym: Develop and Test Your Trading Strategy</a> <br /> </p> <iframe allow="accelerometer; autoplay; clipboard-write; encrypted-media; gyroscope; picture-in-picture" allowfullscreen="" data-gtm-yt-inspected-12805312_132="true" data-gtm-yt-inspected-6="true" data-gtm-yt-inspected-9="true" frameborder="0" height="315" id="614567584" src="https://www.youtube.com/embed/kJ7pQM8g_EE?si=Hy7XMCrzS5RB9AAQ enablejsapi=1&origin=https%3A%2F%2Fwww.thinkmarkets.com" title="Live Market Analysis Webinar: 7 September 2021" width="566"></iframe> <h3 aria-level="2" paraeid="{39090e05-068c-41e7-9cf0-595c1a4b6e3f}{96}" paraid="1449664235" role="heading"><br /> Benefits of backtesting </h3> <p paraeid="{39090e05-068c-41e7-9cf0-595c1a4b6e3f}{106}" paraid="1853098259">Here's why you should include backtesting when you're building your trading strategy. <br /> </p> <ul> <li aria-level="3" paraeid="{39090e05-068c-41e7-9cf0-595c1a4b6e3f}{112}" paraid="1912719269" role="heading"><strong>Validate your strategy</strong></li> </ul> <p paraeid="{39090e05-068c-41e7-9cf0-595c1a4b6e3f}{120}" paraid="57901308">Gain an extra layer of confidence in your trading strategy by identifying whether it would have been profitable in the past. <br /> </p> <ul> <li aria-level="3" paraeid="{39090e05-068c-41e7-9cf0-595c1a4b6e3f}{126}" paraid="286902670" role="heading"><strong>Manage your risk </strong></li> </ul> <p paraeid="{39090e05-068c-41e7-9cf0-595c1a4b6e3f}{134}" paraid="537820592">Understand the potential risks associated with your strategies, including drawdowns, maximum losses, and the risk of such events. Adjust your take profit and stop loss depending on your risk tolerance. <br /> </p> <ul> <li aria-level="3" paraeid="{39090e05-068c-41e7-9cf0-595c1a4b6e3f}{140}" paraid="1952016635" role="heading"><strong>Enhance your skills risk-free </strong></li> </ul> <p paraeid="{39090e05-068c-41e7-9cf0-595c1a4b6e3f}{148}" paraid="673426426">Train your skills and execute your strategies under actual market conditions without the risk of losing money. As it is historical data, try multiple strategies using the same timeframe. </p> <h3 aria-level="2" paraeid="{39090e05-068c-41e7-9cf0-595c1a4b6e3f}{154}" paraid="1775050610" role="heading">Sign up for an account </h3> <p paraeid="{39090e05-068c-41e7-9cf0-595c1a4b6e3f}{162}" paraid="1549691577">Traders' Gym is free for all live ThinkTrader account holders. <a href="https://portal.thinkmarkets.com/account/individual" target="_blank">Open an account today</a> and start testing your strategies under real historical data. </p> <p paraeid="{39090e05-068c-41e7-9cf0-595c1a4b6e3f}{168}" paraid="429489726">Step into the future of trading with ThinkTrader and use the past as a learning experience. <br /> </p> <p paraeid="{39090e05-068c-41e7-9cf0-595c1a4b6e3f}{184}" paraid="496255478">Please note that past performance does not guarantee future returns. </p>
How to start trading the markets
<h2 id="how-to-start-heading-unique-id-1">Step 1 – Apply for an account with us</h2> We offer a wide range of financial instruments to trade across two of the industry’s leading platforms: MetaTrader 4 (MT4) and our very own ThinkTrader®. Simply apply for an account and provide us with the requested documentation and once approved, we’ll provide you with your login details to access your trading account for the very first time.<br /> <br /> <a href="https://portal.thinkmarkets.com/account/register/live?lang=en" id="button-one">Apply today</a><br /> <h2 id="how-to-start-heading-unique-id-2">Step 2 – Time to fund</h2> Once your account is opened you’ll be able to fund it and place your first trade. Funding your account is simple with our online client portal, ThinkPortal. In ThinkPortal you’ll have access to a wide list of funding options, from credit/debit card and bank wires to local payment providers and digital wallet services. The funds will usually be in your account within 12 hours and you’ll be ready to place your first trade.<br /> <br /> <a href="https://portal.thinkmarkets.com/" id="button-two">Fund your account</a><br /> <h2>Step 3 – Let’s get trading</h2> <p>Now that your account is open and funded, you can take that final step and open your first position. Here are a few pointers to help you get started:<br /> </p> <p>Remember – never place a trade that you’re not sure about. Your investment is at risk with every trade you place, so make sure you’re fully behind the decision of placing the trade before hitting the button.<br /> </p> <p> </p> <ol> <li> <p>Understand the markets – ensure you know what you want to trade and when to trade it. Our market analysis section provides plenty of market insight on a daily basis and becoming familiar with our analysts and their articles can be a helpful place to keep track of market news and trading opportunities.</p> </li> <li> <p>Know the platform – before opening your first trade we highly recommend that you become familiar with the platform of your choice. Explore the different platform features and ensure you’re comfortable with the settings before opening the order ticket for the first time. Read about our ThinkTrader® and MetaTrader 4 (MT4) platforms <a href="/en/platformoverview/">here</a></p> </li> <li> <p>Place your trade – once you’re comfortable within the platform, identify the trade you want to make and how you plan to execute it, open the order ticket, set your parameters and place the trade.</p> </li> </ol>
MT4 tips and tricks
<h2><strong style="color:#007c8c;">Customising charts</strong></h2> <p>You can fully customise your charts with indicators, grids and period separators and can add and remove these as you see fit. Here are some useful keyboard shortcuts for easy removals:<span style="font-size: 1.425rem; line-height: 1.6; font-family: EncodeSans, Helvetica, Arial, sans-serif; font-weight: normal;"> </span></p> <h5><span style="font-size: 1.425rem; line-height: 1.6; font-family: EncodeSans, Helvetica, Arial, sans-serif; font-weight: normal; margin-top: 0px;"><img alt="" src="~/getmedia/ad730baa-a9bd-415e-8ac7-4ae53466cfcf/MT4-Tips-and-Tricks-Custom-Charts_1.PNG" style="vertical-align: middle; margin-top: 0px; " /></span></h5> <p><br /> <strong><img alt="" src="/TMXWebsite/media/TMXWebsite/MT4-Tips-and-Tricks-hide-the-Bid.PNG?width=300&height=204" style="width: 300px; height: 204px; float: left; margin-top: 0px; margin-right:24px; margin-bottom:8px;" />Hiding the bid line</strong><br /> If you use a lot of technical analysis, the bid line can become rather obtrusive. To remove the bid line you can set the colour of the line to ‘None’, completely removing it from the chart.</p> <h5> </h5> <p><strong><img alt="" src="/TMXWebsite/media/TMXWebsite/MT4-Tips-and-Tricks-Setting-Default-Chart.PNG?width=300&height=489" style="width: 300px; height: 489px; float: left; margin-top: 0px; margin-right:24px;" /><strong>Setting the default chart</strong></strong><br /> Once you have a chart you’re happy with, you can save it as a template. The quickest and easiest way to do this is by right-clicking on the chart and selecting “Template”, followed by “Save Template”. You can have as many templates as you like to match all of your trading strategies.<br /> If you have a preferred template that you wish to save as your default, you can do this by right-clicking on the chart, selecting “Template”, “Save As” and then “Default”.</p> <h2><strong style="color:#007c8c;">Customising toolbars</strong></h2> <p>Many of the toolbar functionalities can be distracting and you may find you don’t use all of them. With MT4 you can add in or hide as many features as you want.<br /> <img alt="" src="/TMXWebsite/media/TMXWebsite/MT4-Tips-and-Tricks-Moving-Tool-Bar.PNG?width=300&height=168" style="width: 300px; height: 168px; float: right;" /> There are four separate toolbars available:</p> <ul> <li>Standard</li> <li>Chart studies</li> <li>Line studies</li> <li>Time frames</li> </ul> <p> </p> <p> </p> <p><br /> You can move toolbars around by simply dragging them to wherever you’d like them to be.<br /> <br /> To customise what you view, you can simply right-click on the toolbar and click on the customise sub-menu. Here you can remove functions that aren’t required by un-ticking them.<br /> <br /> <img alt="" src="/TMXWebsite/media/TMXWebsite/MT4-Tips-and-Tricks-hidden-Tool.PNG?width=300&height=141" style="width: 300px; height: 141px; float: right;" />By using the customise feature on each toolbar, you can access hidden tools, while removing any you don’t require. Through this technique, you can end up with a much cleaner and more compact user interface.</p> <br /> <p><strong>Using shortcuts</strong><br /> Keyboard shortcuts are a quick and easy way to perform tasks. By using shortcuts, you can have faster access to tools – saving plenty of time in the long run. You can remove redundant information and functionalities, and most importantly increase your charting space.<br /> The following keyboard shortcuts can help to navigate your way around the platform easier:<br /> </p> <table border="1" cellpadding="0" cellspacing="0"> <tbody> <tr> <td style="width:113px;"> <p><strong>Terminal</strong></p> </td> <td style="width:85px;"> <p>Control+T</p> </td> <td style="width:403px;"> <p>This is the main window you use while trading – manage open orders, view account history and set alerts</p> </td> </tr> <tr> <td style="width:113px;"> <p><strong>Navigator</strong></p> </td> <td style="width:85px;"> <p>Control+N</p> </td> <td style="width:403px;"> <p>Add Indicators, Expert Advisors and log in</p> </td> </tr> <tr> <td style="width:113px;"> <p><strong>Market Watch</strong></p> </td> <td style="width:85px;"> <p>Control+M</p> </td> <td style="width:403px;"> <p>View available instruments</p> </td> </tr> <tr> <td style="width:113px;"> <p><strong>Data Window</strong></p> </td> <td style="width:85px;"> <p>Control+D</p> </td> <td style="width:403px;"> <p>View all data for the product currently in the chart window</p> </td> </tr> </tbody> </table> <p><br /> You can use the following shortcuts when analysing and trading, which can greatly improve the process speed of your trading:<br /> </p> <table border="1" cellpadding="0" cellspacing="0"> <tbody> <tr> <td style="width:75px;height:17px;"> <p><strong>+</strong></p> </td> <td style="width:192px;height:17px;"> <p>Zoom in</p> </td> </tr> <tr> <td style="width:75px;height:18px;"> <p><strong>-</strong></p> </td> <td style="width:192px;height:18px;"> <p>Zoom out</p> </td> </tr> <tr> <td style="width:75px;height:17px;"> <p>Control+F</p> </td> <td style="width:192px;height:17px;"> <p>Crosshair</p> </td> </tr> <tr> <td style="width:75px;height:18px;"> <p>Control+Drag</p> </td> <td style="width:192px;height:18px;"> <p>Copy objects</p> </td> </tr> <tr> <td style="width:75px;height:17px;"> <p>Alt+Drag</p> </td> <td style="width:192px;height:17px;"> <p>Extend objects</p> </td> </tr> <tr> <td style="width:75px;height:18px;"> <p>Alt+T</p> </td> <td style="width:192px;height:18px;"> <p>One-click trading</p> </td> </tr> <tr> <td style="width:75px;height:17px;"> <p>Hotkeys</p> </td> <td style="width:192px;height:17px;"> <p>User-defined shortcuts</p> </td> </tr> </tbody> </table> <p> <br /> These are the shortcuts for the more visual aspects of your charts:</p> <table border="1" cellpadding="0" cellspacing="0"> <tbody> <tr> <td style="width:75px;height:17px;"> <p>F8</p> </td> <td style="width:192px;height:17px;"> <p>Edit chart graphics</p> </td> </tr> <tr> <td style="width:75px;height:18px;"> <p>F9</p> </td> <td style="width:192px;height:18px;"> <p>Order panel</p> </td> </tr> <tr> <td style="width:75px;height:17px;"> <p>F11</p> </td> <td style="width:192px;height:17px;"> <p>Full screen chart</p> </td> </tr> <tr> <td style="width:75px;height:18px;"> <p>Alt+1</p> </td> <td style="width:192px;height:18px;"> <p>Bar charts</p> </td> </tr> <tr> <td style="width:75px;height:17px;"> <p>Alt+2</p> </td> <td style="width:192px;height:17px;"> <p>Candlestick charts</p> </td> </tr> <tr> <td style="width:75px;height:18px;"> <p>Alt+3</p> </td> <td style="width:192px;height:18px;"> <p>Line charts</p> </td> </tr> </tbody> </table> <p> <br /> <strong>Using hotkeys</strong><br /> <img alt="" src="/TMXWebsite/media/TMXWebsite/MT4-Tips-and-Tricks-Hot-Key.PNG?width=300&height=334" style="width: 300px; height: 334px; float: left;" /><br /> <br /> <br /> </p> <p><br /> In MT4, when you switch your chart templates, you’ll lose any current analysis on your charts. To prevent this, you can leave your price charts open and just change the indicators that you use – this is where hotkeys come into play. You can assign a hotkey to place a certain indicator on your charts, instead of needing to change the template.</p> <p>To assign a hotkey to an indicator, simply right-click on the indicator on the navigator window and select “Hotkey”.<br /> <br /> <br /> <img alt="" src="/TMXWebsite/media/TMXWebsite/MT4-Tips-and-Tricks-Favorite-Chart.PNG?width=300&height=182" style="width: 300px; height: 182px; float: right;" /><br /> <br /> <strong>Favourites indicators list</strong><br /> To streamline the number of indicators that are available to you, you can create a favourites list. Here’s how you can add indicators to your favourites list:</p> <ol> <li> <p>Open Navigator (Control+N)</p> </li> <li> <p>Open relevant tab (Indicators, Scripts etc)</p> </li> <li> <p>Hover mouse over desired favourite</p> </li> <li> <p>Right-click on your mouse</p> </li> <li> <p>Select ‘Add to favourites’</p> </li> </ol> <br /> <img alt="" src="/TMXWebsite/media/TMXWebsite/MT4-Tips-and-Tricks-Alert.PNG?width=300&height=365" style="width: 300px; height: 365px; float: right;" /> <strong>Alerts</strong> <p>Alerts allow you to keep track of important price levels being breached, and can further enhance your analysis and chart organisation. If you track multiple markets, it can become easy to lose track of the markets, especially after an important event and all the markets move their separate ways.<br /> To set up alerts, move your mouse to the area on the chart you’d like to set the alert at, right-click on the position, select ‘Trading’ and then ‘Alert’.</p>
Ready to trade?
Ready to start your trading journey with ThinkMarkets? Apply for an account in just a matter of minutes.


