News headline Monday 10 April: ASX Stocks Close at a Record High
News headline Wednesday 19 April: $45 billion wiped off Stocks
What a difference a few days makes in the stock market! One thing is for sure, the only constant in the markets is change. Prices, and the underlying factors driving prices, are constantly changing. Another thing that is for sure, the old adage 'in the long run stocks always go up', can be countered by: 'yes, but in the short term they can go down quite a lot too!'
Looking at it from a charting (technical analysis) perspective, a tried and true method for investing is to apply one's capital after prices have fallen within a well-established long term uptrend. These short term countertrend movements are often called 'pullbacks' or 'corrections'. Whatever you call them, there are two major advantages of buying short term countertrend moves within a long term uptrend. They are: at the lower price, the company you are investing in generally has a more attractive valuation; and, one can set closer stop losses in order to keep risks relatively small compared to buying after a price surge. This post discusses the key technical analysis factors to look out for before attempting to buy a stock whose price has dipped.
Buy the dip 4-step approach
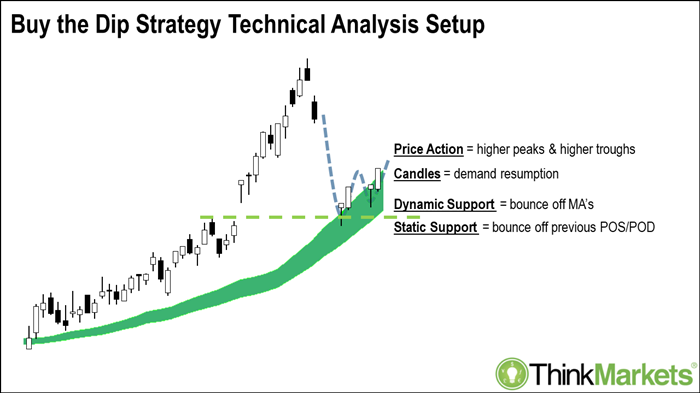
Step 1. Observe a well-established long term trend
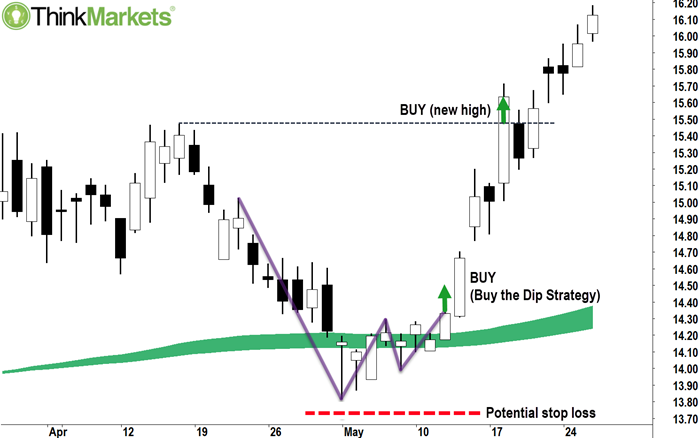
The trend is your friend! And the longer the trend has been in place, the more reliable it tends to be. One way to measure the long term trend is to apply longer term moving averages to your charts. We like to use durations of between 6-months and 1-year (approx. 130-250 periods) to proxy the long term trend. You can even apply a moving average at each end of this range to generate a 'dynamic long term trend zone' (Note: this is the dark green zone in each of the proceeding charts). Quite often, if the price experiences a pullback into this zone, it tends to stabilise, and it may even bounce. The dynamic long term trend zone is therefore a key area at which to spot buy the dip trading opportunities. Learn more about how to
Use moving averages to spot trading signals.
Step 2. Look for key static support levels
As indicated above, the dynamic long term trend zone often acts as an area of support for a stock's price in a correction. This means it is an area where demand potentially returns to the market for a stock and/or its supply dissipates. Other important areas of support are 'static' (i.e., they are 'static' because unlike moving averages they don't move!). Key static support levels include previous well defined support zones and previous well defined resistance zones. Learn more about
How to spot support and resistance on a stock chart.
When dynamic and static support occur at the same point, the chances of a successful buy the dip trade increases. If dynamic and static support are the 'where' to buy, the 'when' to buy comes from the next two steps.
Step 3. Look for a resumption of positive price action
'Price action' refers to the peaks and troughs made by price fluctuations. A peak is the highest point between a short term uptrend (a period of subsequent higher highs and higher lows), and a short term downtrend (a period of subsequent lower highs and lower lows). A trough is just the opposite. They're easy enough to spot on a chart, a peak resembles the letter 'A', and points upwards, whilst a trough resembles the letter 'V' and points downwards.
Typically in a correction, the price will be falling back towards the dynamic long term trend zone in a series of lower peaks and lower troughs. It's best to wait until you observe two higher troughs (preferably within or just above dynamic and static support), followed by a movement above the peak which separates the two higher troughs. This indicates that demand has returned to the market for a stock, and/or that its supply is dissipating.
Step 4. Look for demand resumption Japanese Candlesticks
The first three factors we've discussed; dynamic long term support, static support, and price action, combine to provide you with a broader picture of whether demand is returning to the market for a security, and also if that demand is once again exceeding its supply. Japanese candlesticks can also assist us in identifying the broader demand-supply environment, however they are particularly useful as short term discrete entry triggers. Those who require a grounding in Japanese Candlestick techniques should read this article before continuing their study of this strategy:
Use Japanese Candlesticks to spot trading signals.
Before attempting to buy the dip, we should observe the occurrence of a 'reversal pattern' that consists of Japanese Candlesticks with long lower shadows, and that is often followed by a long white-bodied candle. The long-lower-shadow candles indicate supply-side exhaustion. This is often caused by a combination of the following factors: panicked traders losing all hope and selling out; the triggering stop losses into a thin market; or leveraged traders getting tipped out of their positions due to margin calls and liquidations. The shadows demonstrate that despite the frenzied selling, there was ample demand in the system at the lows to soak up all of the desperate supply, and to also push prices back towards the high of session by the close. The long white-bodied candle indicates that supply has now been completely exhausted, that demand remains in the system, and that traders are scrambling to get back into long-side positions.
It's good to know this demand is in the system, potentially supporting any trade entry you may make. Indeed, if we have observed all four of the buy the dip factors, we now have a significantly increased chance of a successful trade. It's certainly a better strategy than simply buying something because it appears to have 'gone down a lot'!
Buy the dip & risk management
No technical analysis system (or any system for that matter) is foolproof. So, it is a good idea to use some form of risk management with your trading. This typically includes a position sizing and an exit strategy. Because we are generally buying after some degree of weakness in the market there are elevated risks associated with any buy the dip oriented approach. For this reason, you might want to consider allocating only part of your intended investment at the buy the dip entry point, with the remainder to be added only when the price breaks to new highs.
As far as an exit strategy is concerned, one of the key benefits of using the methodology described here, is that you can generally set a stop loss relatively closely underneath major support. This is because buy the dip entries tend to occur within close proximity to dynamic long term support zone and other key static support levels. If the price was to trade below these levels, the long term uptrend is likely irreparably damaged, and therefore why would you want to be in a long trade anyway? It's probably time to get out.
 Note: whilst we have used stock-based examples in this post, this 4-Step buy the dip approach can be applied to other markets such as futures, foreign exchange, and cryptocurrency.
Any opinions, news, research, analyses, prices or other information contained on this website is provided as general market commentary and does not constitute investment advice. ThinkMarkets will not accept liability for any loss or damage including, without limitation, to any loss of profit which may arise directly or indirectly from use of or reliance on such information.

Learn and earn more today.
Visit our Education Center