CFDs are complex instruments and come with a high risk of losing money rapidly due to leverage. 77% of retail investor accounts lose money when trading CFDs with this provider.
You should consider whether you understand how CFDs work and whether you can afford to take the high risk of losing your money.

Learn To Trade
 
Indicators & Chart Patterns

Deepen your knowledge of technical analysis indicators and hone your skills as a trader.

Find your detailed guides here
Trading Glossary

From beginners to experts, all traders need to know a wide range of technical terms. Let us be your guide.

Learn more
Knowledge Base

No matter your experience level, download our free trading guides and develop your skills.

Learn more
Learn To Trade

Trade smarter: boost your skills with our training resources.

Create a live account
Market Analysis
 
Market News

All the latest market news, with regular insights and analysis from our in-house experts

Learn more
Economic Calendar

Make sure you are ahead of every market move with our constantly updated economic calendar.

Learn more
Technical Analysis

Harness past market data to forecast price direction and anticipate market moves.

Learn more
Market Analysis

Harness the market intelligence you need to build your trading strategies.

Create a live account
Partnership
 
Affiliate Programme

Grow your business and get rewarded. Find out more about our Affiliate Programme today.

Learn more
White Label

We supply everything you need to create your own brand in the Forex industry.

Learn more
Regional Representatives

Partner with ThinkMarkets today to access full consulting services, promotional materials and your own budgets.

Learn more
Partnership

Plug into the next-gen platforms and the trades your clients want.

Partner Portal
About ThinkMarkets
 
Sponsorships

Check out our sponsorships with global institutions and athletes, built on shared values of excellence.

Learn more
About Us

Find out more about ThinkMarkets, an established, multi-award winning global broker you can trust.

Learn more
Careers

Discover a range of rewarding career possibilities across the globe

Apply now
Security of Funds

Security of your funds is our number one priority. We safeguard our Client funds in top tier banks.

Learn more
ThinkMarkets News

Keep up to date with our latest company news and announcements

Learn more
Trading Infrastructure

When it comes to the speed we execute your trades, no expense is spared. Find out more.

Learn more
Contact Us

Our multilingual support team is here for you 24/7.

Learn more
About ThinkMarkets

Global presence, local expertise - find out what sets us apart.

Create a live account
Log in Create account

How to Use the Stochastic Oscillator

One of the most basic and perhaps oldest indicators used by technical analysts is the stochastic oscillator. The stochastic oscillator is an indicator that measures momentum and the strength of a trend. Essentially, its job is to analyze price movement and show how strong the price move is. 


The indicator measures the momentum of price, and also shows a slowing of momentum as the momentum of a financial instrument needs to slow down before changing direction. This addresses a weakness in retail trading, the fact that far too few traders pay attention to the importance of the rate of change. 


The stochastic oscillator is one of the more common indicators, and it’s one that you will see in a lot of analysis. However, like any other indicator it is simply a tool that you will be using to navigate through the Forex markets, and like any other tool it is needed to be used in the proper settings and situations. 

How to add the stochastic oscillator to Metatrader charts

Adding the stochastic oscillator to the Metatrader platform is very easy. By clicking on the Insert menu, you can pull down the list and click on Indicators, followed by Oscillators, and then Stochastic Oscillator. It's a common indicator, and as such it's built into the platform and there is no need to download from anywhere else.


Adding the Stochastic Oscillator to the Metatrader platform


The settings dialog box will pop up, and there are multiple parameters that you can change. The %K period and the %D period settings are available. The %K should be thought of as the slow value of the stochastic indicator and the %D should be thought of as the fast value of the stochastic indicator. It uses a couple of moving averages to measure the overall momentum.

Why does momentum matter?

Think back to your mathematics studies. One of the biggest influences in calculus is the absolute rate of change. The idea is that if the market is in an uptrend, but if the momentum starts to slow down, it can suggest that the market is running out of steam and, therefore, could be ripe for a reversal. In this sense, it can suggest whether or not the market is going to continue, or if it might be over-extended in one direction or the other, and other words overbought or oversold.

Using the indicator to make decisions

The stochastic oscillator has a multitude of uses when it comes to trading Forex. We have already mentioned the most obvious use for the stochastic oscillator: the idea of identifying overbought or oversold conditions. In this scenario, the stochastic oscillator is best used in a range bound market, as it can tell you when to buy and sell in a relatively well defined situation.

When you look at the stochastic oscillator window at the bottom of the chart, you see the two moving averages going back and forth in an up and down pattern. You will notice that there are two lines in the indicator window including the 80 and the 20 level.


The area above the 80 level is considered to be overbought, while the area below the 20 level is considered to be oversold.Furthermore, you need to see the moving averages inside the stochastic oscillator to cross in the overbought or oversold areas in order to get a reversal signal. Anything between the two levels is essentially ignored in this scenario.

The Stochastic Oscillator on a chart


Looking at the chart, you can see that the stochastic oscillator had several moves back and forth between the 80 and the 20 levels. However, there are only a couple of areas where the indicator either broke into the overbought area or the oversold area and had a cross. You need both of these things to happen in order for it to fire off a signal.


In the graphic below, you can see that the signals fired off are color-coded by the arrows, with the red showing an overbought condition and a potential selling opportunity, and the blue showing potential buying opportunities in an oversold condition.


It should be noted that using the stochastic oscillator in this way is much more reliable when in a sideways market, preferably between significant support and resistance. This makes the stochastic oscillator truly important, because statistically speaking markets are in some type of consolidation or sideways action more than 70% of the time. In other words, it’s much more common to be in this environment than it is to be out of it. 

Measuring Divergence

Another way that people use the stochastic oscillator in Forex trading is to measure for divergence. The idea is that as with any oscillator, you could see momentum going in a different direction than the overall price. As an example, the momentum could be rising while price is falling or vice versa. If you are in a scenario where price is rising but the momentum is slowing, that means that there is less aggression to the upside and therefore less demand, even as prices press higher. This can be a sign that potential trouble is on its way. 


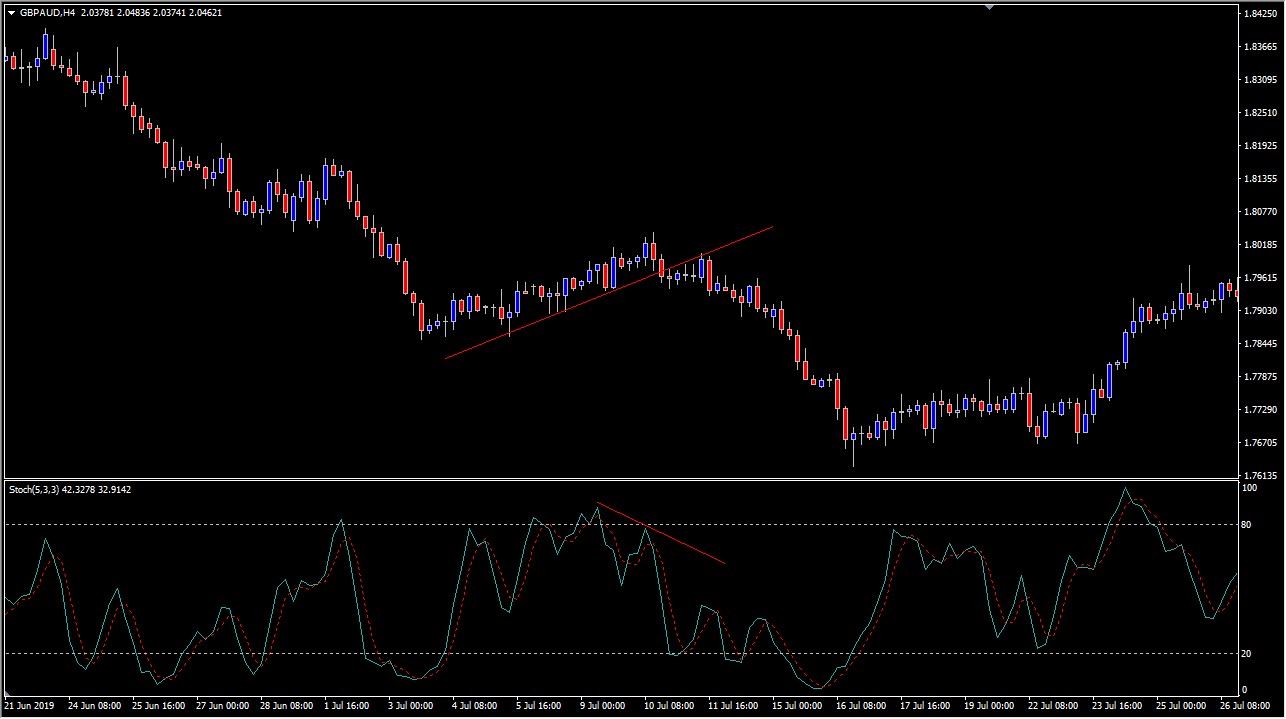
Take a look at the chart just below. You can see that there is a clear uptrend line on the four hour chart for the GBP/AUD pair. As the price was rising, though, notice that the stochastic oscillator made a lower high, which is the opposite of an uptrend. This suggests that the rate of change is slowing down, therefore one would have to be a bit suspicious about the efficacy of the move. 


After all, if there is less momentum, it suggests that there are fewer fresh orders coming in to push the market to the upside. Ultimately, you can see that shortly after the diversions with the lower high in the stochastic oscillator, the market broke down below the trend line and then eventually fell from those levels. Divergence can be found in several indicators, essentially the oscillator family. Because of this, using your divergence spotting skills can work in multiple other oscillators as well, as they all essentially work the same in this scenario.


divergence in the stochastic oscillator


Any opinions, news, research, analyses, prices or other information contained on this website is provided as general market commentary and does not constitute investment advice. ThinkMarkets will not accept liability for any loss or damage including, without limitation, to any loss of profit which may arise directly or indirectly from use of or reliance on such information.
Back to top