LATAM
LATAM
Menu
Mercados
Plataformas
Aprendizaje
Empresa
Socios
Soporte
Iniciar sesión
Registrarse
Artículos (40)
Todos
Principiantes
Avanzado
Forex
Technical analysis
¿Qué es el análisis técnico en el trading?
4 min read
Principiantes
Forex
Technical analysis
Trading 101: apalancamiento dinámico – qué es, cómo funciona y más
4 min read
Principiantes
Forex
Tamaño de posición: la guía definitiva para traders de forex
12 min read
Todos
Forex
¿Qué es un pip en el trading de forex?
6 min read
Principiantes
Forex
Estrategias Populares de Trading de Forex para Traders Exitosos
4 min read
Principiantes
Forex
Cómo entender las señales de trading de forex
4 min read
Principiantes
Forex
Indicators and patterns
The Simple Moving Average (SMA) indicator
6 min read
Principiantes
Forex
Indicators and patterns
Triple bottom candlestick pattern trading strategy
6 min read
Principiantes
Forex
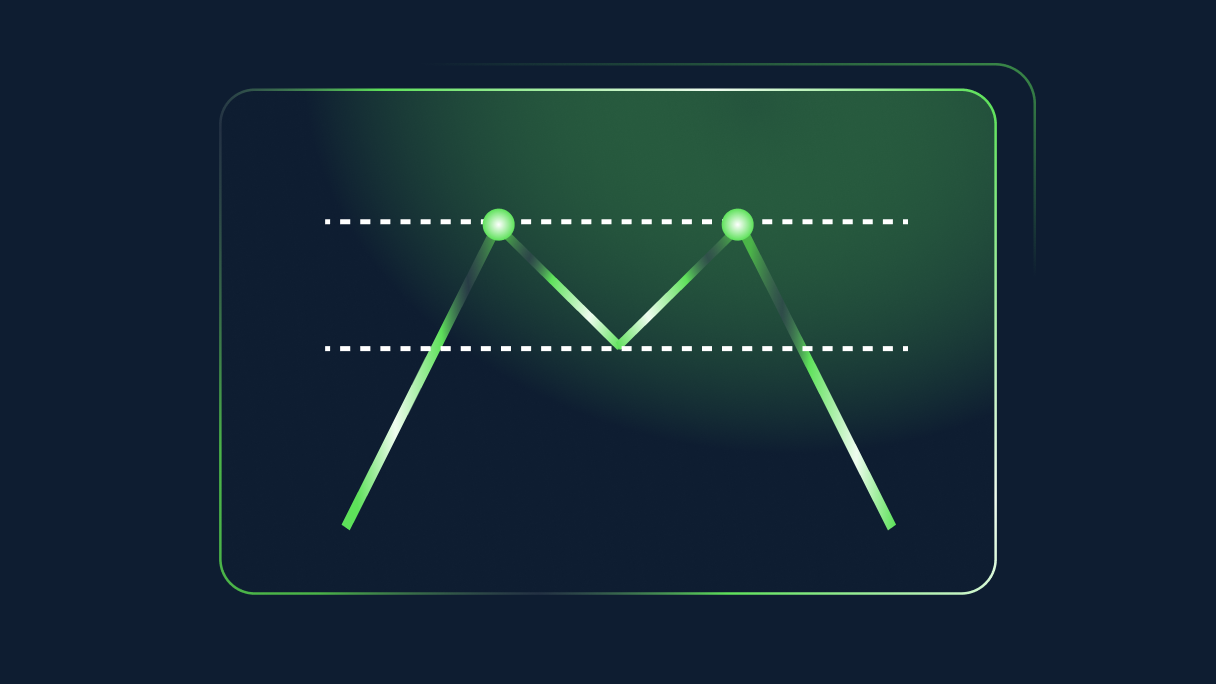
Indicators and patterns
The Double Top Reversal Pattern
6 min read
Principiantes
Forex
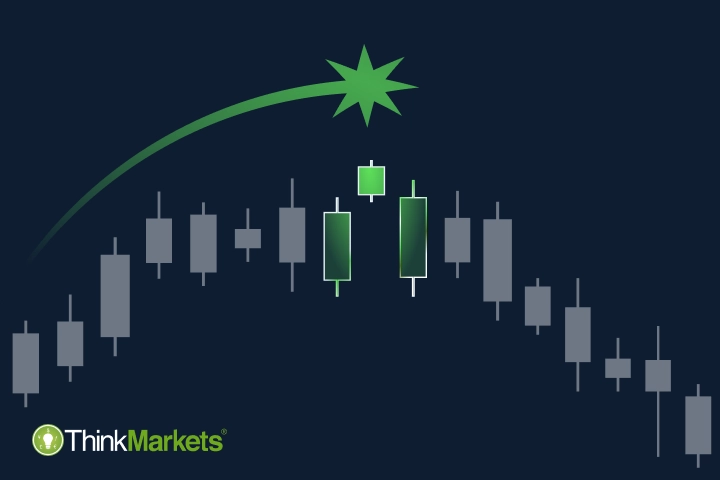
Indicators and patterns
Trading The Morning and Evening Star Candlestick Patterns
6 Lectura mínima
Principiantes
Forex
Indicators and patterns
Technical indicators: beginner’s guide
6 min read
Principiantes
Forex
Indicators and patterns
The ascending triangle candlestick chart pattern
6 min read
Principiantes
 LATAM
LATAM