Artículos (27)

The Simple Moving Average (SMA) indicator
<p dir="ltr">The <strong>Simple Moving Average </strong>(SMA) indicator is one of the most straightforward measures available to traders. <br /> </p> <p dir="ltr">It is a trend-defining indicator that isn’t necessarily made to be used in range-bound markets, but they can show you when that condition is approaching, thereby keeping you out of the market or having you switch the tools that you use.</p> <p>What is the simple moving average indicator?</p> <p dir="ltr">The simple moving average indicator is a measure of the average price over a certain amount of <a href="/latam/trading-academy/indicators-and-patterns/japanese-candlesticks/"><u>candlesticks</u></a>. <br /> </p> <p dir="ltr">For example, if the 20-day simple moving average indicator is added to a chart, it will calculate the average price over the previous 20 days. The indicator updates itself at every candlestick and creates a line that goes up and down on the chart, showing the overall flow of where the market is going. <br /> </p> <p dir="ltr">There are other versions of moving average indicators, but the simple moving average indicator is the easiest to use. You simply measure the average closing price of a certain amount of candles, divided by that many candles. <br /> </p> <p dir="ltr">This gives you the average price, and as time goes on the various levels are connected by a line, giving traders a clear view as to whether the average price is rising, falling, or simply going sideways over a certain amount of time.<br /> </p> <p dir="ltr">It can be used on any timeframe, but there are some that do tend to be used more than others. </p> <p>How to add a simple moving average indicator to MetaTrader</p> <p dir="ltr">To add a simple moving average indicator to <u>your charts</u>, click on the '<strong>Insert</strong>' menu, choose 'Indicators', and then select 'Trend', where you will find '<strong>Moving Average</strong>' on that menu. A dialog box will pop up with the title '<strong>Moving average</strong>', giving you several options. <br /> </p> <p dir="ltr">The '<strong>Period</strong>' box allows you to select how many candlesticks you wish to calculate the average price of, and then the '<strong>MA method</strong>' allows you to select which type of moving average you want to apply. In this case, you would obviously select '<strong>Simple</strong>.' You can also choose to apply to either the <em>close</em>, <em>high</em>, <em>low</em>, or <em>open</em>, but 99% of what you will see involves the close.<br /> <br /> <img alt="adding the Simple Moving Average indicator" src="https://k13-dev.thinkmarkets.com/TMXWebsite/media/TMXWebsite/adding-SMA.jpg" /></p> <p>How the simple moving average indicator is typically used</p> <p dir="ltr">The most common way this indicator is used is to determine the overall trend. Notice the red line that is sloping lower on the chart below. It shows that we are clearly grinding lower over the course of the last several days on the hourly chart in the AUD/NZD pair.<br /> </p> <p dir="ltr">The slope going lower is a function of the average price drifting lower and lower over time. Notice how at the beginning of the chart the 20 SMA was rising, but then the price broke down through the moving average to show that something had changed.<br /> </p> <p dir="ltr">Shortly after that, you’ll notice that a majority of the candlesticks were below the 20 SMA, showing that price had changed from rising over the course of the previous 20 hours to falling. <br /> </p> <p dir="ltr">This shows an overall trend change, and it gives you an idea as to whether you should be long or short a currency pair. In this case, it’s obvious that selling the Australian dollar against the New Zealand dollar was the right way to go. The moving average shows you just how right it was.<br /> <br /> <!--%3Cmeta%20charset%3D%22utf-8%22%20%2F%3E--><img alt="ALT: example of a 20 SMA trading strategy" src="https://k13-dev.thinkmarkets.com/TMXWebsite/media/TMXWebsite/20-SMA-strategy.jpg" /></p> <br /> <!--%3Cmeta%20charset%3D%22utf-8%22%20%2F%3E--> <p dir="ltr">For example, at the blue arrow you can see that the market was clearly in an uptrend and pulled back towards the 50 day EMA where we saw the market bounce significantly from that level and continue to go higher. </p> <p dir="ltr"><br /> One way that you could have looked at this is that the 'hammer' that had formed on the daily chart right at the 50 day simple moving average was a sign that buyers were finding dynamic support there. Later on, you can see that the market broke down below the 50-day simple moving average indicator, but then bounced back towards it where the red arrow shows a selling opportunity based upon a massive bearish candlestick. </p> <p dir="ltr"><br /> Later on, it tested the general vicinity of the 50-day simple moving average indicator three times where it sold off each time it got too close to it. </p> <p dir="ltr"><br /> At the very end of the chart the market closed well above the 50 day EMA and then started to rocket to the upside showing the 50 day EMA starting to slope higher, confirming than that the trend has obviously changed for the upside in favor of the Euro instead of sloping lower in favor the British pound like it had been previously.<br /> </p> <p dir="ltr">Another use for simple moving average indicators is to look for 'moving average crossovers'. This typically is used for 'buy and sell signals' and some traders even go so far as to always stay in the marketplace based upon how the signal is showing, either bullish or bearish. That being said, the simplest explanation is that you take a faster moving SMA and plot it with a slower moving SMA on a chart. In this example, we will use the CAD/CHF daily chart.</p> <p dir="ltr"><br /> On the chart, there is the red 20 day simple moving average, and the white 50 day simple moving average. </p> <p dir="ltr"><br /> In a 'moving average crossover system', the idea is that as the quicker moving average rises above the slower one, shorter-term traders are starting to come in and momentum is moving to the upside. At that point, traders will buy the market. </p> <p dir="ltr"><br /> On the other hand, when the faster moving average dips below the longer-term moving average, then it shows that short-term traders are starting to push momentum to the downside, and it becomes a sell signal. In this scenario, you buy when the indicator of the shorter time frame breaks higher, and you sell or find yourself short when the lower timeframe indicator breaks underneath. </p> <p dir="ltr"><br /> When you look at this chart, you can see the inherent problem with using this system without any type of filter. There would have been five potential losses before the market finally broke in your direction and would have had you selling into a major breakdown. </p> <p dir="ltr"><br /> One simple filter is to look at the longer-term simple moving average indicator, and what the slope is. For example, in this chart you can see that we were relatively flat for most of this, and that may have kept you out of the market as it shows that we weren’t really trending. </p> <p dir="ltr"><br /> On the final crossover, and the one that the market is currently trading, you can see that <strong>the longer-term 50-day EMA started to slope lower</strong>, and the two moving averages started to spread out, showing that there was a real divergence between the two time frames, and that momentum was picking up. </p> <p dir="ltr"><br /> In the end, quite often the simple moving average indicator is used with something along the lines of an oscillator in order to determine momentum, and possible diversions. There are other indicators people will use with it, but it seems to be oscillators are by far the most common.<br /> </p> <p>Some common simple moving averages<br /> </p> While there is no 'magic bullet', there are some common ones that are popular:<br /> <ul> <li>10-SMA, for fast moving short-term trades</li> <li>20-SMA, for slightly longer term momentum on short-term trades</li> <li>50-day SMA, which represents just a bit underneath a quarter</li> <li>100-day SMA, which represents half a year</li> <li>200-day SMA, which represents roughly one year of trading based upon trading hours</li> </ul>

Triple bottom candlestick pattern trading strategy
<p>The <strong>triple bottom </strong>is a bullish reversal pattern that occurs at the end of a downtrend. This <a href="/en/trading-academy/forex/japanese-candlesticks">candlestick pattern</a> suggests an impending change in the trend direction after the sellers failed to break the support in three consecutive attempts. <br /> <br /> In this article, we look at the structure of the triple bottom chart pattern, what the market tells us through this formation. We are also sharing tips on the simple triple bottom trading strategy that will help you make profits. </p> <h2>What the pattern tells us </h2> <p>As the name suggests, the triple bottom consists of the three consecutive lows printed at the same, or near the same level. For this chart pattern to occur and be effective the price action has to trade in a clear downtrend.<br /> <br /> The sellers push the price lower to test the horizontal support for the first time, however, they meet a strong resistance from the side of the buyers. The price action rebounds higher as the sellers take a breather before the second attempt gets going. <br /> <br /> The outcome of the second attempt is the same, which now makes this level extremely important as the sellers, who are still in control of the price action, have now failed for the second time. </p> <p> </p> <p><img alt="a triple bottom chart pattern illustration" src="/TMXWebsite/media/TMXWebsite/Triple-Bottom-image-1.jpg" /></p> <p>In general, the price should return to around the same levels as during the previous rebound. Given that the downtrend is very strong, the sellers push the price action lower again to try and break the buyers’ resolve, but without much success again. <br /> <br /> Finally, they give up and the buyers assume control of the price action, this time extending the rebound much higher and eventually erasing most, or all, of the previous losses.<br /> <br /> If you look at the illustration above, the blue line represents the horizontal support that rejected the bears’ attempt to extend the downtrend. Up higher we have a neckline (the red line) which connects the highs of two rebounds. <br /> <br /> The neckline is arguably the most important element of the triple bottom pattern as its break to the upside activates the pattern and then helps us determine the stop loss and take profit. <strong>Hence, three mandatory features of the triple bottom chart pattern are:</strong><br /> </p> <ul> <li>A downtrend - the security’s price must trade lower;</li> <li>Horizontal support - A trend line connecting three roughly equally lows;</li> <li>A neckline - whose break signals the activation of the formation</li> </ul> <h2>Significance and limitations</h2> <p dir="ltr">The triple bottom chart pattern is a rare, but<em> extremely effective </em>reversal pattern. It’s rare since the successive creation of three equal lows doesn’t happen quite often. Therefore, the double bottom is a more frequent chart pattern as it requires one low less to happen.. </p> <p dir="ltr">On the other hand, its scarcity makes it a very strong and powerful pattern. The sellers are extremely exhausted after three consecutive attempts to break lower, which makes them exposed to a rally as buyers feel much more confident after defending a strong horizontal support.</p> <br /> The triple bottom formation doesn’t have any apparent weaknesses. Actually, its biggest limitation is that it doesn't occur quite often, otherwise<em> it would be the strongest reversal pattern out there</em>. <h2>Spotting the triple bottom pattern</h2> <p>Due to its rarity, the triple bottom is quite <em>easy to spot</em>. The first thing you should look for is <strong>a downtrend, </strong>i.e. a series of lower lows and lower highs. Three consecutive failed attempts to break lower usually stick out on the chart (see the chart below). <br /> <br /> As outlined above, the double bottom is a more frequent chart pattern. We advise you to simply mark two bottoms on a chart, and if the price action breaks above the neckline after the second bottom - you should continue by trading the double bottom. <br /> <br /> If, on the other hand, the sellers return to try and break the support in a third attempt, you should monitor the price action closely to see if the third try will end up in a failure. In that case, <em>a break of the neckline should activate the triple bottom chart pattern</em>.</p> <p> </p> <p><img alt="USD/JPY H4 chart - Spotting the triple bottom pattern" src="/TMXWebsite/media/TMXWebsite/Triple-Bottom-image-2.jpg" /></p> <p> </p> <p>In the chart above, we see USD/JPY on a daily chart that is moving lower. The bears then register three attempts to break below the horizontal support around the $108.50 mark, however without much success at all. If you look more closely, you will count at least 8 touches of the $108.50 handle, while we highlighted three lowest prints on a chart.</p> <h2>Trading the triple bottom formation</h2> <p>As outlined earlier, the triple bottom is a bullish reversal chart pattern. Hence, we are looking for clues when the market is ready to reverse its course. The signal that we are looking for <strong>is a break of the neckline</strong>. <br /> <br /> Looking at the chart above, a 4-hour chart, we see a strong breakout that launches the price action higher. As this breakout candle closes much higher, leaving us without an opportunity to dip into the market, we move to a 1-hour chart (below) to identify our entry.</p> <p> </p> <p><img alt="USD/JPY H1 chart - Trading the triple bottom pattern" src="/TMXWebsite/media/TMXWebsite/Triple-Bottom-image-3.jpg" /></p> <p> </p> <p>As with every chart pattern that involves a breakout, we have two opportunities for an entry - after the breakout candle closes above the neck line or waiting for a test. In this case, the second option is not available as the price action never returned to the “crime scene”. This was expected to a certain degree, given how explosive the breakout was. <br /> <br /> The power behind the breakout tells us that there is a high likelihood of the market extending higher. Hence, we set our entry as soon as the breakout candle closes above the neckline. The vertical blue, which measures the distance between the support and neckline, will help us determine the take profit. <br /> <br /> You just copy-paste the line, starting from the breakout point, with the other end signalling a level, where we should consider taking profits off the table. Any move below the neckline, after the price action closed above it, invalidates the pattern. Hence, this is where our stop loss is located. <br /> <br /> Given the power behind the breakout, we are not surprised to see that, during the next hourly trading session, our profit-taking level has been activated, making us 33 pips richer. On the other hand, we risked 17 pips, which translates into 1:2 risk-return ratio, a standard profitable setting.</p>

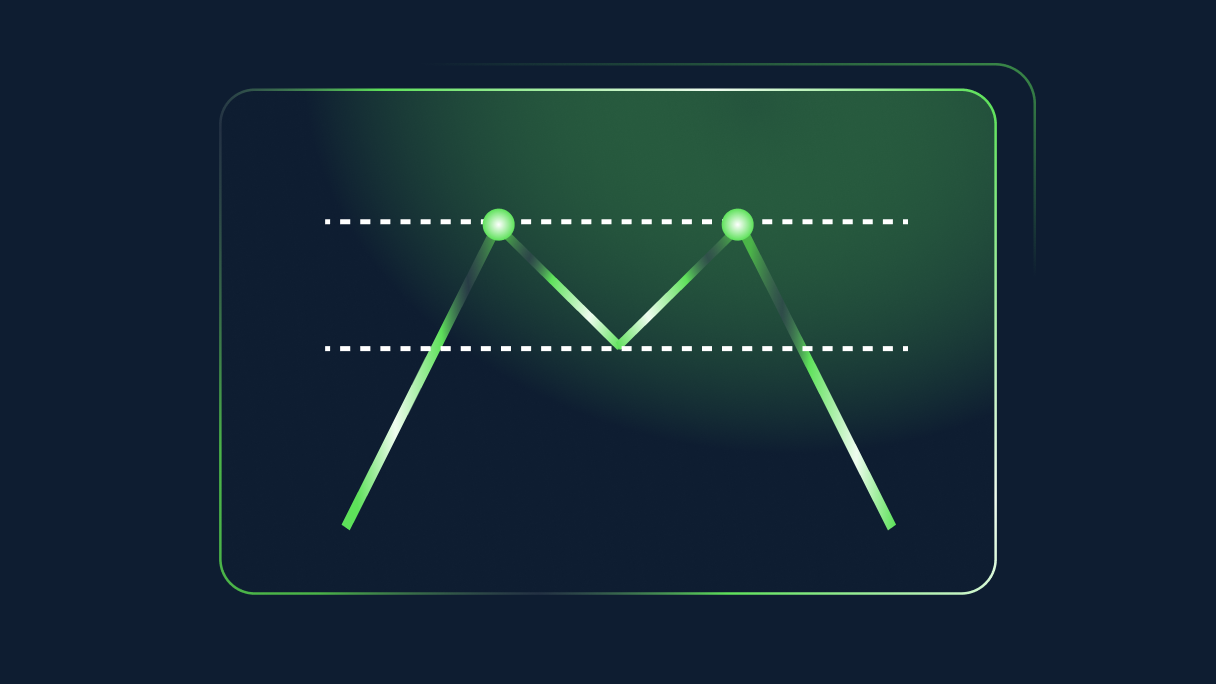
The Double Top Reversal Pattern
<p>The <strong>double top pattern</strong> is a <em>bearish reversal pattern</em> that can be observed at the top of an uptrend and signals an impending reversal. Unlike the double bottom formation that looks like the letter “W”, the double top chart pattern resembles the letter “M”, due to the two equal highs. <br /> <br /> In this blog post, we will describe how to correctly draw the double top, what its structure tells us, and how to make profit trading the double top pattern by sharing a simple trading strategy.</p> <h2>What the Double Top pattern tells us</h2> <p>The double top chart pattern is a bearish reversal pattern. As such, it can only occur in an uptrend as the buyers are successful in pushing the price action higher by creating a series of the higher highs and higher lows. </p> <p><br /> Their inability to extend this bullish series initiates the creation of the double top pattern as the second peak is not registered as a higher high, but rather as an equal high. This weakness is then used by the sellers to push the price action lower and erase previous gains. <br /> <br /> <img alt="" src="/TMXWebsite/media/TMXWebsite/Double-top-Image1.jpg" /></p> <p>In essence, there are three key elements of the double top chart pattern:<br /> </p> <ul> <li><strong>Uptrend</strong> - The price action must trade in an uptrend for the double top to make sense. Remember, this is a reversal pattern. </li> <li><strong>Two equal highs</strong> - Getting two exact same highs is hard to imagine. As long as we can see that the horizontal resistance that capped the earlier move higher stops the buyers once again, we register this as two equal highs.</li> <li><strong>Neckline</strong> - The lowest point of a pullback following the first peak is called the “neckline”. A simple horizontal trend line is drawn through the lowest point of the pullback. </li> </ul> <p> </p> <p>The double top formation is active once the price action breaks below the neckline. The market moves from creating the higher highs and higher lows to the lower lows, as the break of the neckline brings us lower prices compared to the lowest point of the initial pullback (the neckline). <br /> <br /> Ideally, a certain period of time should pass in between the two tops. In case the second peak occurs almost immediately after the first peak, with a minor pullback, there is a strong likelihood that the buyers will break above the first peak. In this case, <strong>the double top becomes a continuation pattern. </strong><br /> </p> <p>For this reason, the most effective double top patterns are those with a certain amount of time in between two lows. It is also absolutely crucial to wait for a break of the neckline before entering a market, to avoid situations where the double top formation becomes the continuation pattern.</p> <h2>Strengths and weaknesses</h2> Similar to the double bottom formation, a double top pattern is one of the strongest reversal patterns out there. One of its greatest strengths is its efficiency and high likelihood of being successful in predicting a change in the trend direction. <br /> <br /> The neckline existence equips the pattern with a clearly defined level to play against. The neckline marks the risk and it helps determine the take profit once the pattern is activated. <br /> <br /> On the other hand, the biggest weakness of the double top pattern is that you are countering what is, to that point, a very powerful trend. For this reason, there is always a chance that this scenario could eventually result in a continuation of the bullish trend. Therefore, a trader should always consult other technical indicators before entering the market. <h2>Spotting the double top pattern</h2> <p>The double top patterns are not so common in trading. However, once correctly identified, they become a powerful tool in the hands of a trader. A USD/CHF daily chart below gives us a great example of how to successfully counter the strong bullish trend. </p> <p><br /> An initial bullish move results in enormous gains of more than 500 pips for the buyers. The price action moves higher in an almost vertical manner, without any meaningful pullback. Following the first peak, the price action rotates lower in the first more significant pullback.<br /> <br /> <img alt="" src="/TMXWebsite/media/TMXWebsite/Double-top-Image-2.jpg" /><br /> <br /> The buyers are then able to regroup and organise another assault at the same horizontal resistance level around the $1.0050 handle. However, they fail again at the same resistance, which prompts a deeper pullback.</p> <h2>Trading the Double Top pattern</h2> <p>The basic principles for trading the double top pattern are the same as for the double bottom pattern. Once again, the pattern is only activated once there is a clean break and a close below the neckline, preferably on a daily basis. This way, you protect yourself against the failed breakdowns, when the price action briefly trades below the neck line without actually breaking it. <br /> <br /> Once the USD/CHF sellers bring the price action to the point where the previous pullback lower ended, their goal now is to create a lower low and initiate a new bearish trend. They become successful in their mission as there is a break of the neckline very quickly. </p> <p><img alt="" src="/TMXWebsite/media/TMXWebsite/Double-top-Image-3.jpg" /><br /> <br /> </p> <p>Similar to the head and shoulders reversal pattern, the double top offers two types of entry. First is a more aggressive entry, as you enter the market as soon as the candle closes below the neckline. <br /> <br /> The second route is based on a more conservative approach as traders wait for the price action to return higher to retest the broken neckline - a throwback - before entering the market at a higher (better price). <br /> <br /> This approach offers <strong>a better risk-reward ratio,</strong> but the chance of you missing out on a trade is also higher as the move higher may never happen. On the other hand, the first option offers you a mandatory ride in a trend, however, the entry may be quite lower.</p> <p> </p> <p>In this case, USD/CHF never offered us a second choice as the price action flushed lower. There was a minor rebound higher, but it never reached the broken neckline. In this case, our entry is at $0.9760, a level where the USD/CHF closed below the neckline for the first time. <br /> <br /> The stop-loss should be placed above the neckline, allowing some space for a potential failed breakout, if the price action rebounds to retest the neckline. Thus, we put a stop-loss at $0.9820, around 30 pips above the broken neckline. Please remember that any move and close above the neckline invalidates the activated double top pattern.</p> <p><br /> The take profit is calculated in the same manner as it is the case with the double bottom pattern i.e. measuring the distance between the resistance (double top) and the neckline. The same trend line is then copy-pasted from the point where the breakout occurred, with an end point of the trend line being our take profit. In our case, the trend line ends around $0.9530.<br /> <br /> The USD/CHF pulls back all the way to $0.9540, around 10 pips from our take profit. As with a stop loss, it is always advised to leave some room for the take profit, as some traders may exit their trades earlier. Ultimately, this trade banked us 220 pips while we risked only 30 pips.</p>

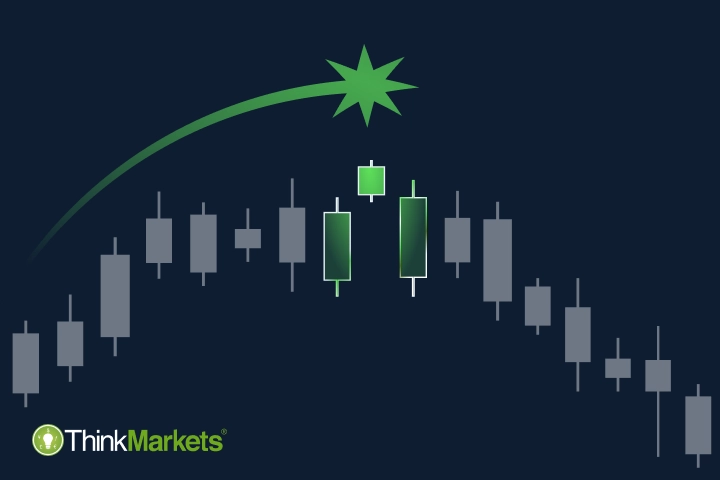
Trading The Morning and Evening Star Candlestick Patterns
<div dir="ltr"> <p dir="ltr">It is believed that there are more than 100 patterns based on Japanese candlesticks. We divide them into various categories, such as bullish vs. bearish, reversal vs. continuation, as well as simple and more complex formations.</p> <p dir="ltr">Both the morning and evening star patterns are considered to be more complex formations, mostly since they are based on three successive candles. As such, they occur more rarely than other patterns, especially the single-candle formations. <br /> </p> <h2 dir="ltr">Structures</h2> <p dir="ltr"><br /> The morning star is a bullish reversal pattern that occurs at the bottom of a downtrend. As other candlestick patterns, it only signals a potential reversal, an idea which should ideally be confirmed with other indicators</p> </div> <h2>Four elements to consider for a morning star formation</h2> <ol> <li>A downtrend must be in place since a morning star is a bullish reversal pattern</li> <li>The first candle should be a bearish candle, preferably longer</li> <li>The second candle should be indecisive as the bulls and bears start to balance out over the session</li> <li>The third candle should be a strong bullish candle, which practically all but confirms the reversal</li> </ol> <p><br /> <img alt="morning star candlestick pattern" src="https://k13-dev.thinkmarkets.com/TMXWebsite/media/TMXWebsite/morning-star-pic-1.jpg" /><br /> <br /> </p> <p dir="ltr">Although some analysts prefer to have a gap down, it is extremely rare to have gaps in Forex. Thus, many analysts argue that as long as these four conditions are met, it is a valid morning star pattern. <br /> <br /> It is important to note here that the second candle is the most important one. It can be bearish or bullish, as the focus is on indecisiveness and uncertain outcome as to which out of two sides will come out on top. <br /> </p> <h2>The evening star formation</h2> The evening star, on the other hand, has the same structure and it is also a reversal pattern. Unlike the morning star, the evening star occurs at the top of an uptrend and it signals a potential change in the price direction. <p dir="ltr"><img alt="evening star candlestick pattern" src="https://k13-dev.thinkmarkets.com/TMXWebsite/media/TMXWebsite/evening-star-pic-2.jpg" /></p> <!--%3Cmeta%20charset%3D%22utf-8%22%20%2F%3E--> <p dir="ltr">All four conditions present in the morning star structure are valid here as well. Near the end of an uptrend, the first candle should be long and bullish, the second one should be at the top and signal indecision (green or red), while the third and final candle signals a reversal is starting, as the buyers are no longer in control over the price action. </p> <p dir="ltr">You can use the historic price action and analyse the structure and behaviour of the morning and evening star patterns on the MetaTrader 5 trading platform, which you can access <a href="/latam/metatrader5"><u>here</u></a>.</p> <h2>Trading the morning star candlestick pattern</h2> <p dir="ltr">As said earlier, the occurrence of a morning star pattern is not as frequent as those of a single-candle formation. They are harder to spot, aside from you practically needing to fulfil all four conditions before you can verify its presence. </p> <p dir="ltr">In this case, we have the AUD/USD daily chart. The price had been trading lower until the point where it created a new short-term low. Prior to this candle, there is a long bearish candle that signals a strong downtrend.</p> <br /> <img alt="how to trade an evening star candlestick formation" src="https://k13-dev.thinkmarkets.com/TMXWebsite/media/TMXWebsite/trading-an-evening-star-pic-3_2.jpg" /><br /> <br /> However, the sellers fail to force a close near the session’s low and the price rebounds higher to create a doji candle, which signals the indecision among the buyers and sellers. The next candle is a long bullish candle which forms the morning star pattern. We can now be almost certain that the bullish reversal is about to start taking place.

Technical indicators: beginner’s guide
<p>Technical indicators are powerful tools that complement <a href="/latam/trading-academy/technical-analysis/support-resistance/">trendlines</a> and chart patterns in technical analysis. They provide traders with a comprehensive view of price movements and potential trading opportunities in financial markets.<br /> <br /> Despite their popularity and effectiveness, many novice traders feel hesitant to use indicators due to the perceived complexity associated with the term "technical". While it's true that learning about trading indicators requires effort, dedicating time to studying and practising with them is usually beneficial and can ultimately improve your trading strategy.<br /> <br /> In this article, we will help you grasp the concept of technical indicators, understand their functionality, and explore the main types based on their functionality.</p> <h2>What are technical indicators?</h2> <p>Technical indicators are pre-made mathematical calculations that analyse an instrument’s performance to help predict its future price movements.<br /> <br /> As you probably know by now, it’s impossible to forecast financial markets’ behaviour with 100% accuracy due to their fluid nature and dependence on unpredictable factors. However, technical indicators can help you identify some tendencies and make an informed trading prediction.</p> <h2>How do technical indicators work?</h2> <p>You can apply technical indicators on your trading platform in just a couple of clicks. Most trading platforms offer a wide array of indicators, and ThinkMarkets' proprietary platform, ThinkTrader, stands out with its selection of 120+ indicators:<br /> <br /> <img alt="Technical indicators" src="/TMXWebsite/media/TMXWebsite/Technical-indicators.png" /><br /> <br /> Experienced traders often combine multiple indicators with chart patterns to gain deeper insights. However, as a beginner, it's crucial not to overload your charts with too many indicators, as it can create excessive noise and lead to conflicting signals.<br /> <br /> To start your journey with technical indicators, it's advisable to experiment with a few indicators within each group and determine which ones align with your trading style. Now, let's explore the main types of indicators that might suit your needs.</p> <h2>Types of technical indicators</h2> <p>It's worth noting that technical indicators can be categorised in various ways, and you may find the same indicator placed in different groups. This occurs because many indicators have overlapping functionalities, and the categorisation often relies on each trader's perception of the indicator's primary function.<br /> <br /> One common approach to differentiate indicators is by classifying them as either trend indicators or oscillators. While both types serve the purpose of identifying trend directions or reversals and providing buy or sell signals, they have distinct characteristics and applications. There are also other types as well below.<br /> <br /> <img alt="Types of technical indicators" src="/TMXWebsite/media/TMXWebsite/Types-of-technical-indicators.png" /></p> <h2>Trend indicators</h2> <p>In our <a href="/latam/trading-academy/technical-analysis/support-resistance/">Trendlines in technical analysis</a>: support and resistance explained article, we discussed how to draw trendlines in a price chart to identify a trend direction or potential reversal.<br /> <br /> Trend indicators work the same way. Their primary function is to identify whether the price is going to move up, down or sideways. The difference is that indicators’ lines aren’t necessarily straight, as they analyse different data, providing some additional trading insights.<br /> <br /> Some of the most popular trend indicators are:<br /> </p> <ul> <li>Simple Moving Average indicator</li> <li>Average Directional Index (ADX/DMS) indicator</li> <li>Ichimoku Cloud indicator</li> <li>Parabolic SAR indicator</li> <li>Alligator indicator</li> </ul> <p> </p> <h2>Support and resistance indicators</h2> <p>Similar to trend indicators, support and resistance indicators resemble the functionality of support and resistance levels but automatically detect them in a price chart.<br /> <br /> Here are some of the most commonly used support and resistance indicators:<br /> </p> <ul> <li>Pivot points</li> <li>Fibonacci retracement levels</li> <li>Bill Williams Fractals indicator</li> </ul> <p> </p> <h2>Volatility indicators</h2> <p>Volatility indicators can help traders identify the periods of high and low volatility of an instrument. This insight is valuable for traders because high volatility usually comes with big price swings that bring a lot of trading opportunities but also an increased risk of losses. When traders know what volatility to expect, it allows them to adjust their trading strategy according to their risk appetite.<br /> <br /> Some of the most popular volatility indicators are:<br /> </p> <ul> <li>Bollinger Bands indicator</li> <li>Average True Range (ATR) indicator</li> </ul> <p> </p> <h2>Volume indicators</h2> <p>direction of a price movement depends on how much bullish (buying) or bearish (selling) power is present in the market. If bulls overpower bears, the price moves up. In the reverse scenario, when bears outnumber bulls, the price goes down. Volume indicators help measure bullish and bearish movements to understand whether they are strong enough for the price to continue moving in the same direction or weak enough to expect a reverse.<br /> <br /> Check out these popular volume indicators:<br /> </p> <ul> <li>On-Balance Volume (OBV) indicator</li> <li>Volume Weighted Average Price (VWAP) indicator</li> <li>Chaikin Money Flow indicator</li> <li>Money Flow Index (MFI) indicator</li> </ul> <p> </p> <h2>Oscillators (Momentum indicators)</h2> <p>The second group, oscillators, works slightly differently than overlays. An oscillator is an indicator that swings between two boundaries and suggests the overbought or oversold levels of an instrument, which may indicate a trend reversal.<br /> <br /> Oscillators are not applied directly over the price chart but are usually at the bottom of it. They are also called momentum indicators because they may indicate momentum or how fast the price is moving in a particular direction.<br /> <br /> Check out these popular volume indicators:<br /> </p> <ul> <li>On-Balance Volume (OBV) indicator</li> <li>Volume Weighted Average Price (VWAP) indicator</li> <li>Chaikin Money Flow indicator</li> <li>Money Flow Index (MFI) indicator</li> </ul> <br /> <img alt="Oscillators" src="/TMXWebsite/media/TMXWebsite/Oscillators.png" /><br /> <br /> Here are some of the widely used oscillators:<br /> <ul> <li>Relative Vigor Index (RVI) indicator</li> <li>Moving Average Convergence Divergence (MACD)</li> <li>Momentum indicator</li> <li>Relative Strength Index (RSI)</li> <li>Force Index indicator</li> <li>Awesome Oscillator</li> </ul> <br /> <br /> The Bill Williams Awesome Oscillator is an oscillator that traders use to measure momentum in a Bill Williams Accelerator<br /> <ul> <li>Bill Williams Accelerator Oscillator</li> <li>Commodity Channel Index (CCI)</li> <li>DeMarker Indicator</li> <li>Gator Oscillator</li> <li>Stochastic Oscillator</li> <li>Williams Percent Range</li> </ul> <p> </p> <h2>How to choose a technical indicator</h2> <p>There are no good or bad indicators; they all provide different insights. The most important part of trading with indicators is to have a solid understanding of how they work and to be able to read the signals they provide.<br /> <br /> If you are a new trader, go through our list of indicators, study how they function and apply them using a demo account, comparing the findings. After some practice, you will have a better idea of which indicator fits your trading strategy.</p>

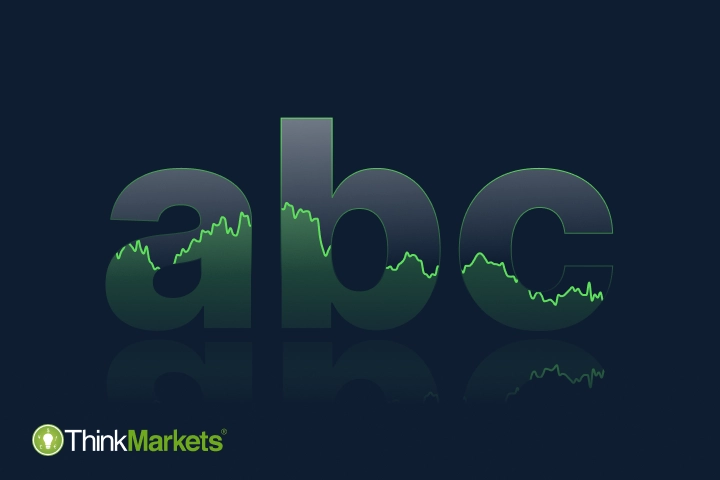
The ascending triangle candlestick chart pattern
The ascending triangle is a bullish candlestick chart pattern that occurs in a mid-trend and signals a likely continuation of the overall trend. It’s one of the most common chart patterns as it’s quite easy to form - consisting of two simple trend lines. <br /> <br /> The price action temporarily pauses the uptrend as buyers are consolidating. This pause is marked with higher lows pushing for a breakout to the upside, which then activates the pattern.<br /> <br /> In this blog post we will discuss how the ascending triangle is formed, what the message that the market sends is, and share tips on a simple but effective trading strategy based on ascending triangles. <h2>What the ascending triangle shows us</h2> <p>The ascending trend line chart pattern is a<em> bullish formation</em>. It signals that the market is consolidating after an uptrend, with the buyers still in control. The occurrence of the higher lows is pointing toward a likely breakout as the wedge narrows down.</p> <p> </p> <p><img alt="ascending triangle - an illustration" src="/TMXWebsite/media/TMXWebsite/the-Ascending-Triangle-pattern-pic-1.jpg" /></p> <p> </p> <p> </p> <p><strong>There are three key features of an ascending triangle:</strong><br /> </p> <ul> <li><strong>Strong trend</strong> - In order for the ascending triangle to exist in the first place, the price action must stem from a clear uptrend;</li> <li><strong>Temporary pause</strong> - This element refers to the consolidation phase, which will help the buyers consolidate their strength;</li> <li><strong>Breakout</strong> - The break of the upper flat line marks the breakout, which activates the pattern. It also helps us determine the entry, take profit, and stop loss at a later stage.</li> </ul> <p><br /> Bullish continuation patterns can assume different forms - triangles, flags, pennants etc. The ascending triangle is one of the most common formations in this area, as it practically consists of two converging trend lines. <br /> <br /> As a continuation pattern, the ascending triangle is based on the idea that the likelihood of the trend continuing in the same direction is higher than the chance of a reversal taking place. The bulls are in full control of the price action, as they have been successful in pushing the market higher. <br /> <br /> At one point, the consolidation phase starts, which gives the buyers breathing space as they regroup for another push higher. These temporary pauses can take different forms, with the ascending triangle being one of them. <br /> <br /> From this perspective, it’s logical that the side that has been in control so far has a higher chance of winning the upcoming matches than the side that has been on the losing side. The period of consolidation ends once there is a confirmed breakout in the direction of a previous trend.</p> <h2>Strengths and weaknesses</h2> <p>As outlined earlier, the continuation of an uptrend takes a specific form. This form, in this case the ascending triangle, helps us define the trading environment. On one hand, a break of the upper trend line signals the continuation of the bullish trend. <br /> <br /> On the other, a move below the supporting line breaks the series of the higher highs and invalidates the entire pattern. In this case, the followup is usually a strong move lower as the buyers missed their chance to continue the uptrend. <br /> <br /> Thus, this is the main strength of the ascending triangle - it helps the uptrend to extend. Due to the existence of two trend lines, we are in a better position to determine the take profit and stop loss, if the pattern is activated.</p> <p> </p> <p>The biggest limitation of the bullish triangle, as it’s the case with other types of triangle, is a false breakout. The price action may move above the resistance line, just to return below, and hit a stop loss. In order to minimise the chance of a failed breakout, it’s always advised to consult other technical indicators and confirm the breakout e.g. volume, RSI etc. <br /> <br /> Moreover, consolidation of power takes place as the two lines converge. The narrower the wedge gets, the stronger the breakout usually is. Hence, this amount of power and strength can’t always be controlled, and therefore, it may end up in the price exploding in the opposite direction, although the chances of a continuation of the existing trend are always higher.</p> <h2>Spotting the ascending triangle</h2> <p>As said earlier, the ascending triangle is a bullish formation that occurs in a mid-trend. In the chart below, we can see how the ascending triangle looks in the live market. From an existing uptrend, the price action extends higher through the bullish triangle. <br /> <br /> Two trend lines are drawn to connect the highs and lows, with the latter closing in on the former. When the two lines get closer to one another, the likelihood of a breakout increases. Finally, the USD/CHF buyers are able to push the market outside of the consolidation phase in a clear and strong breakout.</p> <p> </p> <p><img alt="the ascending triangle on USD/CHF hourly chart" src="/TMXWebsite/media/TMXWebsite/the-Ascending-Triangle-pattern-pic-2.jpg" /><br /> <br /> As you can see in the chart above, the upper line is not exactly flat. In general, it’s extremely rare to see the upper trend line completely flat, as we will almost always see mild bias toward one or the other side. As long as the resistance line is close to being a flat one, it’s generally acceptable.</p> <h2>Trading the ascending triangle</h2> <p>Using the same example, we will now showcase how to trade the ascending triangle. As soon as there is a breakout, which is confirmed with a close above the resistance line, we may consider entering the market on the long side. As with every <a href="/latam/trading-academy/indicators-and-patterns/japanese-candlesticks/">candlestick pattern</a>, we have two options for the entry - immediately after the breakout candle closes, or waiting for a potential throwback.<br /> <br /> The black horizontal line reflects our entry position - the breakout H1 candle close. The stop loss is placed within a triangle, as any move below the upper line will invalidate the pattern. As always, make sure you leave some space to allow for a potential retest of the broken trend line. </p> <p> </p> <p><img alt="trading the ascending triangle on USD/CHF hourly chart" src="/TMXWebsite/media/TMXWebsite/the-ascending-triangle-pattern-pic-3.jpg" /></p> <p> </p> <p>The blue vertical trend line is a copy of the distance when the triangle was first formed - when two trend lines were identified. The upper end of the trend line tells us where we should consider taking our profits off the table i.e. where the ascending triangle pattern is completed. <br /> <br /> In the end, the market completed the bullish triangle formation and rotated lower. This example shows how profitable ascending triangles can be, as we risked 15 pips to make nearly 100 pips - a R:R ratio of more than 1:6.<br /> <br /> Remember, the ascending triangle helps us format the price action and identify trade details - entry, stop loss, and take profit.</p>

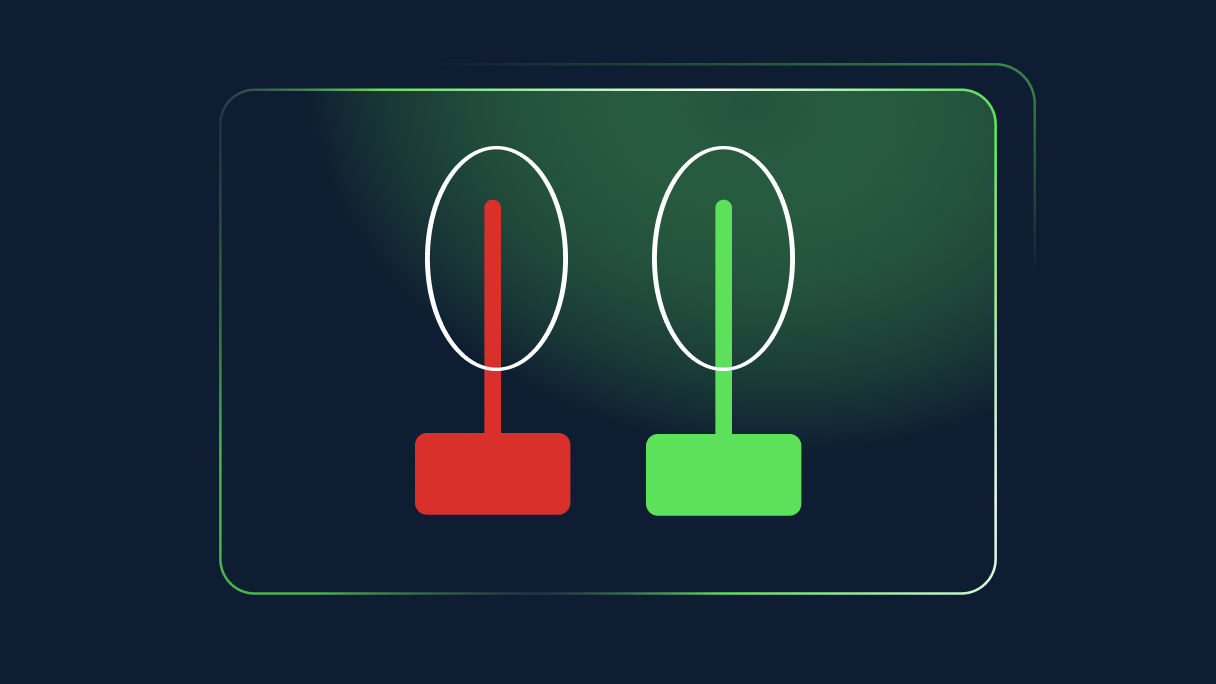
What is a shooting star candlestick pattern?
A shooting star pattern is found at the top of an uptrend, when the trend is losing its momentum.<br /> <br /> The shooting star is actually the hammer candle turned upside down, very much like the inverted hammer pattern. The wick extends higher, instead of lower, while the open, low, and close are all near the same level in the bottom part of the candle.<br /> <br /> The difference is that the shooting star occurs at the top of an uptrend. It’s a bearish chart pattern as it helps end the uptrend. The inverted hammer, on the other hand, is a bullish chart pattern that can be found at the bottom of a downtrend and signals that the price is likely to trend upward.<br /> <br /> <strong><img alt="shooting star candlestick pattern" src="/TMXWebsite/media/TMXWebsite/Shooting-star-pattern_1.jpg" /></strong> <p dir="ltr">Both the green and red versions are considered to be shooting stars although the bearish (red) candle is more powerful given that its close is located at the mere bottom of the candle. Again similar to a hammer, the shadow, or wick, should be twice as long as the body itself. </p> <p dir="ltr">In general, <em>the longer the wick the stronger the reversal</em>, since the long wick signals the inability of the bulls to secure a high close. </p> <p dir="ltr">Some traders prefer to wait and see whether the next candle is a bearish one, which will confirm that the reversal is taking place. <br /> <br /> In both cases, an occurrence of the shooting star at the top of an uptrend only generates a signal of an impending reversal and it shouldn’t be taken as a direct trading signal.</p> <h2>What a shooting star will show us</h2> <p dir="ltr">As outlined earlier, a shooting star is a <em>bearish</em> reversal pattern which signals potential change in the price direction. The uptrend is nearing its end as the momentum is weakening, and the sellers are feeling more confident that they can force a reversal in price action. </p> <p dir="ltr">For this reason, a shooting star candlestick pattern is a very powerful formation. Its shape gives the pattern a lot of attention as the wick always sticks out from the rest of the price action. </p> <p dir="ltr">This is especially the case when the wick of a shooting star is also the new short-term high. </p> <p dir="ltr">Thus, although the buyers were successful in pushing for a new high, they failed to force a close near the session’s high. Their inability is now a chance for the sellers to reverse the price action and erase previous gains. <br /> </p> <p dir="ltr">Therefore, the shooting star’s key strength is its ability to generate a reversal signal. Of course, it may not always be right, but it is considered to be effective and reliable. However, please note that this is still one signal generated by one of hundreds of technical indicators. </p> <p dir="ltr"><br /> For this reason, it is important to always cross-check the signal that a shooting star generates with other indicators, or other candlestick patterns. For instance, in the vicinity of a shooting star there may be other formations that signal the reversal or indecision.<br /> <br /> You can try your hand at spotting the shooting star pattern along with other technical indicators using the <a href="/latam/metatrader5/"><u>Metatrader 5 trading platform</u></a>.</p> <h2>How to trade the shooting star pattern</h2> <p>Trading the shooting star formation is similar to trading a hammer. The focus is on the candle itself of course, especially its wick that extends higher. In the example below, we see a AUD/USD chart that moves in an uptrend.<br /> <br /> In the middle of the chart, the price action corrects lower just to get back higher again and quickly. What follows is the fresh high in the context of a long bullish candle. If you look at this candle only, the situation looks very positive for the bulls, as there is an uptrend in action and the new high has just been posted.</p> <br /> <img alt="AUD/USD trading the shooting star pattern" src="/TMXWebsite/media/TMXWebsite/chart-2-shooting-star_1.jpg" /><br /> <p dir="ltr">However, <em>the situation quickly changes</em>. The price action moves higher again in the session, fails to create a new high, and reverses to close at the low of the session. As a result, a shooting star candle is formed. </p> <p dir="ltr">The next candle is a long bearish candle that confirms that a reversal is taking place. Ultimately, the price action retreats 250 pips lower. <br /> <br /> Whenever you decide to trade the reversal that was initiated by a shooting star, the <u>stop loss</u> should always be placed above the candle’s high. This is arguably the greatest strength of this pattern, and as it is with a hammer, it gives you a clear level to play against.<br /> </p> <p dir="ltr">Any sustainable move, with a high close, above the candle’s high, invalidates the pattern. Take-profit order is dependent on your trading style and risk management. Our advice is to consult other indicators, like <a data-di-id="di-id-3e8356ea-b9dbef8f" href="/latam/trading-academy/indicators-and-patterns/analysis-fibonacci-ratios/">Fibonacci</a>, trend lines, or moving averages, and decide whether to exit a positive trade or not.</p> <p dir="ltr">To demonstrate this, let us move your attention to a chart below. We have a NZD/USD trading sideways for the most part. In the middle part of the chart, the price action starts to move gradually higher.</p> <p dir="ltr"> </p> <strong><img alt="NZD/USD trading the shooting star pattern" src="/TMXWebsite/media/TMXWebsite/chart-3-shooting-star_1.jpg" /></strong><br /> <p dir="ltr">At one point, there is a new high in place, above the horizontal resistance. However, the buyers lose control over the price action, which initiates the pullback. A failure at important resistance/support levels is not a normal failure, it is usually much more important. For this reason, the price action rotates back lower following a failure to clear the resistance and returns to support. </p> <p dir="ltr">The upper red line shows our stop-loss, which is around 20 pips above the session’s high. Any move to these levels where our stopp-loss is means that the pair is in a breakout territory and there is no reversal. </p> <p dir="ltr">Our profit-taking order (the lower horizontal black line) is a simple trend line that shows where the pair bottomed during the previous attempt to move lower. Hence, we are looking for a pullback to the old support. </p> <p dir="ltr">In this situation, we are risking 20 pips to earn nearly 90 pips. A simple calculation shows that it is a 1:4.5 risk ratio, an extremely profitable trade. Opportunities as profitable as this one are quite rare in the markets, but this does demonstrate how powerful a shooting star candlestick pattern can be.</p> <p>Before you start risking your own capital, you may want to consider<a href="https://portal.thinkmarkets.com/account/individual/demo" target="_blank"> opening a demo trading account.</a> This way, you will practise with virtual funds and equip yourself with an array of trading patterns and formations to apply when you start trading live.</p> <h2>Summary</h2> <p>A shooting star is a single-candle bearish pattern that generates a signal of an impending reversal. Similar to a hammer pattern, the shooting star has a long shadow that shoots higher, while the open, low, and close are near the bottom of the candle. <br /> <br /> It is considered to be one of the most useful candlestick patterns due to its effectiveness and reliability. <br /> <br /> The long wick extending upside signals the buyers’ inability to follow up on the earlier move higher, which provides the sellers with an opportunity to initiate a change in the price direction.</p>

Fibonacci ratios
<p>The Fibonacci ratios commonly used are 100%, 61.8%, 50%, 38.2%, 23.6% - these are shown as horizontal lines on a chart and may identify areas of support and resistance. These levels are created by drawing a trend line between two extreme points and diving the vertical distance by the key Fibonacci ratios. These extreme levels are known as the recent swing high and swing low, <br /> <br /> To identify the Fibonacci levels for an uptrend, click on the swing low and draw the trend line to the swing high. In a down trend you simply reverse the trend line. The following chart shows the Fibonacci levels on price which is in an uptrend.<br /> <br /> <img alt="Fibonacci Retracement" src="/TMXWebsite/media/TMXWebsite/Fibonacci-Retracement.png" style="vertical-align: middle;" /><br /> <br /> As you can see on the chart, we have plotted the Fibonacci levels by clicking on the swing lows at 1.000 and swing highs at 1.14. The Fibonacci levels plotted show where price travels to and reverses, and are evident at the 61.8%, 38.2% and 23.6% levels. The 61.8% level is a common support level, as in the above example you can see the price has tested this level on many occasions. More recently, you can see where the price broke through the 38.2% level and retested this level. In this example there’s an expectation for the currency pair to test the 23.6% level at 1.11.<br /> <br /> The next chart shows the Fibonacci ratios plotted for the pricing action in a down trend. As you can see, we’ve drawn a trend line from the swing high at 1.1037 to the swing low at 1.0994. Again, you can clearly see where the price reversed at key Fibonacci levels such as the 50% and 23.6% levels.<br /> <br /> <img alt="Fibonacci Retracement" src="/TMXWebsite/media/TMXWebsite/Fibonacci-Retracement-2.png" style="vertical-align: middle;" /><br /> <br /> Fibonacci levels are by no means fool proof – they’re not areas where you would buy and sell from. You should look at them as areas of interest – an indication of where the price may go to in the future.<br /> </p> <h3><strong>Combining Fibonacci ratios with support and resistance</strong></h3> <p>Fibonacci ratios can be subjective, but can also be used to identify key support and resistance levels. A potential way to use the Fibonacci levels is to spot potential support and resistance levels, and see if these levels line up with the Fibonacci levels. If you do spot these levels, the chances of the price bouncing off them are higher.<br /> <br /> <img alt="Fibonacci Retracement" src="/TMXWebsite/media/TMXWebsite/Fibonacci-Retracement-and-Support.png" style="vertical-align: middle;" /><br /> <br /> As you can see from the chart, the key Fibonacci levels 61.8% and 38.2% have been areas of support and resistance previously, and by identifying this on the chart, these levels can potentially be areas where you could enter the market. With traders looking at the same support and resistance levels, there’s a good chance that there will be a number of orders around those levels. <br /> </p>
-indicator-work.png?width=1216&height=684&ext=.png)
How does the Money Flow Index (MFI) indicator work?
<p>If you are looking to find the demand for a financial asset, you need to be able to track monetary flows in and out of the markets.<br /> <br /> The<strong> Money Flow Index (MFI) indicator</strong> is used to measure supply and demand, which is usually the simplest way to determine where a market may be going.<br /> <br /> Note that this indicator was initially designed to work with the stock markets, as forex markets are not centralised, and therefore some of the inputs will be different to the original scenarios many traders had been using in equities.<br /> <br /> The basic premise is that if demand for a particular currency is high but supply is limited, prices will rise as bidding increases.<br /> <br /> This is the same as any other bidding process: if there are more people wanting to own something, people will try to outbid each other.<br /> <br /> Of course, the opposite is true as well: when demand drops, sellers have to drop prices to attract buyers. The Money Flow Index indicator is a popular method of viewing how these forces interact with the markets.</p> <h2>The calculation</h2> <p>The indicator uses a couple of different mathematical equations in order to find where the market may be ready to go.<br /> <br /> The equation seeks to find the ‘Typical Price’ by determining in the mean of the high, the low, and the closing prices for the time period in question.<br /> <br /> In mathematical notation:<br /> <strong>TP = (H+L+C) / 3</strong><br /> I.e. <u>the Typical Price equals the high, low, and close divided by three</u>.<br /> <br /> The next part of the calculation takes in what is known as money flow.<br /> <br /> This takes the typical price and then multiplies it by volume. There’s no way to know in a non-centralised market exactly how much volume is being done, but by using the volume at your broker, you get a fair representation of what the larger market should be.<br /> <br /> The next equation:<br /> <strong>MF = TP x V</strong><br /> Or, <u>Money Flow equals Typical Price multiplied by Volume</u>.<br /> <br /> The next part of the calculation looks at positive and negative flows over the quantity of periods that the indicator is set towards, known as money ratio.<br /> <br /> The indicator defines positive money flow as being any candle where the Typical Price is higher than the previous candle.<br /> <br /> Conversely, negative money flow is when any candle has TP lower than the previous candle.<br /> <br /> To get the positive money flow for the indicator, the calculation is to add up the total positive money flows over the time span in question.<br /> <br /> Ultimately, to get the negative money flow for the indicator, the calculation is of course to add up the total negative money flows over the same time span.<br /> <br /> The equation is:<br /> <strong>MR = positive money flow / negative money flow.</strong><br /> Finally, everything is converted into an index using the following mathematical formula:<br /> <br /> <strong>MFI = 100 - 100 / (1 + MR)</strong><br /> In other words, <u>the Monetary Flow Index is a ratio of positive money flow into an asset compared to the total money flow</u>.<br /> <br /> The indicator of course shows this for you, and you don’t have to do the math behind it, as it is built into the <a href="/metatrader-4/">MetaTrader 4 platform</a>. <br /> <br /> The default measurement is 14, meaning that if you are looking at a daily chart, the Money Flow Index is giving you a reading of the last 14 days. If it is on the hourly chart, it is reading the last 14 hours, and so on.</p> <h2>How to attach the Money Flow Index indicator</h2> <p>To use the Money Flow Index indicator on the MetaTrader 4 or 5 platform, go to the 'Insert' menu then go to the 'Indicators' submenu, followed by the 'Volumes' submenu, and selecting 'Money Flow Index'. <br /> <br /> The indicator will show up in its own window at the bottom of your platform.<br /> <br /> <img alt="" src="/TMXWebsite/media/TMXWebsite/money_flow_index_001.png" /><br /> <br /> At this point, you can start to look for opportunities using the Money Flow Index.<br /> <br /> Using the indicator The MFI indicator is used to indicate when a market is overbought or oversold. In the indicator, you will notice there are two levels marked by dashed lines of 20 and 80, with the absolute highs at the 100 level, and the absolute lows are 0.<br /> <br /> When the line is above 90, the market is possibly overbought. Conversely, the indicator moving below the 20 level suggests that the market is oversold.<br /> <br /> Let’s look at the chart below.<br /> <br /> The red arrow points out where the indicator has broken above the 80 level, suggesting an overbought condition. Shortly afterwards, the EUR/GBP pair dropped.<br /> <br /> After that, you can see there was a bounce where the blue arrow marks the Money Flow Index dropping below 20.<br /> <br /> While there is just a short term bounce, there is a bounce, nonetheless. This can often be filtered by something along the lines of a moving average, or even a trendline.<br /> <br /> <img alt="" src="/TMXWebsite/media/TMXWebsite/mfi_002.png" /><br /> <br /> <strong>To summarise:</strong></p> <ul> <li>The 80 level is where a market enters an “overbought” condition</li> <li>The 20 level is where a market enters an “oversold” condition</li> <li>The indicator is built into the MetaTrader 4/5 platforms, as well as many others</li> <li>The default reading will be for the last 14 candles, but can be changed</li> <li>The Money Flow Index is often used with other indicators as well</li> </ul> <p> </p> <h2>Adding an additional filter </h2> <p>Many traders choose to compliment the MFI indicator with a moving average.<br /> <br /> This is because the moving average can keep you on the right side of a trend.<br /> <br /> If you are looking for an indication of an overbought or oversold condition within the Money Flow Index indicator, this can be validated by a move above or below a moving average.<br /> <br /> Let’s look at the below four-hour chart in the Canadian dollar/Japanese yen currency pair.<br /> <br /> <img alt="" src="/TMXWebsite/media/TMXWebsite/mfi_003.png" /><br /> <br /> The blue arrow indicates where the Money Flow Index indicator reached the oversold condition. Shortly after that, the price crossed above the 20 exponential moving average, one that is commonly used.<br /> <br /> The way to think about this move is that the market had gotten oversold, and then by breaking above a common moving average, it shows that the momentum and trend is starting to change to the upside.<br /> <br /> At that point, most traders would enter a position.<br /> <br /> Later on, in the same chart, you can see that the Money Flow Index indicator had entered the overbought condition, and the price shortly thereafter fell below the 20 EMA.<br /> <br /> That tells you that the shift is starting to gain momentum, and the market starts to fall from there. Ultimately, this keeps you in the loop when it comes to a potential trend change, and then gives you confirmation in a one-two set up.<br /> <br /> In another example, we can apply the Bollinger Band indicator to the chart, looking for signs of oversold or overbought conditions from both indicators.<br /> <br /> <img alt="" src="/TMXWebsite/media/TMXWebsite/mfi_004.png" /><br /> <br /> Looking at the chart, you can see where the blue arrows start that the market has broken below the oversold level, followed very quickly by the market breaking below the bottom of the Bollinger Band indicator.<br /> <br /> This shows that the market is oversold as far as the Money Flow Index indicator is concerned, but more importantly it is also oversold with both indicators.<br /> <br /> By breaking the bottom of the Bollinger Band indicator, it now is two standard deviations below its average price.<br /> <br /> With both of these indicators you have the ability to see a slowdown in volume going into the market, and at the same time you can see that the market is statistically farther away from normalcy than it should be.<br /> <br /> This almost always sets up for a ‘reversion to the mean’, demonstrated by the moving average in the middle of the Bollinger Band indicator.<br /> <br /> However, some people will also aim for the top of the indicator: it boils down to your own personal trading style.<br /> </p>

How to Use the Stochastic Oscillator
<p>One of the most basic and perhaps oldest indicators used by technical analysts is the <strong>stochastic oscillator.</strong> The stochastic oscillator is an indicator that measures momentum and the strength of a trend. Essentially, its job is to analyse price movement and show how strong the price move is. </p> <p> </p> <p>The indicator measures the momentum of price, and also shows a slowing of momentum as the momentum of a financial instrument needs to slow down before changing direction. This addresses a weakness in retail trading, the fact that far too few traders pay attention to the importance of the rate of change. </p> <p> </p> <p>The stochastic oscillator is one of the more common indicators, and it’s one that you will see in a lot of analysis. However, like any other indicator it is simply a tool that you will be using to navigate through the forex markets, and like any other tool it is needed to be used in the proper settings and situations. </p> <h2>How to add the stochastic oscillator to MetaTrader charts</h2> <p>Adding the stochastic oscillator to the MetaTrader platform is very easy. By clicking on the <strong><em>Insert</em></strong> menu, you can pull down the list and click on <em><strong>Indicators</strong></em>, followed by <em><strong>Oscillators,</strong></em> and then <strong><em>Stochastic Oscillator</em></strong>. It's a common indicator, and as such it's built into the platform and there is no need to download from anywhere else.<br /> <br /> <img alt="" src="/TMXWebsite/media/TMXWebsite/Oscillator-picture-1.jpg" /><br /> <br /> The settings dialog box will pop up, and there are multiple parameters that you can change. The <strong>%K</strong> period and the <strong>%D</strong> period settings are available. The <strong>%K</strong> should be thought of as the slow value of the stochastic indicator and the <strong>%D</strong> should be thought of as the fast value of the stochastic indicator. It uses <em>a couple of moving averages</em> to measure the overall momentum.</p> <h2>Why does momentum matter?</h2> <p>Think back to your mathematics studies. One of the biggest influences in calculus is the absolute rate of change. The idea is that if the market is in an uptrend, but if the momentum starts to slow down, it can suggest that the market is running out of steam and, therefore, could be ripe for a reversal. In this sense, it can suggest whether or not the market is going to continue, or if it might be over-extended in one direction or the other, and other words <em>overbought</em> or <em>oversold</em>.</p> <h2>Using the indicator to make decisions</h2> <p>The stochastic oscillator has a multitude of uses when it comes to trading forex. We have already mentioned the most obvious use for the stochastic oscillator: the idea of identifying overbought or oversold conditions. In this scenario, the stochastic oscillator is best used in a range bound market, as it can tell you when to buy and sell in a relatively well defined situation.<br /> <br /> When you look at the stochastic oscillator window at the bottom of the chart, you see the two moving averages going back and forth in an up and down pattern. You will notice that there are two lines in the indicator window including the 80 and the 20 level.</p> <p> </p> <p>The <strong>area above the 80 level</strong> is considered to be <em>overbought</em>, while the <strong>area below the 20 level</strong> is considered to be <em>oversold</em>. Furthermore, you need to see the moving averages inside the stochastic oscillator to cross in the overbought or oversold areas in order to get a reversal signal. Anything between the two levels is essentially ignored in this scenario.</p> <p><img alt="" src="/TMXWebsite/media/TMXWebsite/Oscillator-picture-2.jpg" /><br /> <br /> </p> <p>Looking at the chart, you can see that the stochastic oscillator had several moves back and forth between the 80 and the 20 levels. However, there are only a couple of areas where the indicator either broke into the overbought area or the oversold area and had a cross. You need both of these things to happen in order for it to fire off a signal.</p> <p> </p> <p>In the graphic below, you can see that the signals fired off are color-coded by the arrows, with the red showing an overbought condition and a potential selling opportunity, and the blue showing potential buying opportunities in an oversold condition.</p> <p> </p> <p>It should be noted that using the stochastic oscillator in this way is much more reliable when in a sideways market, preferably between significant support and resistance. This makes the stochastic oscillator truly important, because statistically speaking markets are in some type of consolidation or sideways action more than 70% of the time. In other words, it’s much more common to be in this environment than it is to be out of it. </p> <h2>Measuring divergence</h2> <p>Another way that people use the stochastic oscillator in forex trading is to measure for divergence. The idea is that as with any oscillator, you could see momentum going in a different direction than the overall price. As an example, the momentum could be rising while price is falling or vice versa. If you are in a scenario where price is rising but the momentum is slowing, that means that there is less aggression to the upside and therefore less demand, even as prices press higher. This can be a sign that potential trouble is on its way. </p> <p> </p> <p>Take a look at the chart just below. You can see that there is a clear uptrend line on the four hour chart for the GBP/AUD pair. As the price was rising, though, notice that the stochastic oscillator made a <em>lower high</em>, which is the opposite of an uptrend. This suggests that the rate of change is slowing down, therefore one would have to be a bit suspicious about the efficacy of the move. </p> <p> </p> <p>After all, if there is less momentum, it suggests that there are fewer fresh orders coming in to push the market to the upside. Ultimately, you can see that shortly after the diversions with the <em>lower high</em> in the stochastic oscillator, the market broke down below the trend line and then eventually fell from those levels. Divergence can be found in several indicators, essentially the oscillator family. Because of this, using your divergence spotting skills can work in multiple other oscillators as well, as they all essentially work the same in this scenario.<br /> <br /> <img alt="" src="/TMXWebsite/media/TMXWebsite/Oscillator-pic-3.jpg" /></p>

The Bill Williams Alligator Indicator
<p dir="ltr">The <strong>Bill Williams Alligator Indicator</strong> is a trend-following indicator. As its creator stated, the entire idea of the markets is that they tend to trend between 15% and 30% of the time. Most of the market is grinding sideways in general. Most of the market is grinding sideways in general.<br /> <br /> The alligator indicator comes built into the <a data-di-id="di-id-3a56e082-fd267adf" href="/latam/metatrader-4/">MetaTrader platform</a>, therefore attracts a lot of attention due to that alone. <br /> <br /> This indicator only works in trends, and it should be avoided when you are in a sideways market. It’s based upon the moving averages, so gives you an idea of when a market is trending, therefore it’s relatively easy to see whether or not you should be using the indicator. The indicator is relatively simple to use, so that of course makes it popular as well. </p> <h2>Adding the Alligator indicator to MetaTrader</h2> <p>It’s very easy to add the indicator to the MetaTrader platform, as it’s already built in. All one has to do is click on Insert, select <strong>Indicators</strong>, and then follow that with <strong>Bill Williams</strong>, finally select the <strong>Alligator</strong> option after that, which will set the indicator active. <br /> <br /> Then, you get the <strong>Alligator options</strong> box, which has several different things that you can change. The basic options include the <strong>Jaws</strong> period, <strong>Teeth</strong> period, and the<strong> Lips</strong> period. You can also choose the <strong>Shift </strong>variable along with these options.<br /> <br /> <img alt="" src="/TMXWebsite/media/TMXWebsite/alligator-image-1.jpg" /><br /> <br /> </p> <p>Once you click <strong>Okay</strong>, the indicator then appears on the main price chart. That being the case, you then see the lines appear. There are three moving averages, which are set at 5, 8, and 13.</p> <p> </p> <p>The indicators are known as the <em>jaw</em>, the <em>teeth</em>, and the <em>lips</em> of the alligator. Although Williams describes this as an alligator, it’s essentially just <em>three moving averages</em>. It’s because of this that it should be relatively simple for most traders to start to use it almost immediately.</p> <h2>What the Alligator indicator tells us</h2> <p>The Alligator Indicator uses the previously mentioned 5, 8, and 13 smoothed moving averages. These are all <a data-di-id="di-id-2479e05d-b9dbef8f" href="/trading-academy/forex/analysis/fibonacci-ratios">Fibonacci numbers</a>, so it makes sense that there will be a certain amount of mystique around the indicator as a lot of traders like the idea of using Fibonacci. </p> <p> </p> <p>The Jaw is the 13 smoothed moving average, which is smoothed by eight bars on previous values. The Teeth is the 8 smoothed moving average, which is smoothed by five bars on previous values. The Lips features the five bar smoothed moving average, which is smoothed even further by three bars on previous values. This will plot a <em>green</em> (5) moving average, a<em> red</em> (8) moving average, and a <em>blue</em> (13) moving average.<br /> <br /> <img alt="" src="/TMXWebsite/media/TMXWebsite/alligator-image-2.jpg" /><br /> <br /> </p> <p>The indicator looks for convergence/divergence in order to build signals. The <strong>Jaw (blue)</strong> makes slower turns than the others, while the <strong>Lips (green)</strong> will be the fastest moving average in the indicator. Because of this, the triple indicators are used very similar to a three moving average server system. For example, if the green indicator slices through the other two to the downside, it's a sell signal. On other hand, if the green indicator slices through the other two to the upside, that’s a bullish sign and a potential buy signal. </p> <p> </p> <p>Bill Williams suggested that when the downward cross occurred, it was when the alligator was sleeping, while an upward cross is the alligator awakening. It’s probably not that important as to whether or not he calls it one thing or the other, because this will follow a lot of the same rules that a triple moving average crossover system will. After all, that’s all this is but there are some tweaks to the calculations because they are smoothed. </p> <p> </p> <p>If the three moving averages are stretched apart, that is generally a sign that you are in a trend and should maintain whatever the position is. In the example below, you can see that the moving averages go from being twisted to spread out relatively far at the first red arrow, they compress, and then spread out even further at the second red arrow. </p> <p> </p> <p><strong>At both of those arrows</strong>, the Alligator indicator is letting you know that the market is extremely bearish, and you should be hanging on to short positions. In fact, you can even make an argument for the compression between the two red arrows as not quite enough to get you out of the original position.<br /> <br /> <img alt="" src="/TMXWebsite/media/TMXWebsite/alligator-image-3.jpg" /><br /> <br /> </p> <p>The indicator showing a couple of strong downtrend is the first thing he would notice, but the question then becomes whether or not you are extraordinarily cautious or if you are a little bit more aggressive. In other words, the Lips rising above the Teeth of the indicator, or the green moving average digging into the red moving average between the two arrows could be a sign to start taking profits if you are already short of the currency pair. At this point, it truly comes down to your personal preference, and traders will use both methodologies when it comes to <strong>using the Bill Williams Alligator indicator.</strong> <br /> <br /> According to the description Bill Williams himself uses, there are a couple of ways to describe what’s going on. When the moving averages are short and choppy, then quite often he will describe it as either the market sleeping, or the alligator “<em>being sated.</em>” When the three moving averages start to spread and move in the same direction, then the mouth is opening and the “<em>alligator is starting to eat.</em>” In the chart just below, you can see that there are blue, red, and orange boxes. <br /> <br /> In the blue boxes, the moving averages start to spread and rise, which is a very <a href="https://www.thinkmarkets.com/en/learn-to-trade/indicators-and-patterns/general-patterns/what-is-bullish-and-bearish-divergence/">bullish sign</a>, while the orange boxes show choppy trading conditions with the moving averages, meaning that you are either flat of the market or trying to take profits from your position previously. The red rectangle is the mouth opening for the alligator to eat again, this time driving to the downside.</p> <p><br /> <img alt="" src="/TMXWebsite/media/TMXWebsite/alligator-image-4.jpg" /></p> <h2>Adding MACD to help the Alligator indicator</h2> <p>Looking at the Alligator indicator, one additional indicator that a lot of traders will use the MACD or <strong>Moving Average Convergence Divergence </strong>oscillator. This gives traders a “second look” at momentum in the market, right along with price. This setup will operate in the same way that the Moving Average</p> <p> </p> <p>Convergence Divergence oscillator typically does, meaning that there are a couple of signals that you should be aware of when it comes to using this in addition to the Alligator indicator. <br /> Looking at the chart below, there are several things that you need to be aware of. The MACD crossing above and below the zero line is important. In fact, marked on the chart are several errors to give you an idea as to how you may wish to trade the market by using the Alligator</p> <p> </p> <p>Indicator and the MACD in concert. Taking a look at the first blue arrow, you can see that the oscillator had crossed the zero line and the histogram in the oscillator started to rise right along with the moving averages of the Alligator Indicator. The next set of arrows are orange, because they show a slowing of momentum. At this point you have the option to either close the trade or perhaps move <a href="https://www.thinkmarkets.com/en/learn-to-trade/intermediate/stop-losses-and-take-profits/">stop losses</a> up a bit closer. Shortly thereafter, there are signs of life again as the Alligator indicator starts to open its jaws again, and the MACD histogram starts to rise. </p> <p> </p> <p>Closer to the top of the chart you see that there is an orange arrow, as the Alligator Indicator starts the clothes it’s jaw again. Furthermore, the histogram on the oscillator has started to drop, suggesting that perhaps momentum is starting to wane a bit. After that, the red arrow signifies the jaw opening yet again for the alligator to eat, while the MACD histogram is starting to drop much lower and well below the zero line. This suggests that there is quite a bit of downward pressure. <br /> <br /> While not marked by arrows on this chart, you can see that the very end of the chart is starting to see the alligator jaws try to close, while the histogram in the MACD is starting to rise, perhaps showing that momentum to the downside is starting to drift a bit lower.<br /> <br /> <img alt="" src="/TMXWebsite/media/TMXWebsite/alligator-image-5.jpg" /><br /> </p> <h2>Some additional thoughts about the Alligator indicator</h2> <p><strong>The Bill Williams Alligator Indicator</strong> is a great <em>trend following type of indicator</em>, but it must be noted that you should be aware of whether or not the market is trending or not. That’s the idea of adding the MACD indicator to the chart, as it can give you a little bit more clarity as to whether or not there is momentum. Having said that, it’s also important to keep in mind that this is simply a triple moving average system. </p> <p> </p> <p>That being said, one of the biggest concerns about anything involving a moving average is that it's a lagging indicator. In other words, it shows you where price and momentum was, not where it is. With that in mind, the indicator by itself won’t be sufficient enough to have a working system built around it. Granted, it can give you an idea when to get in and out of the market, but it also could cause a lot of choppy results if you are not cautious. </p> <p> </p> <p><strong>Some things to keep in mind include: </strong><br /> </p> <ul> <li>Bill Williams Alligator Indicator is a lagging indicator</li> <li>It's simply three moving averages</li> <li>The indicator isn’t a system in and of itself and needs help</li> <li>Price action should probably be paid attention to as well</li> <li>The indicator is built into the MetaTrader platform</li> </ul> <p><br /> All things being equal, this is a nice way to find longer-term moves, but it should also be noted that it's probably going to produce better results for you on higher time frames, although that is typically the case with indicators and technical analysis in general. Ultimately, the short-term charts will continue to struggle to use anything related to a moving average, as the price fluctuations on a short time frame can be quite rapid. <br /> <br /> Furthermore, it’s probably crucial that you experiment with the idea of whether or not the “alligator being sated” is a reason for you to take profits, or to simply stay out of the market in general. Some traders won’t take profits until the green moving average has crossed all the way through both of the other moving averages, so that is something else to think about as well. In order to figure out what works best for you, it’s important to test in a demo account so that you get familiar with the advent flow of using this indicator. </p> <p> </p> <p>Candlestick analysis can also be useful, just as it's with any other technical indicator. For example, a hammer or a shooting star may make for a better signal than just a simple spreading of moving averages by itself. A trade setup may be something along the lines of the alligator opening up its jaws again in the Alligator indicator, the MACD showing a zero line crossing with increasing momentum, and a hammer that suggests the buyers are coming back into the market. <br /> <br /> In other words, simply following the indicator can lead to a lot of choppy and inconsistent results if you don’t temper it with other help. That’s not necessarily that uncommon when it comes to technical analysis and indicators as most systems use at least a couple of them in order to form buy or sell signals. It’s also important to figure out a timeframe that works best for you, not to mention the fact that some markets will act slightly differently than others. That being said, this is a popular enough indicator that several other traders out there will be following it as well.</p>

What is the Bill Williams Awesome Oscillator?
<p dir="ltr">The Bill Williams Awesome Oscillator is an indicator that traders use to measure momentum in a market. Like all indicators, it is typically used as part of a larger trading system.<br /> <br /> The AO is plotted in its own window at the bottom of a MetaTrader platform and has a zero line much like many other oscillators. The indicator uses the 34 simple moving average and the 5 simple moving average in its calculation.<br /> <br /> The indicator takes the difference between the two moving averages and plots them in a histogram. The moving averages that are used to calculate the indicator reading aren’t the conventional moving averages that people will use as they don’t measure the close of the candlestick, but the midpoint of the candlestick range.<br /> <br /> The oscillator is generally used to confirm a trend but can also be used to anticipate a potential reversal of the trend. As an oscillator, it will fluctuate above and below the zero line which is considered neutral. In its standard form, the histogram will print out in red or green bars, with the bar turning green when its value is higher than the one before it.<br /> <br /> If the bar of the histogram is lower than the one before, it will turn red. When the histogram is above the zero line, it indicates that the shorter moving average is trending higher than the longer one.<br /> <br /> You can think of this much like a moving average server system. When the values are below the zero line, the short term moving average is lower than the longer one, showing a downtrend.<br /> <br /> <img alt="" src="/TMXWebsite/media/TMXWebsite/williams_awesome_oscillator_1.png" /></p> <h2>Adding the indicator to your MetaTrader 4 platform</h2> <p>To add the Awesome Oscillator to your <a href="/latam/metatrader4">trading platform</a>, you need to click on the ‘Insert’ menu, go down to the ‘Indicators’ submenu, and then select the ‘Bill Williams’ submenu, followed by selecting ‘Awesome Oscillator’.</p> <p>You will notice that the default setting is to have a green bar for ‘Value up’, and a red bar for ‘Value Down.’ You can change these colors but for the purposes of demonstration in this article we will keep them the same.<br /> <br /> <img alt="" src="/TMXWebsite/media/TMXWebsite/as_2.png" /></p> <h2>Using the Bill Williams Awesome Indicator</h2> <p>While the indicator is typically part of a larger system, there are a couple of basic ways that it is typically used. The easiest way is to simply wait for the oscillator to cross the zero line. For example, if it’s below and rises above the zero line, it’s considered to be a ‘bullish cross’.<br /> <br /> On the other hand, if the AO drops below the zero line you can consider it to be a ‘bearish cross’. This adds more confidence to a potential selling position as the underlying moving averages are in congruence and both moving lower.<br /> <br /> Take a look at the chart below of the four-hour CAD/JPY pair.<br /> <br /> <img alt="" src="/TMXWebsite/media/TMXWebsite/as_3.png" /><br /> <br /> The market breaking down right at the red arrow accompanied by the AO 'bearish cross' gives the trader an opportunity to start selling.<br /> <br /> You should also pay attention to the fact that once the indicator produced several green candlesticks, the market entered a bit of consolidation and a lot of traders would have taken profits there. Having said that, the indicator tends to work a bit better if you keep in mind the overall trend.<br /> <br /> For example, when the oscillator went back to form ingrained bars where the trade leveled out, it wasn’t a matter of buying, rather a signal to either get out of the market or tighten up your stop loss.<br /> <br /> Take a look at the chart below, as it now has a 50 EMA plotted on it.<br /> <br /> <img alt="" src="/TMXWebsite/media/TMXWebsite/as_4.png" /><br /> <br /> When the signal kicked off at the top of the chart, it was a clear breakdown of that EMA.<br /> <br /> Furthermore, the EMA was still above price action and turning lower when the oscillator went back to green. By using the indicator to tell you what phase the trend is an, traders could have held on to this position for much further gains.</p> <h2>Divergence</h2> <p>Another way that traders use the Bill Williams Awesome Oscillator is to find divergence.<br /> <br /> Divergence is when momentum and price aren’t matching.<br /> <br /> In other words, if price is rising but momentum is falling, that’s a sign that perhaps the underlying momentum and fundamentals of the market are starting to deteriorate.<br /> <br /> Conversely, if the price is falling but the momentum is becoming more bullish, then it’s possible that the sellers are starting to run out of underlying momentum, meaning they may be likely to flip their position.<br /> <br /> The Bill Williams Awesome Oscillator works the same way as any other oscillator in this sense. What you are looking for is a peak that doesn’t quite continue the overall momentum of the previous peak, while the price continues. Notice on the chart below the price was rising while the AO was running out of momentum.<br /> <br /> <img alt="" src="/TMXWebsite/media/TMXWebsite/ad_5.png" /><br /> <br /> Notice how the first high was higher than the second one, even though prices continue to drift to the upside. Shortly thereafter, markets broke down a bit, which is the very essence of using divergence for trading.<br /> <br /> This isn’t necessarily a signal in and of itself, but it tells you that something isn’t quite right. With that in mind, there are a couple of ways to play this. Depending on when you enter the market, the divergence of an oscillator can mean several things.<br /> <br /> For example, let’s say that you had bought this pair somewhere closer to the bottom, but she started to notice that divergence was showing itself in the oscillator.<br /> <br /> That’s a warning that you may need to move your stops closer, or perhaps get out of the market altogether. Let’s say that you were in the market, but you started to see divergence.<br /> <br /> At this point you start looking for an opportunity to sell based upon whatever system you are using. Bear in mind that the price could have just as easily gone sideways after divergence and then picked back up over the longer term. It is yet another signal, not a system in and of itself.<br /> <br /> Divergence can:</p> <ul> <li>signal a slowing market</li> <li>offer hints as to when you may need to tighten stop losses</li> <li>give the trader an opportunity to look for a reversal signal</li> <li>come and go without major ramifications, meaning that it is only part of the system.</li> </ul> <h2>Final thoughts on the Bill Williams Awesome Oscillator</h2> <p>The Bill Williams Awesome Oscillator is an indicator that is relatively simple to use and isn’t hard to set up. In fact, it will come with any <a href="/latam/metatrader5/">MetaTrader platform</a> you are using. </p> <br /> <br /> It’s important to remember that it isn’t a signal in and of itself. However, what it does do is give you an idea of what a couple of moving averages might look like on your chart without plotting them on your chart itself.<br /> <br /> Remember, this is simply measuring the difference between the 5 and 34 simple moving averages. In other words, it lets you know when these widen out, and start spreading which for moving average traders suggests that momentum is picking up. The farther away from the zero line the oscillator gets, the more spread out we are and then hence should continue to see momentum.<br /> <br /> The zero line being crossed itself is simply a function of a moving average crossover. This just means that the moving average has crossed over the other one, just as you would see on a moving average of a system that would be plotted on your chart. In that sense, the oscillator itself is just another take on moving averages overall. This isn’t to dismiss this indicator, it just shows that it is another way to express the overall momentum of the marketplace, something that can be done through a multitude of indicators.<br /> <br /> It should be noted that price action comes first, and before that even comes into play you should be looking at support and resistance. That being said, if the market does break through a supporter resistance area, the Bill Williams Awesome Oscillator can give you an idea as to whether or not momentum will continue.<br /> <br /> This is a trend-following indicator, so it is not something to be used in a short-term range bound market.<br /> <br /> The indicator itself was built by Bill Williams, as we’re sure you have guessed, and has been around for some years. When using the Bill Williams Awesome Oscillator, you should think of it more or less as a tertiary signal, as support and price action should dictate what you do first.