Please note ThinkMarkets does not provide CFD services to residents of the US.

Please note ThinkMarkets does not provide CFD services to residents of the US.

Learn To Trade
 
Indicators & Chart Patterns

Deepen your knowledge of technical analysis indicators and hone your skills as a trader.

Find your detailed guides here
Trading Glossary

From beginners to experts, all traders need to know a wide range of technical terms. Let us be your guide.

Learn more
Knowledge Base

No matter your experience level, download our free trading guides and develop your skills.

Learn more
Learn To Trade

Trade smarter: boost your skills with our training resources.

Create a live account
Market Analysis
 
Market News

All the latest market news, with regular insights and analysis from our in-house experts

Learn more
Economic Calendar

Make sure you are ahead of every market move with our constantly updated economic calendar.

Learn more
Technical Analysis

Harness past market data to forecast price direction and anticipate market moves.

Learn more
Live Webinars

Boost your knowledge with our live, interactive webinars delivered by industry experts.

Register now
Special Reports

Engaging, in-depth macroeconomic analysis and expert educational content from our in-house analysts

Learn more
Market Analysis

Harness the market intelligence you need to build your trading strategies.

Create a live account
About ThinkMarkets
 
Sponsorships

Check out our sponsorships with global institutions and athletes, built on shared values of excellence.

Learn more
About Us

Find out more about ThinkMarkets, an established, multi-award winning global broker you can trust.

Learn more
Careers

Discover a range of rewarding career possibilities across the globe

Apply now
ThinkMarkets News

Keep up to date with our latest company news and announcements

Learn more
Trading Infrastructure

When it comes to the speed we execute your trades, no expense is spared. Find out more.

Learn more
Contact Us

Our multilingual support team is here for you 24/7.

Learn more
About ThinkMarkets

Global presence, local expertise - find out what sets us apart.

Create a live account
Log in Create account

What is the Falling Wedge?

The falling wedge is a bullish pattern. Together with the rising wedge formation, these two create a powerful pattern that signals a change in the trend direction. In general, a falling wedge pattern is considered to be a reversal pattern, although there are examples when it facilitates a continuation of the same trend. 

This article explains the structure of a falling wedge formation, its importance as well as technical approach to trading this pattern. We will discuss the rising wedge pattern in a separate blog post.

Where Does the Falling Wedge Occur?

The falling wedge pattern occurs when the asset’s price is moving in an overall bullish trend before the price action corrects lower. Within this pull back, two converging trend lines are drawn. The consolidation part ends when the price action bursts through the upper trend line, or wedge’s resistance.

what is a falling wedge pattern


One of the key features of the falling wedge pattern is the volume, which decreases as the channel converges. Following the consolidation of the energy within the channel, the buyers are able to shift the balance to their advantage and launch the price action higher.
 

Hence there are three key characteristics of a falling wedge pattern:

  • The price action temporarily trades in a downtrend (the lower highs and lower lows);
  • There are two trend lines (the upper and lower) that are converging;
  • There is a decrease in volume as the channel progresses.


The first two elements are mandatory features of falling wedge, while the occurrence of the decreasing volume is very helpful as it adds additional legitimacy and validity to the pattern. 

It may take you some time to identify a falling wedge that fulfills all three elements. For this reason, you might want to consider using the latest MetaTrader 5 trading platform, which you can access here

Spotting the Falling Wedge

The most common falling wedge formation occurs in a clean uptrend. The price action trades higher, however the buyers lose the momentum at one point and the bears take temporary control over the price action. 

The second phase is when the consolidation phase starts, which takes the price action lower. It’s important to note a difference between a descending channel and falling wedge. In a channel, the price action creates a series of the lower highs and lower lows while in the descending wedge we have the lower highs as well but the lows are printed at higher prices. For this reason, we have two trend lines that are not running in parallel. 


Falling wedge - EUR/USD daily char


In the chart above we see a EUR/USD on a daily chart. The price action moves in an uptrend, pushing higher and creating new short-term lows. The pair’s price then starts to move lower, i.e.: the consolidation phase starts as the buyers use this time to regroup and prepare for another press higher. 

In parallel, you see that the volume decreases. Just before the break out occurs and as the two trend lines get close to each other, the buyers force a break out of the wedge, surging higher to create a new low. The surge in volume comes around at the same time as the break out occurs. 

What the Falling Wedge Tells Us

The falling wedge pattern is a technical formation that signals the end of the consolidation phase that facilitated a pull back lower. As outlined earlier, falling wedges can be both a reversal and continuation pattern. In essence, both continuation and reversal scenarios are inherently bullish.

As such, the falling wedge can be explained as the “calm before the storm”. The consolidation phase is used by the buyers to regroup and attract new buying interest, which will be used to defeat the bears and push the price action further higher. 

Hence, a falling wedge is an important technical formation that signals that the correction, or consolidation, has just ended as the asset’s price left the wedge to the upside and, in most cases, the continuation of the overall trend is taking place. 

Trading the Falling Wedge

Let us now look at the same example from a more technical trading perspective. Once we spot a falling wedge that fulfills all criteria, we start focusing on the main elements of a trade: entry, stop loss and take profit, as well as the overall risk associated with this trading opportunity. 


Paying attention to volume figures is really important at this stage. The continuous trend of a decreasing volume is significant as it tells us that the buyers, who are still in control despite the pull back, are not investing much resources yet. 


Trading falling wedge - EUR/USD daily chart 

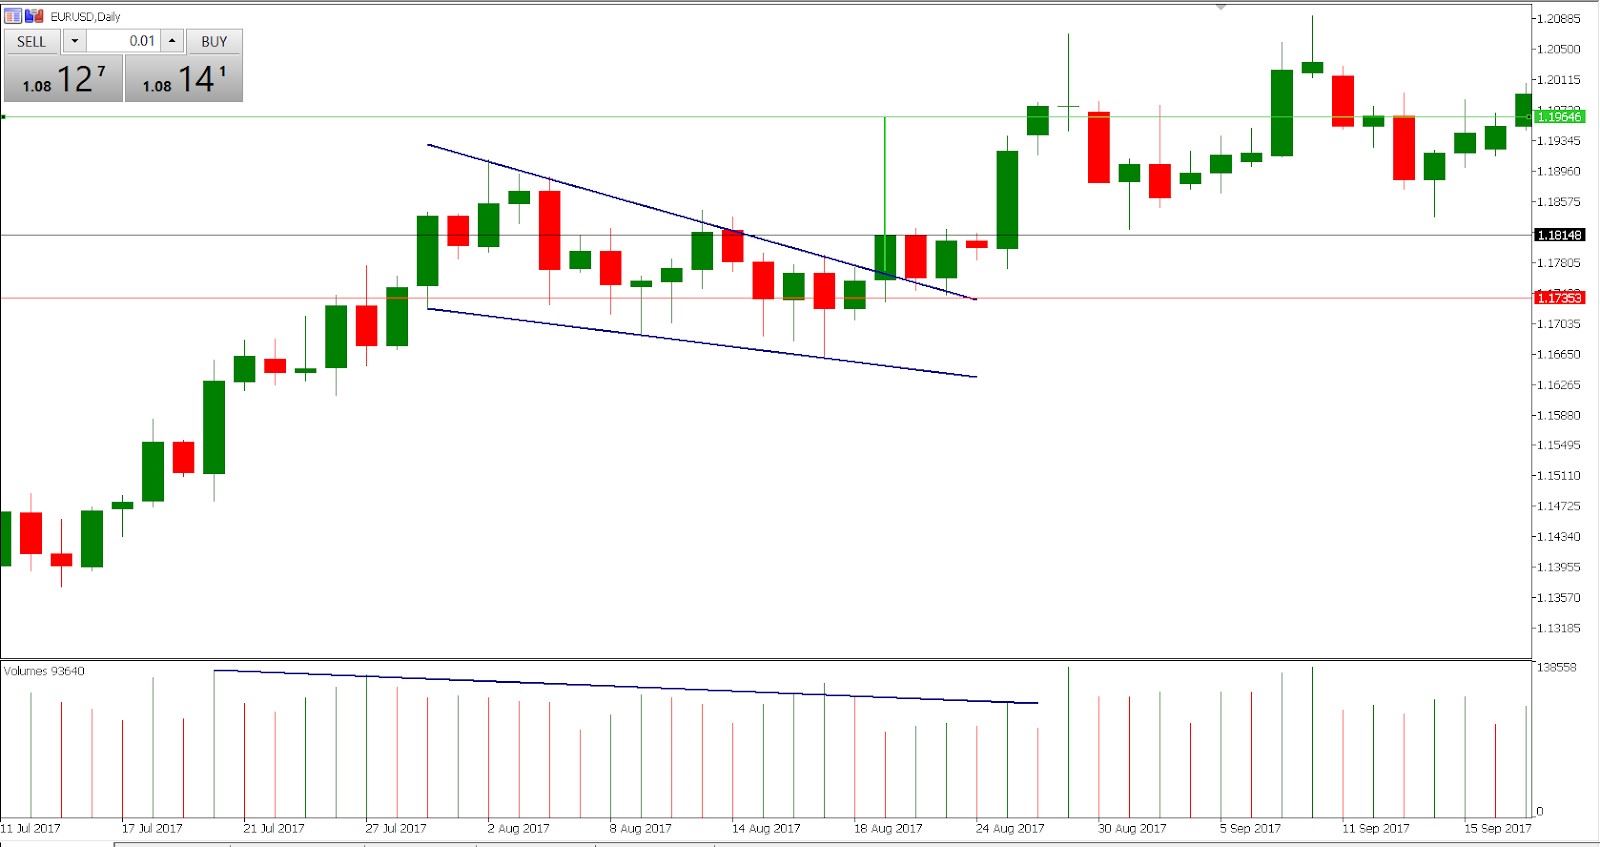
A break of the wedge to the upside has to be confirmed by a daily close above the wedge, which is exactly what happens. At this point, you have two opportunities

  • You enter a trade as soon as the close occurs
  • You wait for a potential pull back for the price action to retest the broken resistance.


The first option is more safe as you have no guarantees whether the pull back will occur at all. On the other hand, the second option gives you an entry at a better price. In this case we will go for the option number one.

A stop-loss order should be placed within the wedge, near the upper line. Any close within the territory of a wedge invalidates the pattern. You can see that in this case the price action pulled back and closed at the wedge’s resistance, before eventually continuing higher on the next day.


Finally, you have to set your take profit order, which is calculated by measuring the distance between the two converging lines when the pattern is formed. This way we got the green vertical line, which is then added to the point where the breakout occured. Thus, the other end of a trend line gives you the exact take-profit level. 

Our trade details are as follows: Entry - $1.1815, SL - $1.1735 and TP - $1.1965. Hence, we are risking 80 pips in order to make 150 pips, which is a R:R (risk-reward) ratio of nearly 1:2. A week after we had entered our trade, the profit-taking order was hit, banking us 150 pips. 

As always, we encourage you to open a demo account and practice trading the falling wedge, as well as other technical formations. This way, you will get more familiar with different trading approaches and be better prepared to trade your own capital in live markets at a later stage. 

Any opinions, news, research, analyses, prices or other information contained on this website is provided as general market commentary and does not constitute investment advice. ThinkMarkets will not accept liability for any loss or damage including, without limitation, to any loss of profit which may arise directly or indirectly from use of or reliance on such information.
Back to top