Bullish reversal candlestick patterns:
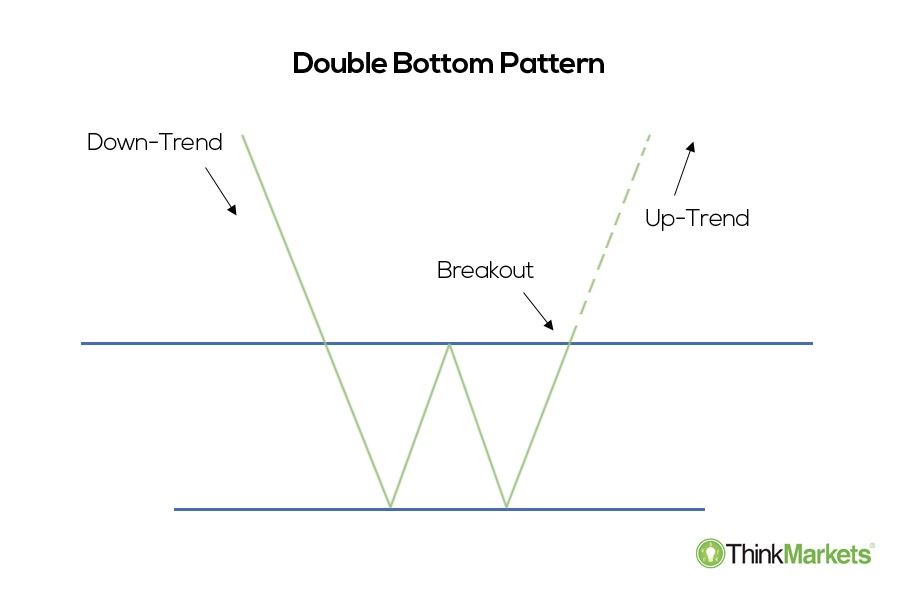
Double Bottom
The double bottom pattern is a bullish reversal pattern that occurs at the bottom of a downtrend and signals that the sellers, who were in control of the price action so far, are losing momentum. The pattern resembles the letter W due to the two-touched low and a change in the trend direction from a downtrend to an uptrend.
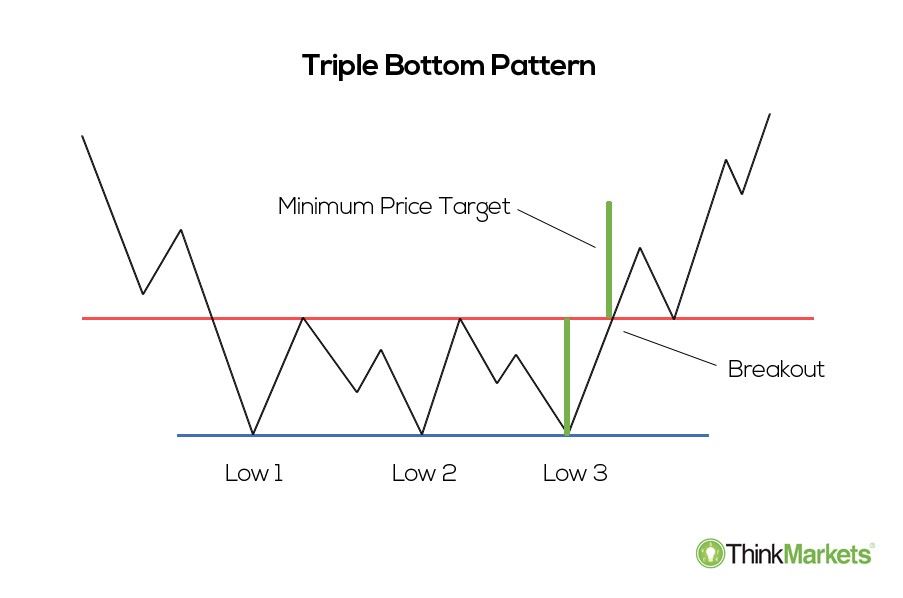
Triple bottom
As the name itself says, the triple bottom consists of the three lows made at roughly the same price. It’s a bullish reversal pattern that can be detected at the end of a downtrend. The pattern suggests an impending change in the trend direction after the sellers failed to break the support in three consecutive attempts.
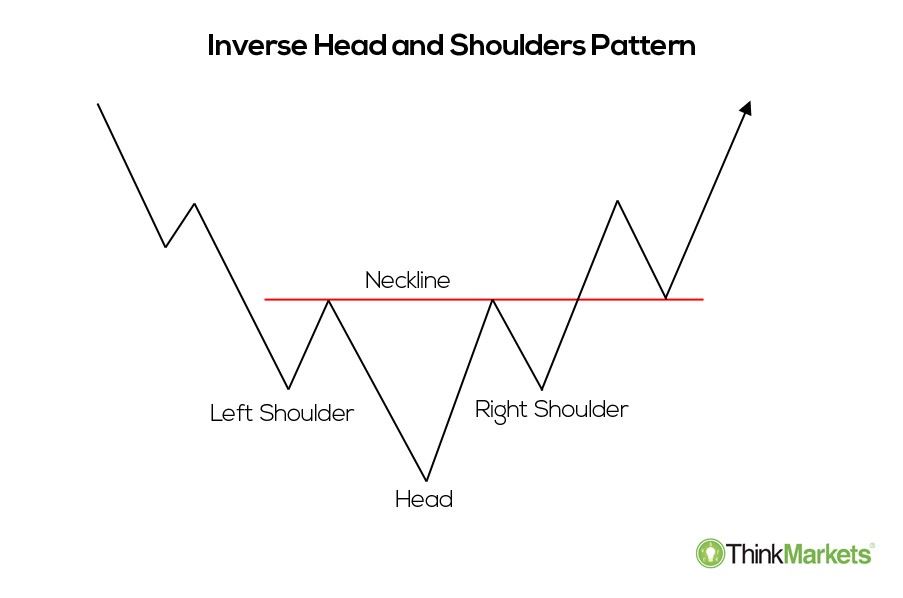
Inverse head and shoulders
The bullish version of the traditional head and shoulders pattern is called the inverse head and shoulders formation. It’s a bullish reversal pattern that can be seen at the end of a downtrend. The sellers have run out of gas as they were unable to continue the series of the lower lows, with the third low (the right shoulder) being at a higher level than the previous peak.
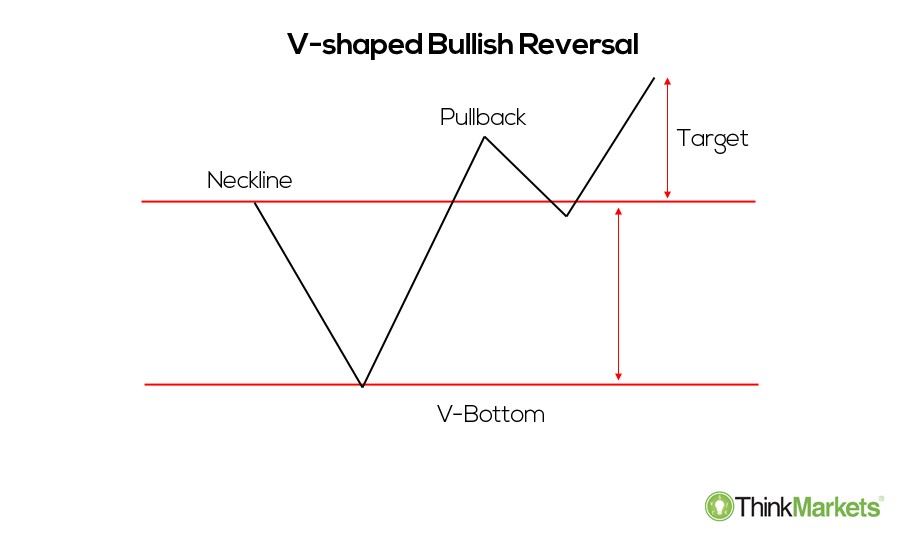
Bullish (V) Reversal
Bulllish V-shaped reversals take place after a strong downtrend. They are also called “spike” reversals, or the V-bottom, as the price action tends to spike lower, before the counter-spike to the upside occurs. This reversal pattern is considered to be an unpredictable formation as the market sometimes abruptly changes its course which is difficult to predict and trade.
Any opinions, news, research, analyses, prices or other information contained on this website is provided as general market commentary and does not constitute investment advice. ThinkMarkets will not accept liability for any loss or damage including, without limitation, to any loss of profit which may arise directly or indirectly from use of or reliance on such information.