Think markets
Trade with trust.

Fast & reliable execution
Excellent
4.7
| Instrument | Buy | Spread | Daily Change | |
|---|---|---|---|---|
Commodities
Gold
Enjoy spreads from just $0.19
Indices
Indices
Enjoy spreads from just 0.4 points on SPX500
ThinkTrader: Where speed meets optimal pricing


One-click trading

Cloud-based alerts

Up to 6 pending order types

Custom watchlist

Multi-screen display

Market calendar
Traders’ Gym
Develop, backtest and refine your strategies on real historical data in a risk-free environment.*
TradingView integration
Connect your ThinkTrader account to TradingView and trade directly on one of the world’s leading charting platforms.
Excellent1000+ reviews
TrendRisk Scanner
Discover new trade opportunities with this tool that scans the markets for high-probability trades.
Get signals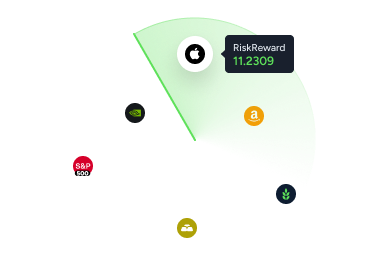
*Past performance does not guarantee future returns
Why traders choose us
Established in 2010, ThinkMarkets is an innovative, market leading provider of online trading services. Today ThinkMarkets is a multi-regulated broker with offices across the globe including Australia, Asia, Japan, Europe, UK, UAE, South Africa and clients in more than 165 countries.
15
Years of history
10
Licences
24
Awards
Our awards

Best Newcomer

TradingView
Global • 2024
#1 innovation
ForexBrokers
Global • 2024
Best Analysis app
Techradar
Global • 2024
Best Customer Service
Global Forex Awards
MENA • 2023