Adding a moving average to increase effectiveness
One of the indicators that comes to mind when trying to use this indicator is the moving average. After all, it can give you an idea as to what the trend is. If you are looking to use the Williams Percent Range indicator in a trend, it makes quite a bit of sense to use a moving average on the chart to determine whether or not you have an opportunity to get long or short in a currency pair. Beyond that, it also can tell you when it’s time to use the Williams Percent Range indicator for a range bound trade as well.
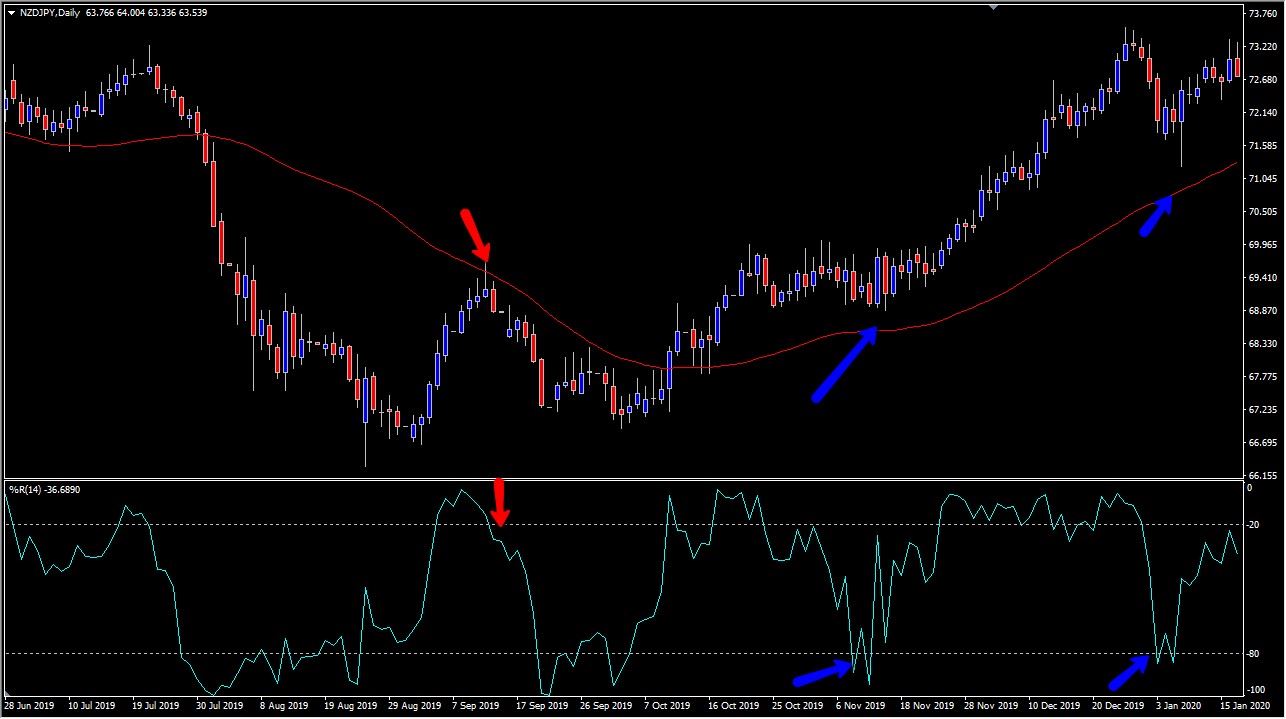
Take a look at the chart and notice that there are red and blue arrows. The first arrow, the red one, shows when the indicator went up into the overbought condition as the market approached the 50 EMA.
Furthermore, the slope of the moving average had been lowering for quite some time, and as it went below the minus 20 level, it sent the market much lower. In fact, there was even a signal to get out of the short position due to the indicator dropping into the range below the minus 80 handle as it becomes oversold. After that, the market then broke above the 50 day EMA, which would have more than likely told most traders that perhaps they don’t want to start shorting the market as it is a trend determining indicator.
Beyond that, the most recent low was higher than the one before which is also another reason to believe that the trend is changing. After that, you can see that the market broke above to higher pricing, pulled back towards the 50 day EMA and at the same time the Williams Percent Range indicator dropped into the oversold area. At the same time, the 50 day EMA has started the slope higher, offering a buying opportunity. After that, we had seen another opportunity presented itself by the next set of blue arrows.
Any opinions, news, research, analyses, prices or other information contained on this website is provided as general market commentary and does not constitute investment advice. ThinkMarkets will not accept liability for any loss or damage including, without limitation, to any loss of profit which may arise directly or indirectly from use of or reliance on such information.