The Reserve Bank of New Zealand has raised interest rates 11 times in a row and is one of the few central banks who last moved by 50 basis points. The NZ official cash rate now stands at 5.25%, higher than Australia, the US, the UK, and Europe.
Many assume FX traders favour currencies with a higher yield. This strategy is commonly referred to as the "carry trade" and involves investors borrowing in the lower yielding currency (i.e., the "funding currency") and investing in the higher yielding currency (i.e., the "investing currency"). Their profit is determined by the interest rate differential between the funding currency and the investing currency. The greater the differential, the greater the carry trader's profit, and therefore the greater the attractiveness of buying/selling the currency pair which facilitates the strategy.
Yes, daily economic announcements often catch the eye of short-term FX traders looking to turn a quick buck, but the carry trade remains the biggest long term driving force in global FX markets. After all, each of those minute-to-minute data releases only serve to influence the broader outlook on interest rates in various currencies, and this impacts the degree of carry available by trading them.
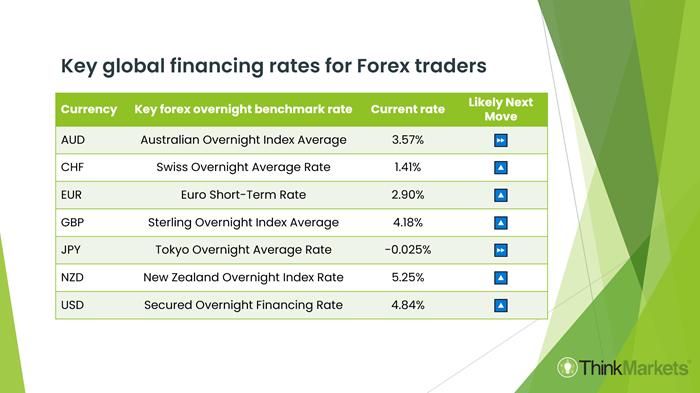 Click on image to magnify: Table of major currency yields
Looking at the table above, we can see the New Zealand dollar (i.e., the "Kiwi") offers a return premium over its major counterparts. It follows, the Kiwi
should be appreciating against its major counterparts. But as we'll see when we look at the charts, this is
not the case.
Why? FX traders work on
future yield differential expectations, not current. In this regard, the Kiwi falls short, and probably will continue to do so for the near-term.
The NZ economy is buckling under the pressure of stubbornly higher inflation, which has been stuck at over 7% p.a. for close to a year now. 450 basis points of interest rate hikes from the RBNZ over the last 12 months has delivered a severe burden on NZ consumers and businesses. Spending is down, the housing bubble has well and truly burst, and mortgages in arrears are climbing sharply. Indeed, major Kiwi bank ASB, recently predicted NZ GDP will contract by around 2% by early 2024.
The RBNZ is in a tricky situation. It wants to bring inflation down, but at the same time it doesn't want to further damage the NZ economy. We can't rule out further interest rate rises from the RBNZ (they haven't!), but it is less likely further sharp increases are coming. More likely, the medium-term path of NZ interest rates is flat, but the next move could well be down as the economic situation deteriorates further.
Contrasting this, the economic outlook in the Eurozone and UK are relatively healthier as high savings rates facilitate a pent up post-COVID bounce-back in spending. At the same time, rates of inflation remain acutely high. In the UK for example, inflation as measured by the CPI remains above 10%. These factors are working in favour of higher future interest rates in the UK and Eurozone in the medium term.
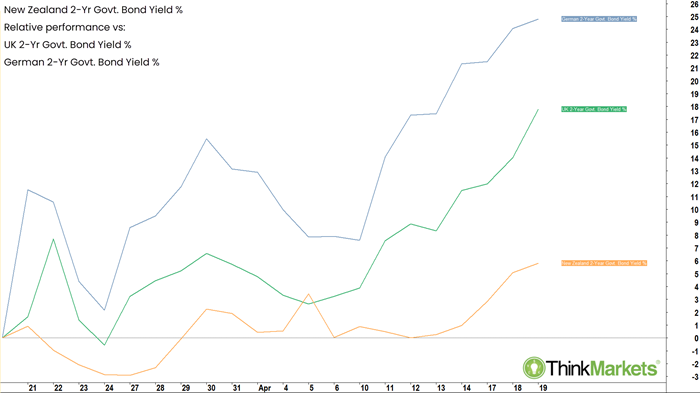 Click on image to magnify: NZ 2-Year Govt. Bond Yield % relative performance vs UK 2-Year Govt. Bond Yield % and German 2-Year Govt. Bond Yield %
Short term government bonds, particularly those under 2-years, are commonly used as proxies for investment returns for the carry trade. We can see that over the last 30-days data for NZ, UK, and European economies have driven a major outperformance in the yields of UK and German 2-Year government bonds over the yield for the equivalent NZ bond. This has coincided with a strong outperformance of the Pound Sterling and the Euro against the Kiwi over since mid-March.
How to trade weakness in the New Zealand dollar
The above analysis suggests FX investors will be moving away from carry trades using the Kiwi as the investing currency. Should the interest rate differentials swing in such a way to cause NZ yields
to be lower than those in the US, UK or Europe, we could even see the Kiwi start to be utilised as a funding currency.
Either way, is spells a likely period of prolonged weakness ahead for the Kiwi against some of the key majors. Let's investigate three possible FX pairs which are currently offering trades which take advantage of a weaker New Zealand dollar.
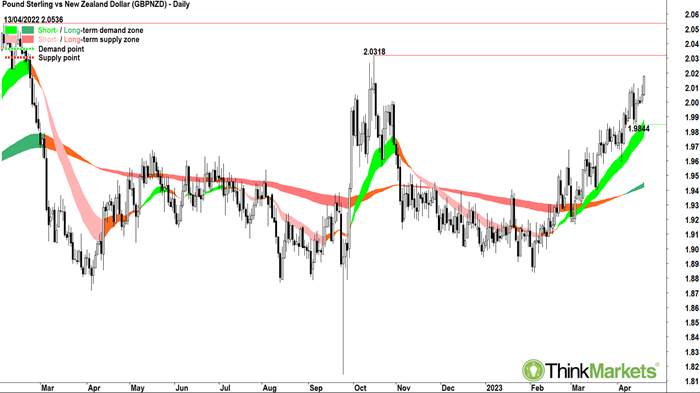 Click on image to magnify: Pound Sterling vs New Zealand dollar GBPNZD
Looking at the chart above of the GBPUSD, the short-term trend as measured by the short-term ribbon (light green) is up, as is the long-term trend (dark green ribbon). This indicates shorter-term traders and longer-term positional investors each favour the Pound over the Kiwi at the moment.
The price action shows higher peaks and higher troughs which indicates building demand and diminishing supply in the medium term, another sign of positive flows towards the Pound and away from the Kiwi.
The candles show a moderate degree of volatility in the recent short-term trend, alternating black and white, but for the most part white candles and lower shadows appear to be in the majority. The last candle for 19 April is particularly bullish, and based on the trends and price action, I feel it warrants adding some long-side risk exposure at the current price.
There is a key potential supply pressure point at the 17 October 2022 high of 2.0318. Given the proximity of the GBPNZD to this high (now trading around 2.01), it is hard to justify adding more than just an initial risk position at this stage given potential reward to risk.
Before increasing their risk to the long-side on GBPNZD, traders are best served by watching how the price action evolves around 2.0318. The addition of further risk may be considered upon the observance of large white candles/ long lower shadows near the 2.0318 pressure point, or on similar candles which facilitate a close above it.
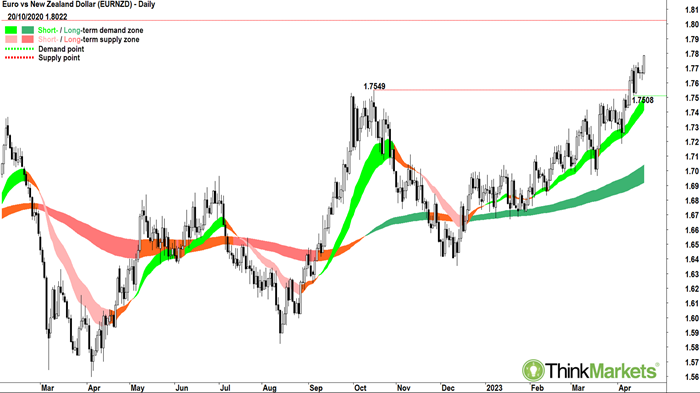 Click on image to magnify: Euro vs New Zealand dollar EURNZD
Far more interesting from a technical perspective is the EURUSD. It is showing even stronger appreciation of the EUR versus the NZD than the GBP. Short- and long-term trends are exemplary, and the price action shows stronger upward motive phases compared to corresponding pullbacks than the price action on the GBPNZD. Similarly, I feel the candles are more decisive to the upside.
I can see reason to add long-side risk exposure at the current price with a logical first target at the 20 October 2020 high of 1.8022.
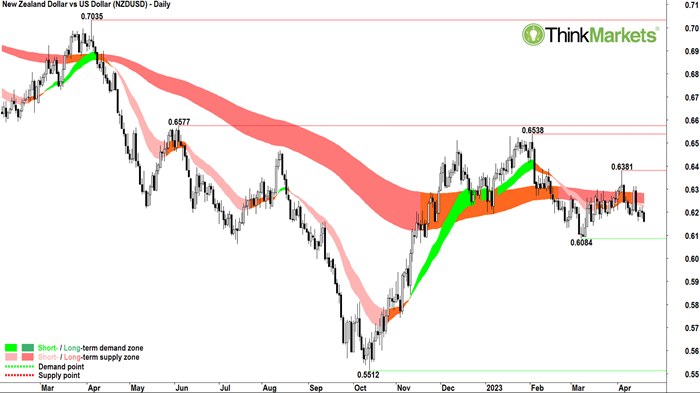 Click on image to magnify: New Zealand dollar vs US dollar NZDUSD
The final path to trading upon further weakness in the Kiwi is via the US dollar, in this case by shorting the NZDUSD pair. As the Kiwi is first in the currency pair, it is weakening when the NZDUSD exchange rate declines, and strengthening when the NZDUSD exchange rate increases.
Here, the technicals are largely the opposite (as they should be) of the GBP and EUR crosses. The long-term trend is set to the downside as evidenced by the long-term trend ribbon (dark pink). The short-term trend ribbon (light pink) is also breaking lower.
Price action shows congestion through March with only a slight upwards bias, but has since turned decisively bearish in April with clearly defined lower peaks and lower troughs.
The candles have been very much skewed to the supply-side with black bodies and upper shadows, even through that feeble rally in March. They now appear to be demonstrating increased motivation of the supply-side in the market.
I would be happy to add some short-side risk exposure at the current price, but only a partial, initial position in-line with the short- and long-term trends. Subsequently, I'd be looking to increase short-side risk exposure on a close below the 0.6084 demand point from 8 March.
Learn More, Earn More!
Want your portfolio questions answered? Register for next week's Live Market Analysis sessions and attend live! You can ask me about any stock, index, commodity, forex pair, or cryptocurrency you're interested in.
REGISTER:
Live Market Analysis Webinars - Tuesdays & Thursdays 1pm, Friday 12pm AEST
You can catch the replay of the last episode of Live Market Analysis here:
Too many US stocks to buy as bull market beckons