 Download Carl's Bear Market Survival Guide e-Book:
https://www.thinkmarkets.com/au/lp/2023-bear-market-survival-guide-ebook/
Download Carl's Bear Market Survival Guide e-Book:
https://www.thinkmarkets.com/au/lp/2023-bear-market-survival-guide-ebook/
On Friday 21 April, investors will see the latest data from the Purchasing Managers' Index (PMI) in the United States. PMI data measures the health of two main segments of the US economy, manufacturing, and services.
The index's author, S&P Global, surveys supply chain managers within over 400 businesses across 19 major industries across the US economy. The index is weighted based upon the contribution of each industry to US GDP.
Respondents are questioned with respect to five main areas: levels of new orders, levels of inventory, production volumes, deliveries of supplies used to produce goods and services, and level of employment. For each area, S&P Global asks if there was an improvement, a deterioration, or no change. Each area is equally weighted.
Both the manufacturing and services PMI's are calculated to be a number between 0 and 100. A level of 50 is considered to be the balance point between expansion or contraction in a particular segment. So, for example, if the Manufacturing PMI comes in at 48.5, the manufacturing sector has contracted over the period surveyed. Alternatively, if for example the Services PMI come in at 56, the services sector has expanded over the period surveyed. Readings in the low-40's are usually considered to be particularly weak, and readings over 60 particularly strong.
There are a number of reasons why investors place a great deal of importance on PMI data. Firstly, it is compiled from a wide range of businesses across several key industries for the US economy. Secondly, the manufacturing and services sectors are the most important non-Government and non-Rural sectors (these other two sectors are often influenced by seasonal factors). Thirdly, the nature of the data collected is particularly forward looking, i.e., new orders, inventory levels, ordering of supplies, and employment changes, very much sample a business's confidence in their future profitability.
What to look for in Friday's PMIs
Friday's release is likely to take on increased importance as investors weigh the probability of a potential pause in Federal Reserve interest rate hikes against a possible recession in the US in the second half of this year. The market is currently forecasting a 75% chance of another 0.25% increase to the Fed Funds Rate to 5%-5.25% at the Fed's next meeting in May.
A strong set of PMI data on Friday will likely firm the case the Fed has the flexibility to instigate its tenth consecutive increase – one which most economists forecast will be its desired last before taking a pause to consider the impact of previous hikes. A weaker set of PMI data, particularly in the manufacturing sector which has demonstrated six consecutive months of contraction, could sway the Fed towards an immediate pause.
At the time of writing, the consensus among economists is for the US April Manufacturing PMI to come in at 49.0, down from March's 49.3. This points to a slight acceleration in the deterioration of conditions within the sector.
Over the last two months, the US services sector has fared much better than manufacturing, bouncing back into expansion in February and building on that expansion in March. The outperformance is a result of US consumers switching their consumption from goods during the pandemic (i.e., upgrading home tech, renovations, new cars etc.) to services more recently, such as eating out, beauty treatments, recreation, and holidays.
Economists are expecting the growth services to continue, albeit at a slower pace, with the US April Service PMI to come in at 51.5, down from March's 52.6.
Potential market impact - PMIs stronger than expected
As discussed, a strong set of PMI data (e.g., high 50's) increases the probability of an interest rate increase in May. This will likely cause the US dollar ('Greenback') to appreciate against its counterparts. The greatest improvement is likely to come against those currencies in jurisdictions where the interest rate outlook is benign/weaker. These include Australia and New Zealand.
The prevailing trend of the Greenback against both the Australian ('Aussie') dollar and the New Zealand ('Kiwi') dollar is one of appreciation. The weaker currency of the two against the Greenback, however, is the Kiwi.
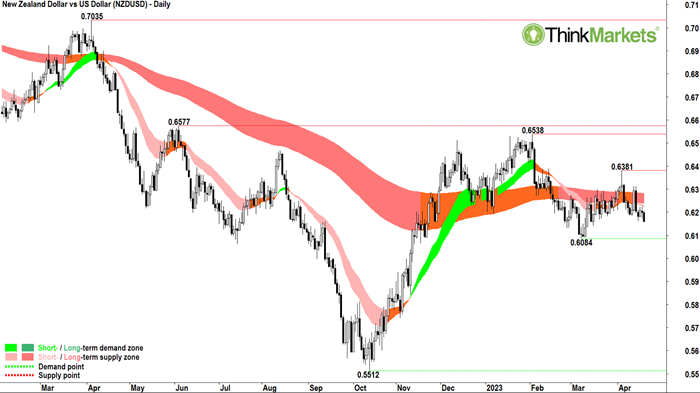 Click on image to magnify: New Zealand dollar vs US dollar NZDUSD
When considering currency pairs, remember that a rise in the exchange rate indicates appreciation of the first currency in the pair against the second. Conversely, a decline in the exchange rate indicates a depreciation in the first currency in the pair against the second.
The NZDUSD chart shows a well-defined long-term downtrend (dark pink trend ribbon) and a short-term trend which is just now reasserting itself (light pink trend ribbon). This demonstrates the Kiwi has been depreciating against the Greenback.
0.6381 is appears now confirmed as a major point of supply, and its lower relative position to the previous major point of supply at 0.6538 suggests supply is building in the system for the Kiwi. Only 0.6084 stands in the way of what could be a big break to the downside in the NZDUSD which could see it slump towards the 2022 low of 0.5512.
Potential market impact - PMIs weaker than expected
If on the other hand the PMI data comes in weaker than expected (e.g., mid-40's), it will likely reduce the likelihood of an interest rate increase in May. This will likely cause the Greenback to depreciate against its counterparts. The greatest depreciation is likely to come against those currencies in jurisdictions where the interest rate outlook is more hawkish. These include the UK and Eurozone.
The prevailing trend of the Greenback against both the Great British Pound Sterling and the Euro is one of depreciation. The stronger currency of the two against the Greenback, however, is the Euro.
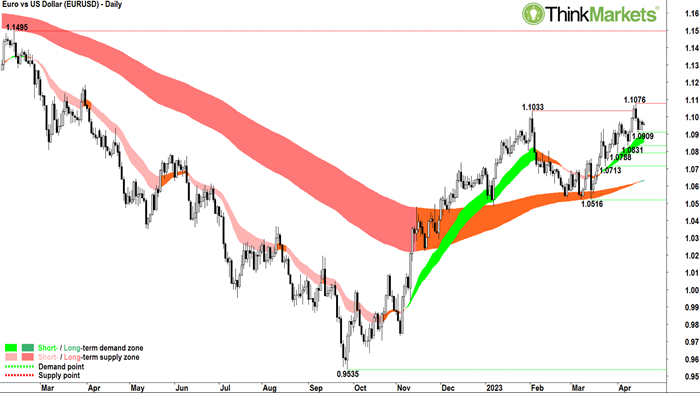 Click on image to magnify: Euro vs US dollar EURUSD
The EURUSD chart shows a newly established long-term downtrend (dark green trend ribbon) and a well-established short-term trend (light green trend ribbon). Note how both trend ribbons have been supporting price over recent months.
The price action is higher peaks and higher troughs which demonstrates increasing demand and diminishing supply in the medium term. The short-term trend, however, is regressing back toward the short-term trend ribbon.
The lows of the last three trading sessions are in close proximity, suggesting the Euro has found some demand around 1.0910-1.0920. If the candles switch back to white/lower shadows, and we start to see higher highs and higher lows set again, the probability lies with another test of the minor point of supply at 1.1076.
The last push to 1.1076 likely removed a great deal of latent supply lingering in the system from the major point of supply at 1.1033. It follows, any next move higher should enjoy an easier run into the next major point of supply at 1.1495.
Learn More, Earn More!
Want your portfolio questions answered? Register for next week's Live Market Analysis sessions and attend live! You can ask me about any stock, index, commodity, forex pair, or cryptocurrency you're interested in.
REGISTER:
Live Market Analysis Webinars - Thursdays 1pm AEST / Wednesdays 3am GMT, Friday 12pm AEST / Thursdays 2am GMT
You can catch the replay of the last episode of Live Market Analysis here:
Lithium prices tumble again...how low can they go? (Try half!)