Crude oil prices tumbled about 3% on Tuesday after
initially hitting fresh multi-year highs after the OPEC+ discussions were scrapped amid infighting. Prices have managed to rebound at the start of today’s session with both contracts rising about 1% each, along with other commodity prices and European indices. However, the rebound may fade later in the session or in the week as the longs potentially take profit in light of Tuesday’s big reversal from a key technical area.
Up until now oil prices have been driven primarily because of demand, with investors content the gradual release of supplies from the OPEC+ will help to keep the market relatively tight. In response to the group’s failure to reach a deal on Monday, investors initially figured that the lack of agreement means supply will rise even more slowly. On reflection, however, investors have released that there will be lots of uncertainty about the OPEC’s output policy in coming months and there is a small risk that the whole agreement could collapse, potentially leading to another price war.
While it is still early days, investors will now not be in any rush to buy oil at these elevated levels – especially after the US government has spoken with officials in Saudi Arabia and the United Arab Emirates in hopes of reaching an agreement that “will promote access to affordable and reliable energy.” The key word is “affordable,” meaning the US will push for lower oil prices.
As more cracks begin to appear in the unity between Riyadh and Abu Dhabi, it will be interesting to see what, if any, solutions will be found to end the standoff and how this will shape the market in the next 1.5 years. It is a question of when rather than if Abu Dhabi puts more barrels of oil into the markets.
So, in the coming months, the oil market rally was likely to reverse anyway. That process may have already started.
Brent oil turned lower after touching its long-term bearish trend line, which has been intact since 2008 as this monthly chart shows:
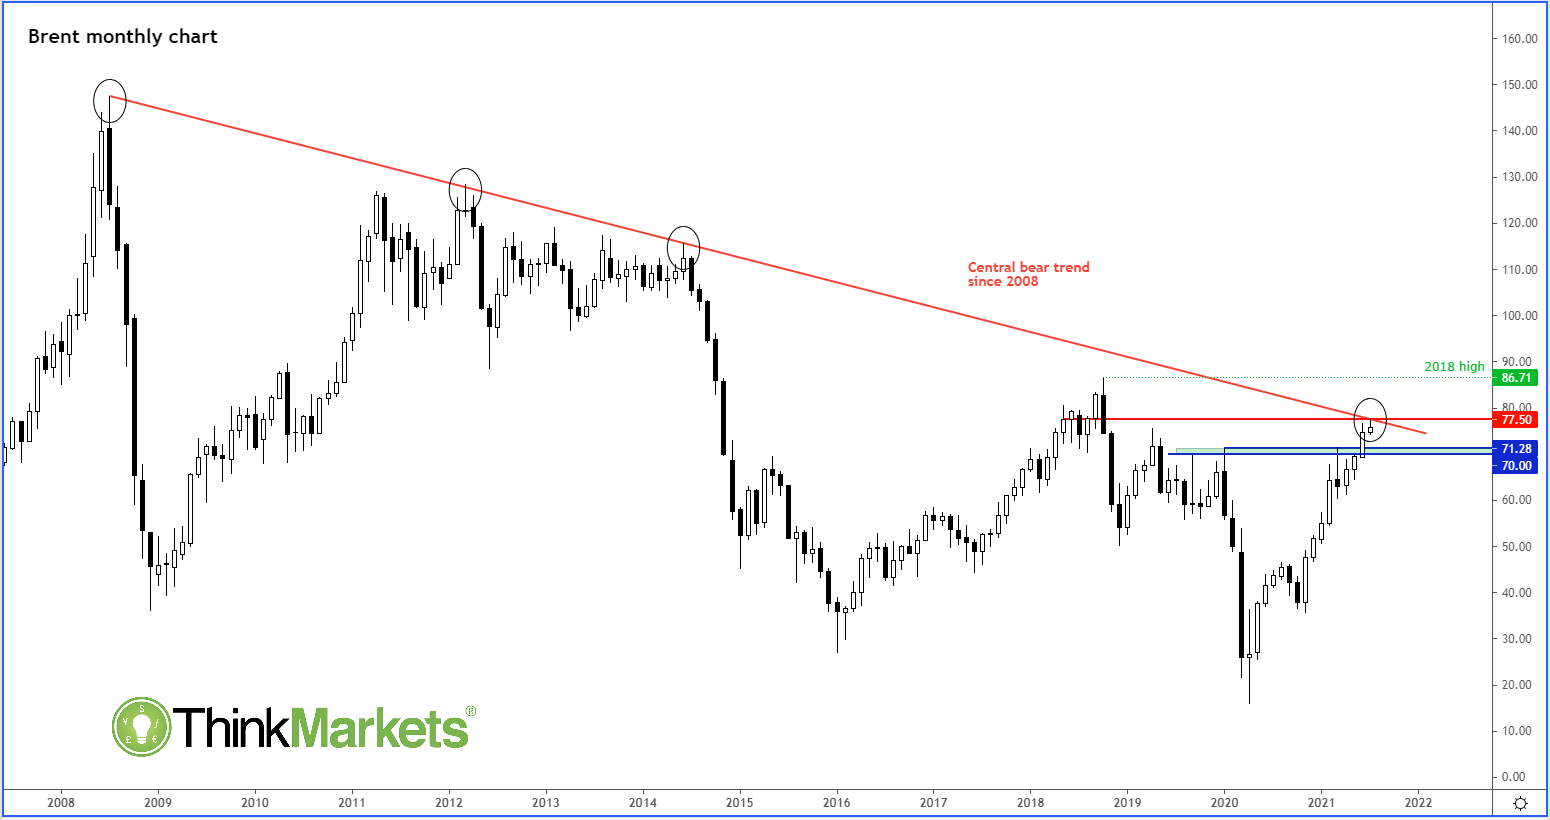 Source: ThinkMarkets and TradingView.com
It is possible that we may see a big breakdown from here as OPEC supply is slowly restored to offset the strong demand.
Meanwhile the daily chart shows a potential bearish signal after forming a bearish engulfing candle on Tuesday:
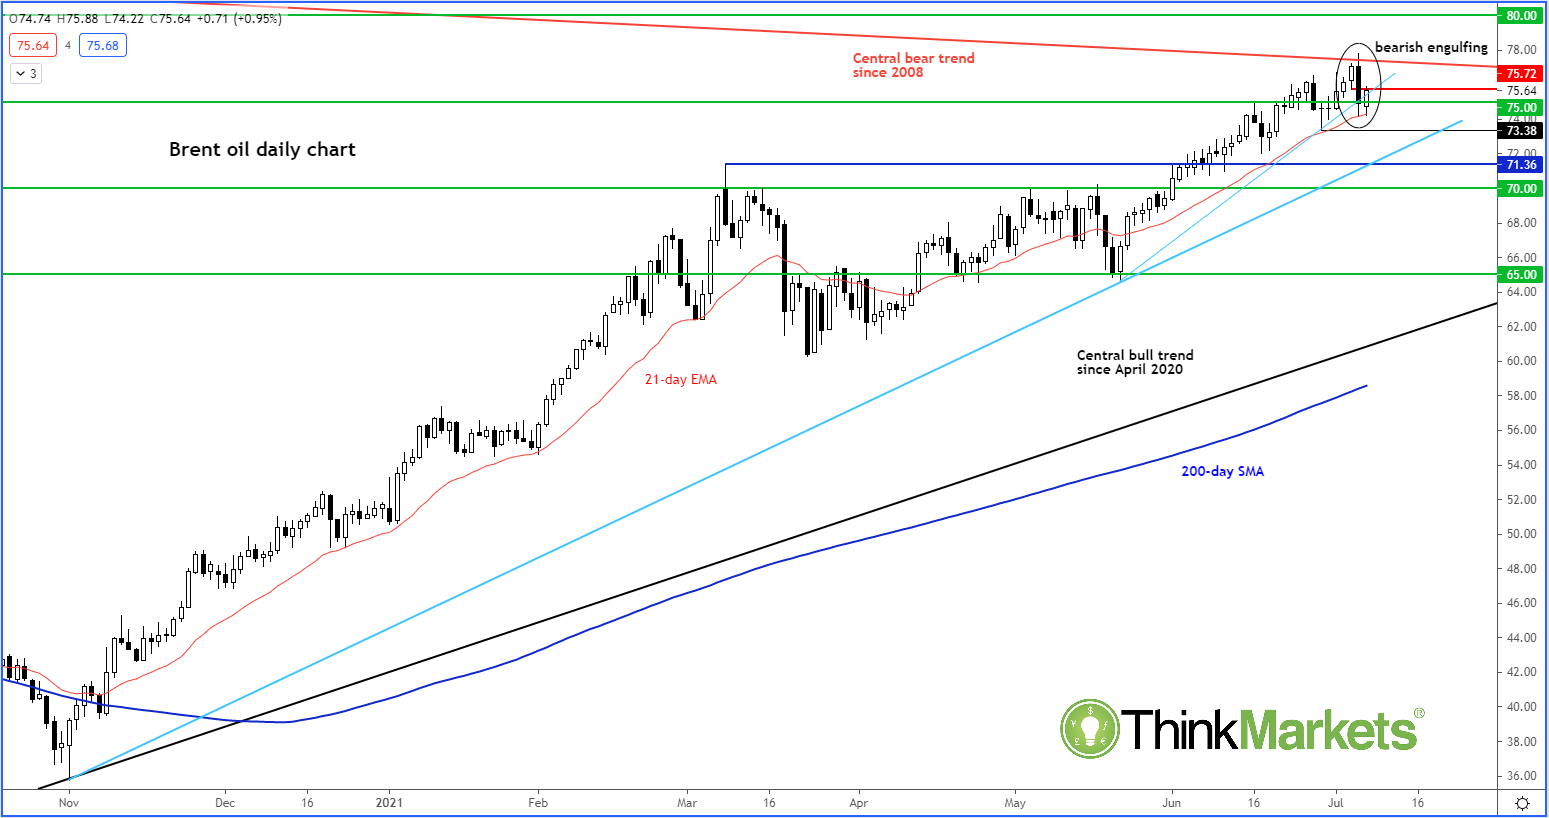 Source: ThinkMarkets and TradingView.com
This candle pattern shows sellers overtook the buyers and pushed prices aggressively lower. Potentially, the momentum may have already turned at this key technical juncture around the $75-$77 area.
At the time of writing, Brent oil was testing the breakdown area around $75.70ish. It is possible that rates may turn lower from here in light of Tuesday’s big reversal candle.