In this article, I will discuss how you can apply technical analysis on volatile markets, with the focus being on the most volatile of all – cryptocurrencies. I will also talk about the differences and similarities between cryptos and the more traditional markets from a technical analysis point of view and share some insights into how to manage risk during periods of heightened volatility.
Crypto markets turned quite volatile in the middle of the week starting May 17, 2021, as investors weighed several conflicting factors. Tesla’s U-turn on accepting Bitcoin as a form of payment for its electric vehicles added to worries over tighter regulation and environmental concerns, while China’s decision to step up its efforts to crack down on Bitcoin mining and trading also weighed heavily on prices. But the recent growth in institutional interest meant investors were keen to buy the latest dip again. As a result, prices swung wildly, providing plenty of tradable opportunities.
If you missed out on that volatility, you are at the right place. This article will help you prepare to take advantage of the next round of prices swings.
Trading volatile market conditions can sound scary, especially for inexperienced traders. But don’t let this fear prevent you from taking on quality trade setups that tend to appear abundantly inside these big swings. You just need to make a few adjustments in terms of time frames, position sizing and placement of stops in order to take advantage of the volatility. This is especially the case when it comes to trading Bitcoin and other cryptocurrencies, as they tend to have much wider daily ranges when compared with the more traditional asset classes, such as the FX market.
Smaller position size, wider stops
Before we discuss how to analyse and enter into trades when the markets are volatile, let’s talk about something really important first: risk management.
To compensate for potentially absorbing larger-than-normal price swings when market conditions are not calm, one of the easiest ways to decrease your risk is by reducing your position size; for example, by half. This will help you stay objective and not get emotionally attached to a trade, which can lead to all sorts of mistakes.
If in normal circumstances your stop loss order is, say, 100 pips or points away from entry, by reducing the position size by half you can now afford a 200-pip stop loss for the same percentage risk of your account. This does not mean you can be more relaxed about the entry requirements to get into a trade, but by buying near support or selling near resistance, you can drastically minimise the risk of being prematurely taken out by market noise, when you have a wider stop loss. By reducing your position size in half, you can always add more later should you need to.
How to look for trade setups in volatile conditions
One of the simplest, yet effective, ways of analysing and trading active markets is by studying price action on the lower time frames and taking decisions based on how prices react around key support and resistance levels. We will look into this further shortly, but first let’s talk about the higher time frame setups in the context of volatile market conditions.
If you are picky with your trade selection and manage the risk appropriately, you could get into some very good position trades using the higher time frames such as the daily chart. But one key disadvantages of trading the higher time frames during periods of heightened market volatility is that the stop-loss location may have to be much wider than normal. This also means that, because of the wider stop loss, the profit target would have to be far enough to make taking the trade worthwhile. The issue with this is that by aiming for too optimistic a target, it may mean the target may be missed or you risk remaining stuck in a trade far longer than normal, tying up your trading and emotional capital which could have been put to better use elsewhere.
Still, by studying the higher time frame charts before zooming into smaller time frames, you will get a sense of the directional bias and where the key battle grounds are. You may also be able to spot a few very good trading opportunities straight from the daily chart. To illustrate this point, take a look at the daily chart of the ETH/USD in figure 1.
Figure 1: ETH/USD Daily chart shows key battle grounds and trade ideas
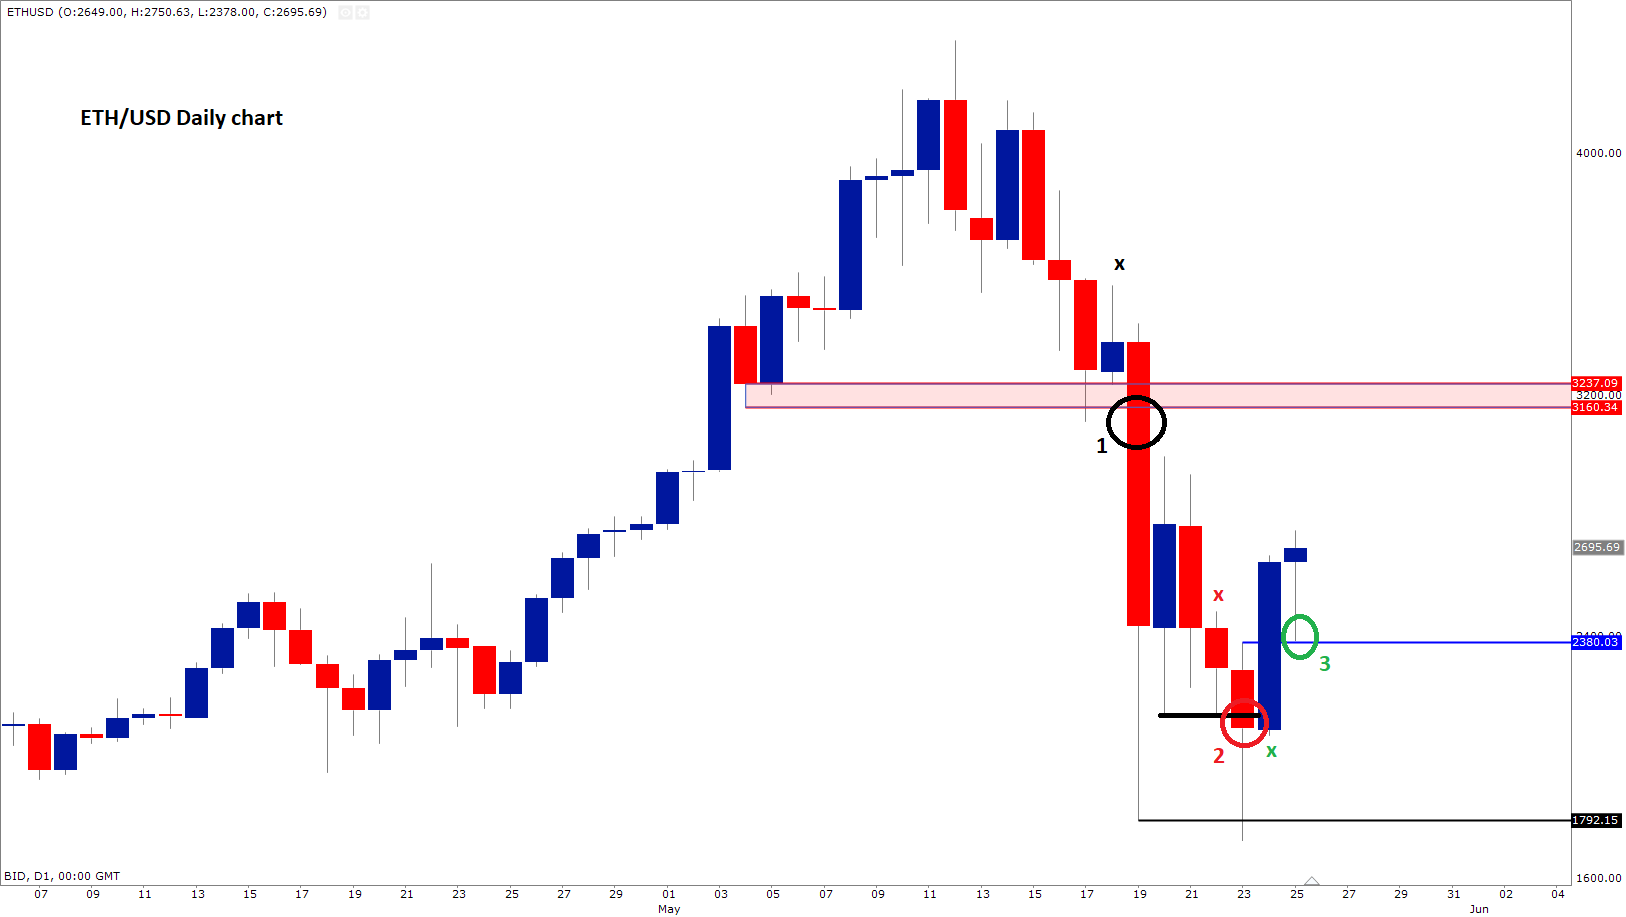
Source: ThinkTrader
As per the chart, Ether broke down and there were at least a few trade setups that could have been taken straight from the daily time frame. Let’s discuss these:
- The area between $3160 to $3237 was previously a key technical support zone, where prices had bounced there on a few occasions. As circled on the chart, once this support area gave way, prices went down sharply. You could have traded the breakdown here in two different ways. First, if you were anticipating the big down move the day before, you could have placed a sell stop entry order below the blue candle that had been formed. The rationale for getting on board this way is that with price bouncing at support, this was likely to attract a lot of traders buying on the next day, who would have presumably placed their (sell) stop-loss orders below the low of the bullish-looking candle. The cluster of sell stop orders below this zone meant that in the event of a failure of price going higher, we could see a sharp move lower. Indeed, that’s exactly what happened as those sell stop orders were tripped, triggering follow-up technical selling. Alternatively, you could have waited for price to break below support and then sold with a market order (or a limit order on the first rounded retest). In both cases, your invalidation level for a short setup would have been the high of the bullish candle that had been formed the day before, for if price had breached that level again, it would have nullified any bearish bias.
- Another short example is circled at point 2 on the chart. The black line shows ETH had found some support for a few days, but as there was no immediate kick-back rally, prices broke lower again. You could have got on board the same ways as the first example, with your buy stop-loss order being above the high of the previous day’s candle. Your target in this case could have been the liquidity (that is, resting orders) sitting just below the initial low at $1792.
- The first bullish trade after prices broke down is circled at point 3, showing you how to buy the dip. After ETH/USD refused to stay below the $1792 swing low on the second test, a hammer candle was formed and there was bullish follow-through on the next day, which took prices above the hammer head on a closing basis – thus confirming the bullish reversal. On the third day, you could have bought the dip back to the high of the hammer at $3280 (circled in green), placing your stop below the low of the daily thrust candle that was formed the day before (active traders could have had a much tighter stop loss below support at point 3 on the chart, which underscores the need to look at smaller time frames during volatile periods). As you can see, ETH bounced nicely from that $3280 as a previously resistance level turned into support.
Zooming in for closer action
Now if you are willing to trade more actively, especially during times of heightened volatility, you will need to zoom in to lower time frames. Let’s discuss how to look for intraday setups on the 15 min chart of Bitcoin, in figure 2, showing price action from the middle of May 2021, when cryptos sold off and then rebounded equally sharply.
Figure 2: Bitcoin 15 min chart
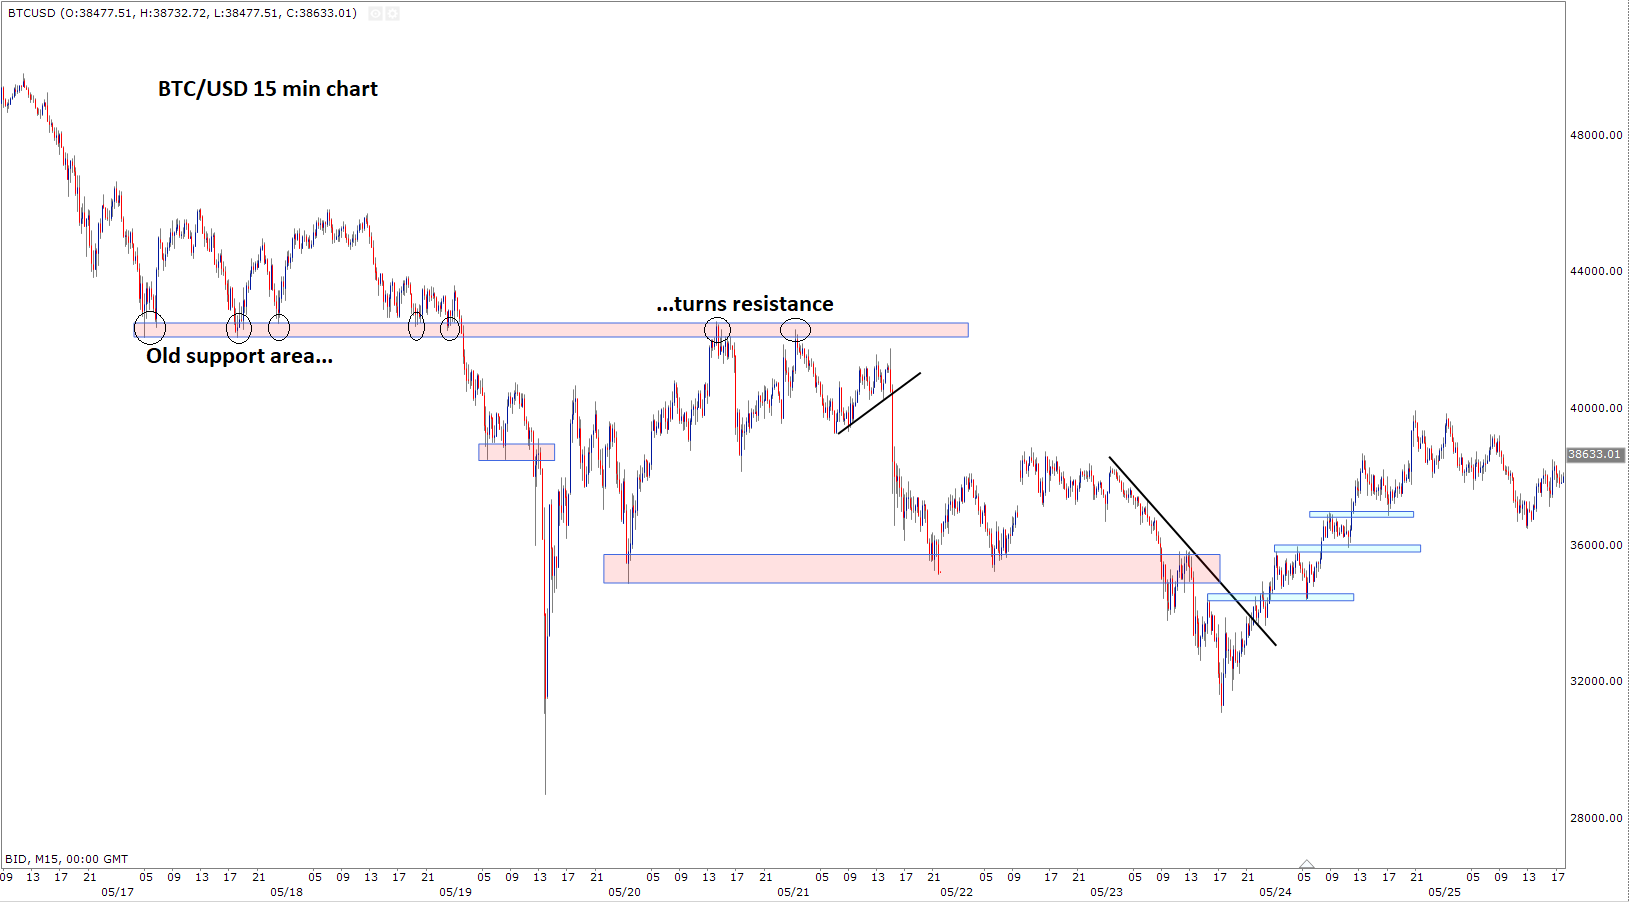
Source: ThinkTrader
There are so many ways to trade but one of my favourite strategies is studying pure price action, with no or very few indicators. The most obvious trades appear once a key resistance or support level, such as the area shaded on the chart, breaks. In this case, what I would look for is to sell the first rounded re-test of that level. In this example, it took Bitcoin a few days to return to that area where it twice offered selling opportunities, before resuming lower. Similarly, once the lower support area broke down, the first re-test of that zone offered a good bounce, before ultimately prices started trending higher.
Eventually, the selling pressure waned, resulting in the break of the bearish trend line. Once this trend line broke down, you can see by the blue shaded areas that the prior resistance areas then started to turn into support. Those first re-tests of broken resistance levels are where you could have bought the subsequent dips.
You will see plenty of these support-turned-resistance or resistance-turned-support levels on the intraday charts, especially when prices are moving rapidly.
Final words
So, you can see how using basic support and resistance, as well as trend lines, one can spot plenty of trading opportunities during a volatile market period. One of the biggest advantages of trading volatile markets is that you will get lots of sharp, two-way, moves, offering both the bulls and the bears plenty of tradable opportunities. But trading on the lower time frames is not easy, especially when prices are moving rapidly. This does require you to be nimble and stay highly focused. You can help yourself by keeping the position size small, and by remembering to buy as close to support and sell as close to resistance as possible. Doing this, you can turn the increased volatility to your advantage.
Any opinions, news, research, analyses, prices or other information contained on this website is provided as general market commentary and does not constitute investment advice. ThinkMarkets will not accept liability for any loss or damage including, without limitation, to any loss of profit which may arise directly or indirectly from use of or reliance on such information.

Learn and earn more today.
Visit our Education Centre