Here is a quick analysis on the chart of the S&P 500 showing the index is testing a KEY resistance level.
below we have the daily chart of the S&P 500 showing the index is again running into some offers circa 3025 pivotal level. This was previously a massive resistance level and over the past couple of days it has shown some reslience again. It is worth watching to see if the bulls can reclaim this hurdle or we close below it again and the 200-day moving average. Today's close could determine the short-term bias for next few days: bullish if we close near or above 3025, bearish otherwise. For more analysis, read our mornng update HERE.
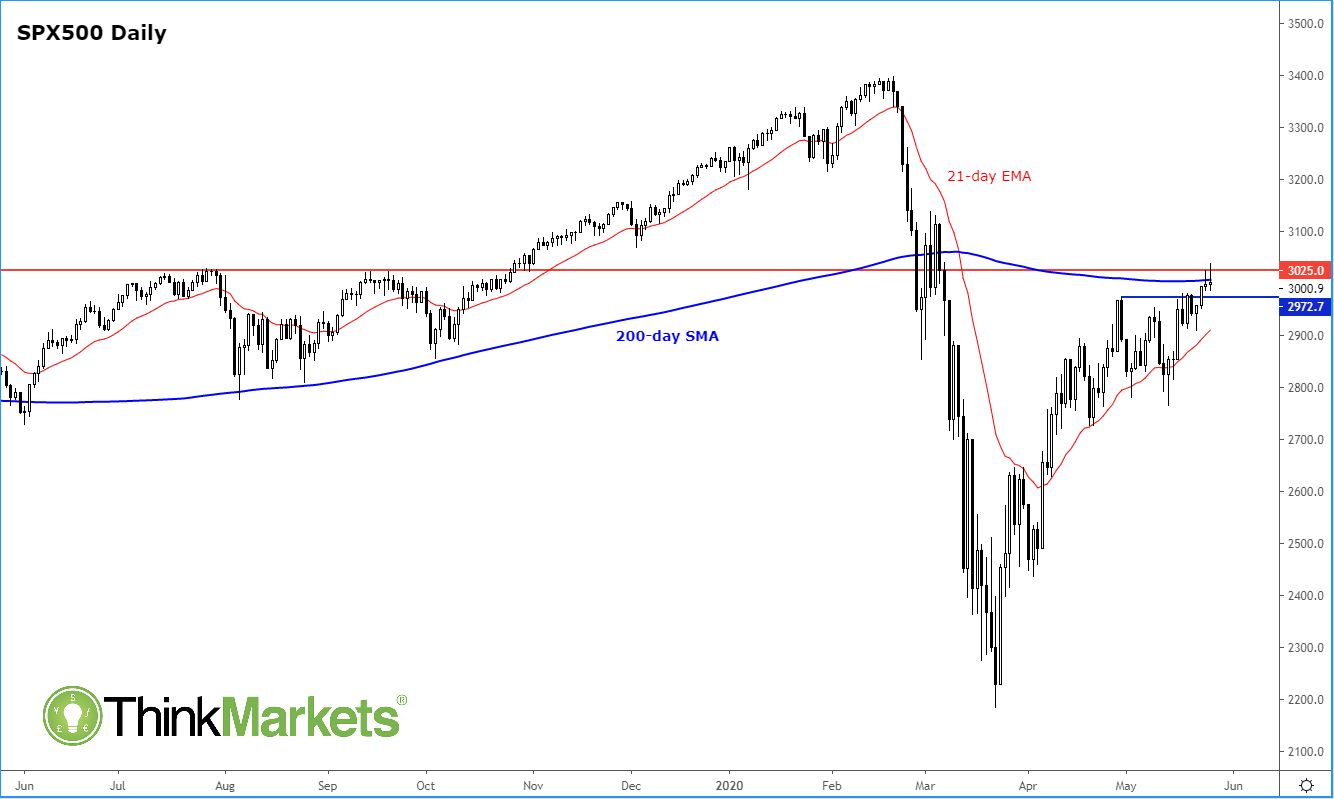 Source: TradingView and ThinkMarkets
Back