Economic Data Releases
The German unemployment data (Nov) released earlier at 5.6% has come in higher than the previous and the expected 5.5%. Meanwhile, the Eurozone headline inflation level (Nov) data released at 10% has come in lower than the expected 10.4% and the previous 10.6%.
Looking Ahead
Markets expect the US GDP (Q3) data at 5:30 pm UAE time then the speech of the Chairman of the Federal Reserve, Mr. Powell, at 10:30 pm.
Indices and Bonds Yields
The US equity futures with the European indices rallied on rumors of a possible zero-covid exit plan, as the Chinese authorities pledged to increase the distribution of the Coronavirus vaccine (which is considered a decisive step to accelerate the economy’s reopening). Additionally, investors await the Fed Chair’s speech about the US economy and labor market to find out more about the central bank’s expected monetary policy.
The US two years yields at 4.47% remained higher than the 10 years treasury yields at 3.68%. A negative spread in favor of the shorter bonds yield reflects a yield curve inversion and highlights that the US economy is heading into a recession.
Major FX Currencies
The US dollar price fell as the stronger risk appetite moved investors away from the greenback. Nevertheless, it is highly expected that the Fed Chairman’s speech to come in line with the Fed members’ hawkish statements and support the US dollar price, at least until the PCE and the NFP data releases this week.
Technically, the US Dollar Index price rebounded on multiple occasions from 105.42 eying a test of 108.11. On the other hand, a daily close below 105.42 could entice traders to press the index toward 103.83.
The euro price benefited from ECB board members’ hawkish statements that warned against slowing the pace of monetary tightening policy. The European inflation data released today boost the case of hiking interest rates by 50 bp instead of 75 bp in December’s meeting.
Commodities
Gold prices stabilized above $1,750/oz benefiting from the recent US dollar and the 10-year bond yields retreat.
Technically, a daily close above 1765 may embolden traders to rally the price towards 1789 and 1807 respectively, while a daily close below 1747 opens the door for a further decline toward 1720 and 1705.
The oil price rallied as data showed a big drop in the US oil inventories, while investors weighed the Chinese demand outlook and the EU negotiations to impose a price cap on the Russian oil.
Technically, the WTI crude price has broken above 79.82 therefore, a daily close above this could send the price even higher towards 85.15 while a daily close below 79.82 signals a retreat toward 74.97.
Chart of The Day: EUR/USD Daily Price Chart
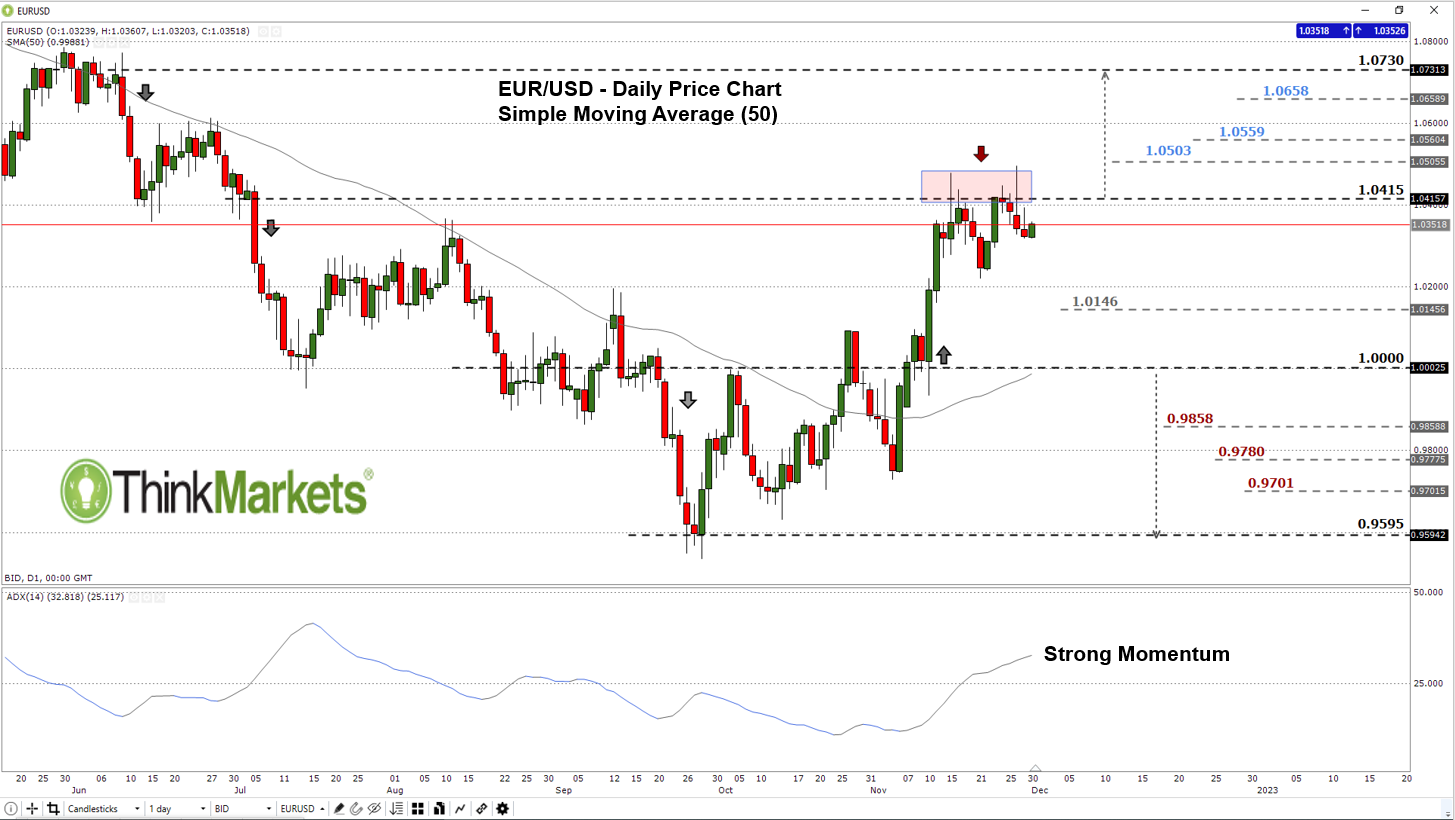
Chart Source: ThinkTrader
On November 2nd, the EUR/USD started an upward trend creating higher highs with higher lows. Later, the bullish trend's momentum slowed down slightly, as the price failed on multiple occasions to close above 1.0415.
Currently, the pair moves in the area between 1.0000 – 1.0415, and a daily close above the high end of it could encourage traders to rally the price towards 1.0730. However, the resistance levels located at 1.0559, and 1.0658 should be monitored. Otherwise, the price could retreat toward the parity level while below the high end of the area. However, the support levels at 1.0146 and 1.0112 should be watched closely.
Any opinions, news, research, analyses, prices or other information contained on this website is provided as general market commentary and does not constitute investment advice. ThinkMarkets will not accept liability for any loss or damage including, without limitation, to any loss of profit which may arise directly or indirectly from use of or reliance on such information.

Learn and earn more today.
Visit our Education Centre