 UK
UKArticles (53)
What is a pip in forex trading?
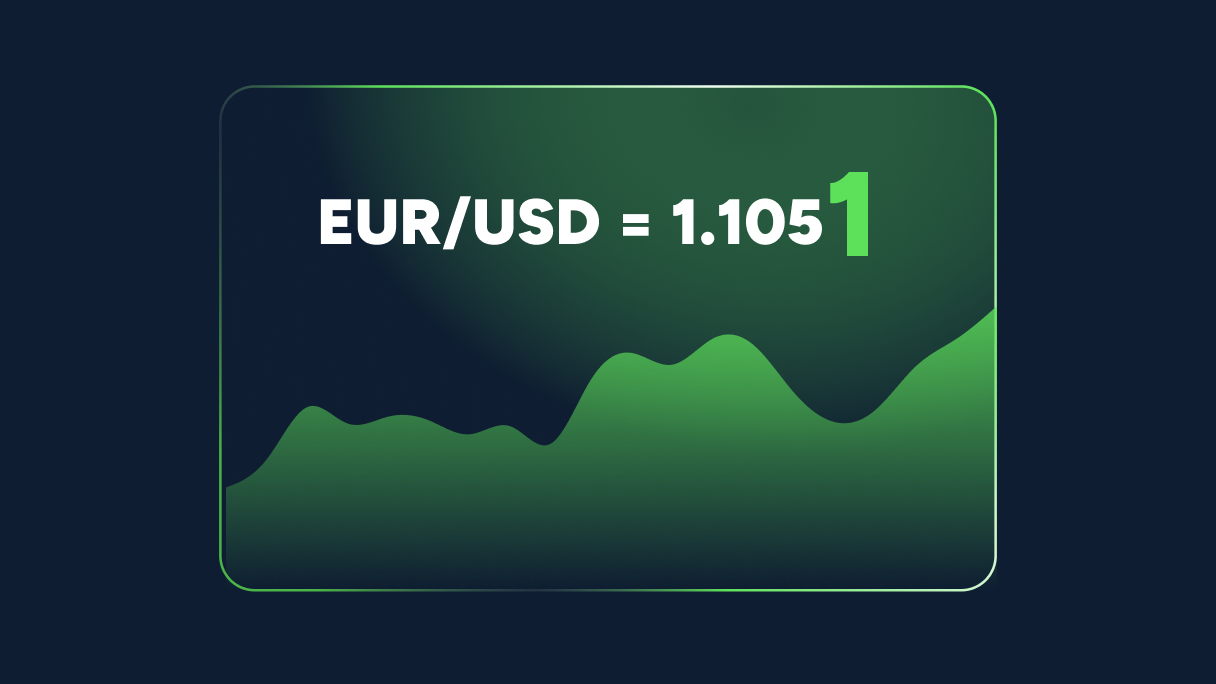
<h2>What is a pip?</h2> <ul> <li>A "pip" is the smallest whole increment in any forex pair.</li> <li>For pairs quoted in 3 decimal points a pip increment is based on the second decimal.</li> <li>For pairs quoted in 5 decimal points a pip increment is based on the fourth decimal, like the EUR/USD below.</li> </ul> <p><img alt="pips" src="/TMXWebsite/media/TMXWebsite/pips_1.png" /><br /> </p> <h2>Example</h2> <ul> <li>EUR/USD: A movement from 1.362(9)8 to 1.363(0)8 is a 1 pip move</li> <li>In USD/JPY, a movement from 104.4(7)1 to 104.4(8)1 is 1 pip</li> </ul> <p>So how much is a pip worth? This is determined by the currency of your account, the pair you are trading and the position size of your trade.</p>
How to Understand Forex Trading Signals
Forex signals are popular with beginner traders to improve their success rate and enrich their trading experience. Trading signals are generated either by a human analyst or trader or an automated platform on a forex signal service. <h2>What are forex signals?</h2> <p dir="ltr">Forex signals serve to <strong>determine the right forex trading opportunities at the right moment.</strong> By its very nature, a forex signal refers to a trading idea centred around a particular <a href="/en/forex-trading/">currency pair</a>, which should be implemented at a predefined price and time. </p> <p dir="ltr">Regardless of your trading expertise, using forex signals can significantly improve your trading performance. Furthermore, expert traders can utilise forex signals to expand their profitability scope and experience. </p> <p dir="ltr">As for novice traders, forex signals offer advantages as they allow them to make a profit while still gaining knowledge about the world of trading with currencies. Using the signals, traders can also speed up the learning process because it helps them gain full insight about which trading options the signal is built on.</p> <p dir="ltr">It’s very important to know that a trading signal is useful only when used at the right time, especially in a volatile market such as forex. On the other hand, a signal can easily become useless if a trader gets it too late. </p> <p dir="ltr">To make sure traders receive trading signals at the right time, providers send the signals through multiple communication channels like SMS, e-mail, push notifications. Another option is to <a href="/en/platformoverview">download platform add-ons</a> that allow traders to receive their signals directly on their trading platform. Some traders use social-trading communities to receive relevant forex signals.</p> <p dir="ltr">Simply put, f<strong>orex trading signals</strong> represent essential need-to-know info related to the market. In a lot of ways, a forex signal represents an immediate update that traders can incorporate into the trading decisions they execute. </p> <h2>Types of forex signals</h2> <p>Although a lot of signal services share some features, there is no universal signal service. In this article, we cover the four most common forex signal services.</p> <h3>Manual vs automated forex signals</h3> <p dir="ltr">This service is categorised based on the way the signals are generated. A manual Forex signal is created by an individual who’s usually an analyst or an experienced trader. This is because with <em>manual signal trading</em>, the trader has to make the final decision and the human intelligence factor plays a major role.</p> <p dir="ltr">In contrast, automated trading signals are created by a computer or software that monitors and analyses price action based upon coded algorithms. </p> <p dir="ltr">The main benefit that comes with the automatic signal trading route is that it excludes emotion and provides increased execution trading speed. However, it also has a disadvantage because you rely very much on a computer, system, or individual and it excludes the decision-making process.</p> <p> </p> <h3>Paid vs free forex signals</h3> <p>This category is based upon the price of a signal service operator. Just as their name states, free forex signal providers offer signals without requesting payment, while paid forex signal providers offer signals but require money for that service. The latter category usually requests one-time payments or monthly subscriptions.<br /> </p> <h3>Entry vs exit forex signals</h3> <p dir="ltr">This is a category based on the amount of detail of a trade suggestion. There are signal services that provide only entry signals, that tell a trader when to enter the market, and there are other providers that offer only exit signals that tell traders to close their open position. </p> <p><br /> Most of the time this concerns long-term forex trading signals on financial products that trend for extended periods of time. <strong>When it comes to short-term trading signals</strong>, a trade idea usually takes into account both entry and exit signals.</p> <h2>What is copy trading?</h2> <p dir="ltr">Copy trading is a type of trading that became incredibly popular over recent years because it lets new traders make a profit. As a matter of fact, there are more and more traders who develop the <strong>“people-based” </strong>portfolios where the idea is to invest in other investors who conduct the trades for you, instead of trading currencies yourself. </p> <p dir="ltr">There are a number of ways copy trading can be performed <a href="/en/platformoverview">based on the platform you select</a>. Whatever the platform, the main idea is the same - invest a part of your portfolio in a specific trader and copy all of their trades in a percentage-based way. </p> <p dir="ltr">Keep in mind that most platforms <strong>don’t allow investing over 20% of your portfolio</strong> in a single trader, in order to encourage portfolio diversification. This is actually an efficient policy as sometimes investors appear more skilful than they actually are or they go through a rough streak. That’s why it’s wise not to have too much of your portfolio invested in one trader. </p> <p dir="ltr">When it comes to monitoring graphs and statistics, copy trading is just like normal trading. However, the main difference is that in copy trading you’re monitoring actual people rather than market moves. That’s why it’s of utmost importance to check a trader’s portfolio before copying them. Learn about their strategy, track record as well as risk management strategies they use. </p> <p dir="ltr">One thing is for sure, copy trading is great for novice traders. It’s an easier way into the world of trading and it will let you make some money by generating trading opportunities from successful investors. Even if you start losing, you can’t lose everything thanks to the portfolio diversification policy. </p> <p dir="ltr">Remember that no type of trading guarantees success, but at least it’s a great way to gain trading experience. It’s a great way to learn about trading since you’re learning from more experienced and successful traders.</p> <h2><!--%3Cmeta%20charset%3D%22utf-8%22%20%2F%3E--><b id="docs-internal-guid-42451160-7fff-d07b-57ab-cb71aaea856b">Who provides forex signals?</b></h2> <p dir="ltr">As we’ve already mentioned, there are manual and automated signal providers. Manual providers are usually more experienced traders, market analysts and strategists. Manual providers provide trading opportunities that are derived from their trading experience, fundamental and technical analysis expertise as well as their trading strategies. </p> <p dir="ltr">On the other side, automated signal providers refer to computer software that is developed to create trading instructions when specific set parameters or conditions appear in the market.<strong> Expert Advisors (EA)</strong> is an example of automated signal providers as it utilises technical analysis techniques that are based on forecast indicators,<a href="/en/trading-academy/forex/sma-indicator"> </a><a href="/en/trading-academy/forex/sma-indicator">such as Moving Averages</a>, <a href="/en/trading-academy/forex/analysis-fibonacci-ratios">Fibonacci Levels</a><a href="/en/trading-academy/forex/analysis-fibonacci-ratios">,</a> and Stochastics. </p> <p dir="ltr">Alternatively, there are also other automated signal providers that use <a href="/en/trading-academy/forex/fundamental-analysis">fundamental analysis</a> methods, including monitoring economic news releases and market sentiment. You may prefer automated signal providers to manual signal providers, or the other way around, depending on what you are looking for. </p> <p><br /> You can also find platforms that collaborate with third-party signal providers for free on a daily and weekly basis through market review and analysis.</p> <p dir="ltr">One of the largest auto-trading communities in the world that’s worth mentioning is <strong>MQL5.</strong> Anyone can become a signal provider in this community, however, there are a number of conditions to fulfill to make sure you can subscribe to a signal provider that will suit your requirements. MQL5 assesses the confirmed trading results of all providers and rates them. </p> <p dir="ltr">Additionally, you are able to use different filtering options that will let you choose your preferred signal providers based on their percentage development, drawdown and manual or algorithmic trading. </p> <p dir="ltr">Also, this community will warn you about any provider that still hasn’t delivered enough forex signals or about new signal providers whose successful results could have happened by chance. Once you’re subscribed to an MQL5 signal provider, you will be able to copy trades of the trader you’ve selected.</p> <p> </p> <p> </p> <h2>How to use forex signals</h2> <p>First things first, make sure you choose a good broker. Reliable brokers use trustworthy platforms that are very important for providing signals in a reliable manner.</p> <p dir="ltr">Next, choose a proper provider. This is actually a more difficult task than it seems, even though there is a high number of choices for traders who want to use forex signal providers. This is one of the most important steps because executing trades based on unreliable signals can result in massive losses. You’re putting a lot of faith in the provider, so make sure you choose wisely. </p> <p dir="ltr">That’s why you should conduct a detailed research about available signal providers and choose a provider with a high reputation and reliability. </p> <p dir="ltr">Before you settle and choose a provider, learn about their trading performances and strategies. There are signal providers that offer a free trial period which you can subscribe to at a later stage in case you’re pleased with the results. </p> <p dir="ltr">When it comes to automated strategies, you can usually conduct backtesting to see how the computer would have done in various market circumstances. Also, testing signal providers <a href="https://portal.thinkmarkets.com/account/individual/demo" target="_blank">on a demo account</a> before risking real capital would be a wise thing to do. </p> <p dir="ltr">It’s also important to know that there are<a href="/en/platformoverview"> </a><a href="/en/platformoverview">trading platforms</a><a href="/en/platformoverview"> </a>that offer high customisation features which can really make the difference since not all signal providers will enrich your trading experience. A customisable platform will make sure you can adjust a reliable signal to your investment objectives and aspirations. </p> <p> </p> <p>Don’t forget trading with currency pairs can be short-term or long term. Short-term signals are used in day and intraday trading, while long-term signals are used for several days. Keep in mind that these signals are time-dependent so make sure you make use of a signal as soon as you get it. </p> <p> </p> <h2>Key takeaways</h2> <ul dir="ltr"> <li role="presentation">Trading signals are generated either by a human analyst or trader or an automated platform supplied to a subscriber of the forex signal service.</li> <li role="presentation">Forex signals offer advantages as they allow traders to make a profit while still gaining knowledge about the world of trading with currencies.</li> <li role="presentation">Copy trading allows for investing in other investors who conduct the trades for you, instead of trading currencies yourself. </li> <li role="presentation">There are signal providers that offer a free trial period which you can subscribe to later if you’re pleased with the results. </li> <li role="presentation">Always conduct backtesting to check how the computer would have done in various market circumstances.</li> </ul>
.png?ext=.png)
Ways to use the Relative Strength Index (RSI)
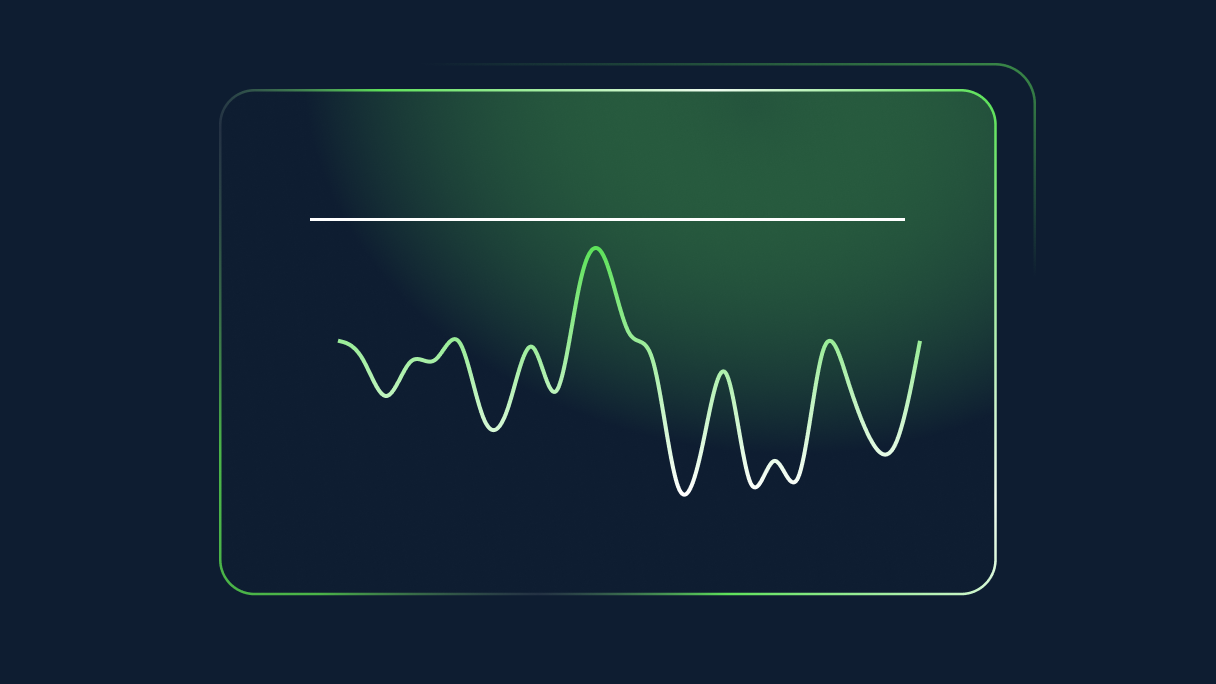
<p dir="ltr">The relative strength index, or RSI for short, is one of the most popular technical indicators among the trading community. It belongs to the family of oscillators, or technical tools used to determine overbought or oversold conditions. It’s used to gauge the market sentiment.</p> <p dir="ltr">Developed by J. Welles Wilder, the RSI measures the speed and change of price movements. A popular way of reading RSI values is to look for divergences that occur when a new high or a new low of the price isn’t confirmed by the RSI readings.</p> <h2 dir="ltr">How it works </h2> <p dir="ltr">The RSI is a <em>momentum indicator</em>. As such, it displays on a vertical range of 0 to 100. Readings close to 0 are viewed as “oversold”, while those closer to 100 are a sign of “overbought” market conditions. Unlike some other momentum indicators, readings can’t go below 0 or higher than 100.</p> <p dir="ltr">According to Wilder, the relative strength index formula is as follows:</p> <p dir="ltr">RSI = 100 – [100 / (1 + (Average of Upward Price Change / Average of Downward Price Change)]</p> <p dir="ltr">When the RSI displays readings higher than 70, it means the market is trading in the overbought, or overvalued, territory. On the other hand, a dip below 30 reflects an oversold market condition. </p> <p dir="ltr">These two levels, 70 and 30, are the default values that can be modified as per the trader’s preferences. Some traders prefer to have values set at 80 and 20 to decrease the number of trips into the overbought or oversold territory and increase the effectiveness of the RSI.</p> <h2>Strengths and weaknesses of the indicator</h2> <p dir="ltr">In general, the RSI is considered to be an effective and useful technical indicator. It generates signals that are used by a trader to paint the full picture pertaining to market conditions. As such, the RSI is the strongest when the market shifts from bullish to bearish periods.</p> <p dir="ltr">The RSI, though, has its limitations and weaknesses, same as any other indicator. Arguably, its biggest limitation is that an asset can trade for a long period of time in an overbought or oversold territory and still continue to make new highs and new lows.</p> <p dir="ltr">For this reason, you should always cross-check signals from the RSI and compare them with other technical indicators. Overbought or oversold market conditions may overlap with signals from other indicators, creating a confluence of resistance/support with enough justification to open a trade. </p> <p dir="ltr">To illustrate an overbought market, take a look at the EUR/USD daily chart:<br /> <br /> <img alt="" src="/TMXWebsite/media/TMXWebsite/Overbought-signal-RSI-pic-1.jpg" /><br /> <br /> </p> <p dir="ltr">The pair had been trading into an uptrend, which makes the RSI cross into the overbought territory above 70. Despite the overbought market conditions, EUR/USD creates three additional bullish candles, pushing the price action almost 400 pips higher from the moment the RSI crossed 70.</p> <p dir="ltr">Experienced traders tend to say that whenever the market is overbought or oversold, it can always be more overbought or more oversold. For this reason, it is not advised to open a trade that is based only on the RSI values, since they generate false signals. </p> <br /> In order to get more familiar with the relative strength index, its strengths and weaknesses, you may want to use the MetaTrader 5 trading platform. You can access the latest version <a data-di-id="di-id-50880195-98f211af" href="/uk/metatrader5"><u>here</u></a>. On this platform, you can use the historic price action to analyse the behaviour of the RSI and the signals it generates. <h2>RSI divergence signals</h2> <p dir="ltr">The relative strength index also generates divergence signals, either bullish or bearish. The bullish RSI divergence occurs when the price action creates a new low, or a lower low, while the RSI diverges from the price action and creates a higher high. This way, the RSI leads the price action and it signals that the potential bullish reversal may take place soon. </p> <p dir="ltr"><br /> On the other hand, the bearish divergence occurs when the price action is still trading in an uptrend, but the RSI has already started to come off the highs. As a result, the RSI signals the impending bearish reversal in the price.<br /> <br /> How to trade the RSI In order to avoid trading the false signals from the RSI, it is advised to cross-check signals against other technical indicators. In the example below, we have GBP/USD trading in an aggressive downtrend, on a daily chart.<br /> <br /> <img alt="" src="/TMXWebsite/media/TMXWebsite/Trading-the-RSI-picture-2.jpg" /><br /> <br /> </p> <p dir="ltr">Similarly to the previous example involving EUR/USD, the RSI enters the oversold territory already in the first part of the downtrend. This happens as a result of a strong push lower as the bears completely overwhelm the bulls. As a result, readings are also decreasing in an accelerated fashion. </p> <p dir="ltr">Our approach, in this case, is to use <a data-di-id="di-id-9164943b-24d004a1" href="/uk/trading-academy/indicators-and-patterns/analysis-fibonacci-ratios/"><u>Fibonacci extensions</u></a> to identify the 127.2% and 161.8% levels as potential support blocks. As you can see in the chart, a downtrend of around 1,800 pips stops at the first extension level. </p> <p dir="ltr">Once we see that the bears are losing momentum, and we have a clearly identified level as a key factor for a slowdown, we check the RSI readings to get the confirmation that the market is oversold. </p> <p dir="ltr">Given the magnitude of the move, you would expect the RSI to trade at extremely low levels. When the price action touches the 127.2% extension, the RSI trades around 15. This is not surprising given that this bearish move pushed GBP/USD towards the lowest levels since 2008.</p> <p dir="ltr">If you go to a monthly GBP/USD chart, you will see that the last time RSI was trending around the 15 mark was in 2008. Although the RSI can always go lower until it reaches 0, a reading of 15 is quite low, especially for the higher time frames.</p> <p dir="ltr">Hence, the RSI is best used as a confirmation indicator. You can also use other technical indicators, such as <a data-di-id="di-id-1f4e334f-6f4eda2d" href="/uk/trading-academy/indicators-and-patterns/sma-indicator/"><u>moving average</u></a>, Fibonacci retracements, trend lines etc., to identify important levels and then cross-check them with the RSI readings. </p> <p dir="ltr">In this particular case, we are trading against the 127.2% extension. A <u>stop-loss</u> should be placed below the extension, while a profit-taking order depends on your risk sentiment and risk/reward ratio. </p> <p dir="ltr">Practise trading of the RSI, and other technical indicators, by <a data-di-id="di-id-fd99886e-20c0aa3e" href="https://portal.thinkmarkets.com/account/individual/demo" target="_blank"><u>opening a demo trading account</u></a>. This way, you can identify trading opportunities yourself, by applying RSI and other technical indicators to better understand their co-existence, as well as to protect your capital until you feel comfortable to trade live markets.</p> <h2>Summary</h2> <p dir="ltr">The relative strength index is a momentum indicator that identifies when the market is trading in the overbought or oversold conditions. The indicator gauges market sentiment by measuring the speed and change of price movements. As such, it is best used in trending markets, and when mixed with other technical indicators.</p> <p dir="ltr">The RSI also displays bullish and bearish divergences, which happen when a new high or low isn’t confirmed by the RSI readings. Hence, divergences can lead the price action into a reversal, and generate a signal to the trader that the price may change its direction soon.</p>
How to Use the Stochastic Oscillator
<p>One of the most basic and perhaps oldest indicators used by technical analysts is the <strong>stochastic oscillator.</strong> The stochastic oscillator is an indicator that measures momentum and the strength of a trend. Essentially, its job is to analyse price movement and show how strong the price move is. </p> <p> </p> <p>The indicator measures the momentum of price, and also shows a slowing of momentum as the momentum of a financial instrument needs to slow down before changing direction. This addresses a weakness in retail trading, the fact that far too few traders pay attention to the importance of the rate of change. </p> <p> </p> <p>The stochastic oscillator is one of the more common indicators, and it’s one that you will see in a lot of analysis. However, like any other indicator it is simply a tool that you will be using to navigate through the forex markets, and like any other tool it is needed to be used in the proper settings and situations. </p> <h2>How to add the stochastic oscillator to MetaTrader charts</h2> <p>Adding the stochastic oscillator to the MetaTrader platform is very easy. By clicking on the <strong><em>Insert</em></strong> menu, you can pull down the list and click on <em><strong>Indicators</strong></em>, followed by <em><strong>Oscillators,</strong></em> and then <strong><em>Stochastic Oscillator</em></strong>. It's a common indicator, and as such it's built into the platform and there is no need to download from anywhere else.<br /> <br /> <img alt="" src="/TMXWebsite/media/TMXWebsite/Oscillator-picture-1.jpg" /><br /> <br /> The settings dialog box will pop up, and there are multiple parameters that you can change. The <strong>%K</strong> period and the <strong>%D</strong> period settings are available. The <strong>%K</strong> should be thought of as the slow value of the stochastic indicator and the <strong>%D</strong> should be thought of as the fast value of the stochastic indicator. It uses <em>a couple of moving averages</em> to measure the overall momentum.</p> <h2>Why does momentum matter?</h2> <p>Think back to your mathematics studies. One of the biggest influences in calculus is the absolute rate of change. The idea is that if the market is in an uptrend, but if the momentum starts to slow down, it can suggest that the market is running out of steam and, therefore, could be ripe for a reversal. In this sense, it can suggest whether or not the market is going to continue, or if it might be over-extended in one direction or the other, and other words <em>overbought</em> or <em>oversold</em>.</p> <h2>Using the indicator to make decisions</h2> <p>The stochastic oscillator has a multitude of uses when it comes to trading forex. We have already mentioned the most obvious use for the stochastic oscillator: the idea of identifying overbought or oversold conditions. In this scenario, the stochastic oscillator is best used in a range bound market, as it can tell you when to buy and sell in a relatively well defined situation.<br /> <br /> When you look at the stochastic oscillator window at the bottom of the chart, you see the two moving averages going back and forth in an up and down pattern. You will notice that there are two lines in the indicator window including the 80 and the 20 level.</p> <p> </p> <p>The <strong>area above the 80 level</strong> is considered to be <em>overbought</em>, while the <strong>area below the 20 level</strong> is considered to be <em>oversold</em>. Furthermore, you need to see the moving averages inside the stochastic oscillator to cross in the overbought or oversold areas in order to get a reversal signal. Anything between the two levels is essentially ignored in this scenario.</p> <p><img alt="" src="/TMXWebsite/media/TMXWebsite/Oscillator-picture-2.jpg" /><br /> <br /> </p> <p>Looking at the chart, you can see that the stochastic oscillator had several moves back and forth between the 80 and the 20 levels. However, there are only a couple of areas where the indicator either broke into the overbought area or the oversold area and had a cross. You need both of these things to happen in order for it to fire off a signal.</p> <p> </p> <p>In the graphic below, you can see that the signals fired off are color-coded by the arrows, with the red showing an overbought condition and a potential selling opportunity, and the blue showing potential buying opportunities in an oversold condition.</p> <p> </p> <p>It should be noted that using the stochastic oscillator in this way is much more reliable when in a sideways market, preferably between significant support and resistance. This makes the stochastic oscillator truly important, because statistically speaking markets are in some type of consolidation or sideways action more than 70% of the time. In other words, it’s much more common to be in this environment than it is to be out of it. </p> <h2>Measuring divergence</h2> <p>Another way that people use the stochastic oscillator in forex trading is to measure for divergence. The idea is that as with any oscillator, you could see momentum going in a different direction than the overall price. As an example, the momentum could be rising while price is falling or vice versa. If you are in a scenario where price is rising but the momentum is slowing, that means that there is less aggression to the upside and therefore less demand, even as prices press higher. This can be a sign that potential trouble is on its way. </p> <p> </p> <p>Take a look at the chart just below. You can see that there is a clear uptrend line on the four hour chart for the GBP/AUD pair. As the price was rising, though, notice that the stochastic oscillator made a <em>lower high</em>, which is the opposite of an uptrend. This suggests that the rate of change is slowing down, therefore one would have to be a bit suspicious about the efficacy of the move. </p> <p> </p> <p>After all, if there is less momentum, it suggests that there are fewer fresh orders coming in to push the market to the upside. Ultimately, you can see that shortly after the diversions with the <em>lower high</em> in the stochastic oscillator, the market broke down below the trend line and then eventually fell from those levels. Divergence can be found in several indicators, essentially the oscillator family. Because of this, using your divergence spotting skills can work in multiple other oscillators as well, as they all essentially work the same in this scenario.<br /> <br /> <img alt="" src="/TMXWebsite/media/TMXWebsite/Oscillator-pic-3.jpg" /></p>

The ascending triangle candlestick chart pattern
The ascending triangle is a bullish candlestick chart pattern that occurs in a mid-trend and signals a likely continuation of the overall trend. It’s one of the most common chart patterns as it’s quite easy to form - consisting of two simple trend lines. <br /> <br /> The price action temporarily pauses the uptrend as buyers are consolidating. This pause is marked with higher lows pushing for a breakout to the upside, which then activates the pattern.<br /> <br /> In this blog post we will discuss how the ascending triangle is formed, what the message that the market sends is, and share tips on a simple but effective trading strategy based on ascending triangles. <h2>What the ascending triangle shows us</h2> <p>The ascending trend line chart pattern is a<em> bullish formation</em>. It signals that the market is consolidating after an uptrend, with the buyers still in control. The occurrence of the higher lows is pointing toward a likely breakout as the wedge narrows down.</p> <p> </p> <p><img alt="ascending triangle - an illustration" src="/TMXWebsite/media/TMXWebsite/the-Ascending-Triangle-pattern-pic-1.jpg" /></p> <p> </p> <p> </p> <p><strong>There are three key features of an ascending triangle:</strong><br /> </p> <ul> <li><strong>Strong trend</strong> - In order for the ascending triangle to exist in the first place, the price action must stem from a clear uptrend;</li> <li><strong>Temporary pause</strong> - This element refers to the consolidation phase, which will help the buyers consolidate their strength;</li> <li><strong>Breakout</strong> - The break of the upper flat line marks the breakout, which activates the pattern. It also helps us determine the entry, take profit, and stop loss at a later stage.</li> </ul> <p><br /> Bullish continuation patterns can assume different forms - triangles, flags, pennants etc. The ascending triangle is one of the most common formations in this area, as it practically consists of two converging trend lines. <br /> <br /> As a continuation pattern, the ascending triangle is based on the idea that the likelihood of the trend continuing in the same direction is higher than the chance of a reversal taking place. The bulls are in full control of the price action, as they have been successful in pushing the market higher. <br /> <br /> At one point, the consolidation phase starts, which gives the buyers breathing space as they regroup for another push higher. These temporary pauses can take different forms, with the ascending triangle being one of them. <br /> <br /> From this perspective, it’s logical that the side that has been in control so far has a higher chance of winning the upcoming matches than the side that has been on the losing side. The period of consolidation ends once there is a confirmed breakout in the direction of a previous trend.</p> <h2>Strengths and weaknesses</h2> <p>As outlined earlier, the continuation of an uptrend takes a specific form. This form, in this case the ascending triangle, helps us define the trading environment. On one hand, a break of the upper trend line signals the continuation of the bullish trend. <br /> <br /> On the other, a move below the supporting line breaks the series of the higher highs and invalidates the entire pattern. In this case, the followup is usually a strong move lower as the buyers missed their chance to continue the uptrend. <br /> <br /> Thus, this is the main strength of the ascending triangle - it helps the uptrend to extend. Due to the existence of two trend lines, we are in a better position to determine the take profit and stop loss, if the pattern is activated.</p> <p> </p> <p>The biggest limitation of the bullish triangle, as it’s the case with other types of triangle, is a false breakout. The price action may move above the resistance line, just to return below, and hit a stop loss. In order to minimise the chance of a failed breakout, it’s always advised to consult other technical indicators and confirm the breakout e.g. volume, RSI etc. <br /> <br /> Moreover, consolidation of power takes place as the two lines converge. The narrower the wedge gets, the stronger the breakout usually is. Hence, this amount of power and strength can’t always be controlled, and therefore, it may end up in the price exploding in the opposite direction, although the chances of a continuation of the existing trend are always higher.</p> <h2>Spotting the ascending triangle</h2> <p>As said earlier, the ascending triangle is a bullish formation that occurs in a mid-trend. In the chart below, we can see how the ascending triangle looks in the live market. From an existing uptrend, the price action extends higher through the bullish triangle. <br /> <br /> Two trend lines are drawn to connect the highs and lows, with the latter closing in on the former. When the two lines get closer to one another, the likelihood of a breakout increases. Finally, the USD/CHF buyers are able to push the market outside of the consolidation phase in a clear and strong breakout.</p> <p> </p> <p><img alt="the ascending triangle on USD/CHF hourly chart" src="/TMXWebsite/media/TMXWebsite/the-Ascending-Triangle-pattern-pic-2.jpg" /><br /> <br /> As you can see in the chart above, the upper line is not exactly flat. In general, it’s extremely rare to see the upper trend line completely flat, as we will almost always see mild bias toward one or the other side. As long as the resistance line is close to being a flat one, it’s generally acceptable.</p> <h2>Trading the ascending triangle</h2> <p>Using the same example, we will now showcase how to trade the ascending triangle. As soon as there is a breakout, which is confirmed with a close above the resistance line, we may consider entering the market on the long side. As with every <a href="/uk/trading-academy/forex/japanese-candlesticks">candlestick pattern</a>, we have two options for the entry - immediately after the breakout candle closes, or waiting for a potential throwback.<br /> <br /> The black horizontal line reflects our entry position - the breakout H1 candle close. The stop loss is placed within a triangle, as any move below the upper line will invalidate the pattern. As always, make sure you leave some space to allow for a potential retest of the broken trend line. </p> <p> </p> <p><img alt="trading the ascending triangle on USD/CHF hourly chart" src="/TMXWebsite/media/TMXWebsite/the-ascending-triangle-pattern-pic-3.jpg" /></p> <p> </p> <p>The blue vertical trend line is a copy of the distance when the triangle was first formed - when two trend lines were identified. The upper end of the trend line tells us where we should consider taking our profits off the table i.e. where the ascending triangle pattern is completed. <br /> <br /> In the end, the market completed the bullish triangle formation and rotated lower. This example shows how profitable ascending triangles can be, as we risked 15 pips to make nearly 100 pips - a R:R ratio of more than 1:6.<br /> <br /> Remember, the ascending triangle helps us format the price action and identify trade details - entry, stop loss, and take profit.</p>
What is a shooting star candlestick pattern?
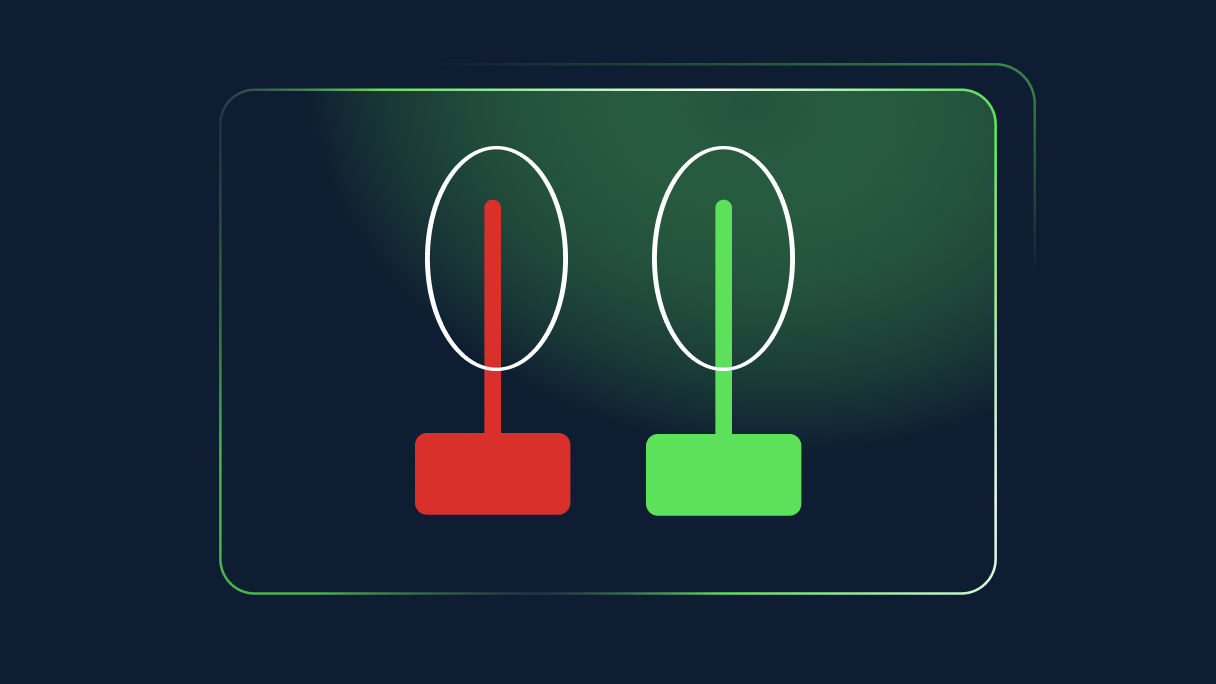
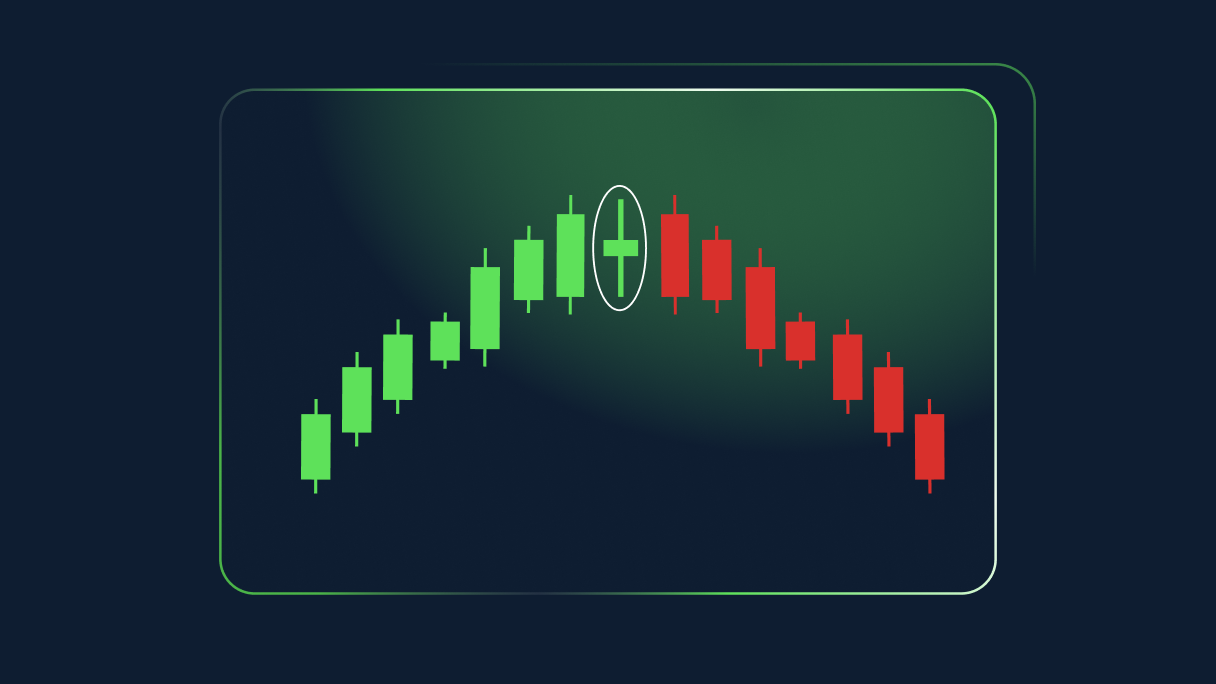
A shooting star pattern is found at the top of an uptrend, when the trend is losing its momentum.<br /> <br /> The shooting star is actually the hammer candle turned upside down, very much like the inverted hammer pattern. The wick extends higher, instead of lower, while the open, low, and close are all near the same level in the bottom part of the candle.<br /> <br /> The difference is that the shooting star occurs at the top of an uptrend. It’s a bearish chart pattern as it helps end the uptrend. The inverted hammer, on the other hand, is a bullish chart pattern that can be found at the bottom of a downtrend and signals that the price is likely to trend upward.<br /> <br /> <strong><img alt="shooting star candlestick pattern" src="/TMXWebsite/media/TMXWebsite/Shooting-star-pattern_1.jpg" /></strong> <p dir="ltr">Both the green and red versions are considered to be shooting stars although the bearish (red) candle is more powerful given that its close is located at the mere bottom of the candle. Again similar to a hammer, the shadow, or wick, should be twice as long as the body itself. </p> <p dir="ltr">In general, <em>the longer the wick the stronger the reversal</em>, since the long wick signals the inability of the bulls to secure a high close. </p> <p dir="ltr">Some traders prefer to wait and see whether the next candle is a bearish one, which will confirm that the reversal is taking place. <br /> <br /> In both cases, an occurrence of the shooting star at the top of an uptrend only generates a signal of an impending reversal and it shouldn’t be taken as a direct trading signal.</p> <h2>What a shooting star will show us</h2> <p dir="ltr">As outlined earlier, a shooting star is a <em>bearish</em> reversal pattern which signals potential change in the price direction. The uptrend is nearing its end as the momentum is weakening, and the sellers are feeling more confident that they can force a reversal in price action. </p> <p dir="ltr">For this reason, a shooting star candlestick pattern is a very powerful formation. Its shape gives the pattern a lot of attention as the wick always sticks out from the rest of the price action. </p> <p dir="ltr">This is especially the case when the wick of a shooting star is also the new short-term high. </p> <p dir="ltr">Thus, although the buyers were successful in pushing for a new high, they failed to force a close near the session’s high. Their inability is now a chance for the sellers to reverse the price action and erase previous gains. <br /> </p> <p dir="ltr">Therefore, the shooting star’s key strength is its ability to generate a reversal signal. Of course, it may not always be right, but it is considered to be effective and reliable. However, please note that this is still one signal generated by one of hundreds of technical indicators. </p> <p dir="ltr"><br /> For this reason, it is important to always cross-check the signal that a shooting star generates with other indicators, or other <a data-di-id="di-id-249ef9e4-1d3b3793" en="" forex="" href="" japanese-candlesticks="" trading-academy="">candlestick patterns</a>. For instance, in the vicinity of a shooting star there may be other formations that signal the reversal or indecision.<br /> <br /> You can try your hand at spotting the shooting star pattern along with other technical indicators using the <a data-di-id="di-id-249ef9e4-1d3b3793" href="/uk/metatrader5"><u>Metatrader 5 trading platform</u></a>.</p> <h2>How to trade the shooting star pattern</h2> <p>Trading the shooting star formation is similar to trading a hammer. The focus is on the candle itself of course, especially its wick that extends higher. In the example below, we see a AUD/USD chart that moves in an uptrend.<br /> <br /> In the middle of the chart, the price action corrects lower just to get back higher again and quickly. What follows is the fresh high in the context of a long bullish candle. If you look at this candle only, the situation looks very positive for the bulls, as there is an uptrend in action and the new high has just been posted.</p> <br /> <img alt="AUD/USD trading the shooting star pattern" src="/TMXWebsite/media/TMXWebsite/chart-2-shooting-star_1.jpg" /><br /> <p dir="ltr">However, <em>the situation quickly changes</em>. The price action moves higher again in the session, fails to create a new high, and reverses to close at the low of the session. As a result, a shooting star candle is formed. </p> <p dir="ltr">The next candle is a long bearish candle that confirms that a reversal is taking place. Ultimately, the price action retreats 250 pips lower. <br /> <br /> Whenever you decide to trade the reversal that was initiated by a shooting star, the <u>stop loss</u> should always be placed above the candle’s high. This is arguably the greatest strength of this pattern, and as it is with a hammer, it gives you a clear level to play against.<br /> </p> <p dir="ltr">Any sustainable move, with a high close, above the candle’s high, invalidates the pattern. Take-profit order is dependent on your trading style and risk management. Our advice is to consult other indicators, like <a data-di-id="di-id-3e8356ea-b9dbef8f" href="/uk/trading-academy/indicators-and-patterns/analysis-fibonacci-ratios/">Fibonacci</a>, trend lines, or moving averages, and decide whether to exit a positive trade or not.</p> <p dir="ltr">To demonstrate this, let us move your attention to a chart below. We have a NZD/USD trading sideways for the most part. In the middle part of the chart, the price action starts to move gradually higher.</p> <p dir="ltr"> </p> <strong><img alt="NZD/USD trading the shooting star pattern" src="/TMXWebsite/media/TMXWebsite/chart-3-shooting-star_1.jpg" /></strong><br /> <p dir="ltr">At one point, there is a new high in place, above the horizontal resistance. However, the buyers lose control over the price action, which initiates the pullback. A failure at important resistance/support levels is not a normal failure, it is usually much more important. For this reason, the price action rotates back lower following a failure to clear the resistance and returns to support. </p> <p dir="ltr">The upper red line shows our stop-loss, which is around 20 pips above the session’s high. Any move to these levels where our stopp-loss is means that the pair is in a breakout territory and there is no reversal. </p> <p dir="ltr">Our profit-taking order (the lower horizontal black line) is a simple trend line that shows where the pair bottomed during the previous attempt to move lower. Hence, we are looking for a pullback to the old support. </p> <p dir="ltr">In this situation, we are risking 20 pips to earn nearly 90 pips. A simple calculation shows that it is a 1:4.5 risk ratio, an extremely profitable trade. Opportunities as profitable as this one are quite rare in the markets, but this does demonstrate how powerful a shooting star candlestick pattern can be.</p> <br /> Before you start risking your own capital, you may want to consider <a data-di-id="di-id-52b20e36-40a28506" href="https://portal.thinkmarkets.com/account/individual/demo" target="_blank">opening a demo trading account.</a> This way, you will practise with virtual funds and equip yourself with an array of trading patterns and formations to apply when you start trading live.<br /> <p dir="ltr"> </p> <h2>Summary</h2> <p>A shooting star is a single-candle bearish pattern that generates a signal of an impending reversal. Similar to a hammer pattern, the shooting star has a long shadow that shoots higher, while the open, low, and close are near the bottom of the candle. <br /> <br /> It is considered to be one of the most useful candlestick patterns due to its effectiveness and reliability. <br /> <br /> The long wick extending upside signals the buyers’ inability to follow up on the earlier move higher, which provides the sellers with an opportunity to initiate a change in the price direction.</p>

The Simple Moving Average (SMA) indicator
<p dir="ltr">The <strong>Simple Moving Average </strong>(SMA) indicator is one of the most straightforward measures available to traders. <br /> </p> <p dir="ltr">It is a trend-defining indicator that isn’t necessarily made to be used in range-bound markets, but they can show you when that condition is approaching, thereby keeping you out of the market or having you switch the tools that you use.</p> <p>What is the simple moving average indicator?</p> <p dir="ltr">The simple moving average indicator is a measure of the average price over a certain amount of <a href="/uk/trading-academy/indicators-and-patterns/japanese-candlesticks/"><u>candlesticks</u></a>. <br /> </p> <p dir="ltr">For example, if the 20-day simple moving average indicator is added to a chart, it will calculate the average price over the previous 20 days. The indicator updates itself at every candlestick and creates a line that goes up and down on the chart, showing the overall flow of where the market is going. <br /> </p> <p dir="ltr">There are other versions of moving average indicators, but the simple moving average indicator is the easiest to use. You simply measure the average closing price of a certain amount of candles, divided by that many candles. <br /> </p> <p dir="ltr">This gives you the average price, and as time goes on the various levels are connected by a line, giving traders a clear view as to whether the average price is rising, falling, or simply going sideways over a certain amount of time.<br /> </p> <p dir="ltr">It can be used on any timeframe, but there are some that do tend to be used more than others. </p> <p>How to add a simple moving average indicator to MetaTrader</p> <p dir="ltr">To add a simple moving average indicator to <u>your charts</u>, click on the '<strong>Insert</strong>' menu, choose 'Indicators', and then select 'Trend', where you will find '<strong>Moving Average</strong>' on that menu. A dialog box will pop up with the title '<strong>Moving average</strong>', giving you several options. <br /> </p> <p dir="ltr">The '<strong>Period</strong>' box allows you to select how many candlesticks you wish to calculate the average price of, and then the '<strong>MA method</strong>' allows you to select which type of moving average you want to apply. In this case, you would obviously select '<strong>Simple</strong>.' You can also choose to apply to either the <em>close</em>, <em>high</em>, <em>low</em>, or <em>open</em>, but 99% of what you will see involves the close.<br /> <br /> <img alt="adding the Simple Moving Average indicator" src="https://k13-dev.thinkmarkets.com/TMXWebsite/media/TMXWebsite/adding-SMA.jpg" /></p> <p>How the simple moving average indicator is typically used</p> <p dir="ltr">The most common way this indicator is used is to determine the overall trend. Notice the red line that is sloping lower on the chart below. It shows that we are clearly grinding lower over the course of the last several days on the hourly chart in the AUD/NZD pair.<br /> </p> <p dir="ltr">The slope going lower is a function of the average price drifting lower and lower over time. Notice how at the beginning of the chart the 20 SMA was rising, but then the price broke down through the moving average to show that something had changed.<br /> </p> <p dir="ltr">Shortly after that, you’ll notice that a majority of the candlesticks were below the 20 SMA, showing that price had changed from rising over the course of the previous 20 hours to falling. <br /> </p> <p dir="ltr">This shows an overall trend change, and it gives you an idea as to whether you should be long or short a currency pair. In this case, it’s obvious that selling the Australian dollar against the New Zealand dollar was the right way to go. The moving average shows you just how right it was.<br /> <br /> <!--%3Cmeta%20charset%3D%22utf-8%22%20%2F%3E--><img alt="ALT: example of a 20 SMA trading strategy" src="https://k13-dev.thinkmarkets.com/TMXWebsite/media/TMXWebsite/20-SMA-strategy.jpg" /></p> <br /> <!--%3Cmeta%20charset%3D%22utf-8%22%20%2F%3E--> <p dir="ltr">For example, at the blue arrow you can see that the market was clearly in an uptrend and pulled back towards the 50 day EMA where we saw the market bounce significantly from that level and continue to go higher. </p> <p dir="ltr"><br /> One way that you could have looked at this is that the 'hammer' that had formed on the daily chart right at the 50 day simple moving average was a sign that buyers were finding dynamic support there. Later on, you can see that the market broke down below the 50-day simple moving average indicator, but then bounced back towards it where the red arrow shows a selling opportunity based upon a massive bearish candlestick. </p> <p dir="ltr"><br /> Later on, it tested the general vicinity of the 50-day simple moving average indicator three times where it sold off each time it got too close to it. </p> <p dir="ltr"><br /> At the very end of the chart the market closed well above the 50 day EMA and then started to rocket to the upside showing the 50 day EMA starting to slope higher, confirming than that the trend has obviously changed for the upside in favor of the Euro instead of sloping lower in favor the British pound like it had been previously.<br /> </p> <p dir="ltr">Another use for simple moving average indicators is to look for 'moving average crossovers'. This typically is used for 'buy and sell signals' and some traders even go so far as to always stay in the marketplace based upon how the signal is showing, either bullish or bearish. That being said, the simplest explanation is that you take a faster moving SMA and plot it with a slower moving SMA on a chart. In this example, we will use the CAD/CHF daily chart.</p> <p dir="ltr"><br /> On the chart, there is the red 20 day simple moving average, and the white 50 day simple moving average. </p> <p dir="ltr"><br /> In a 'moving average crossover system', the idea is that as the quicker moving average rises above the slower one, shorter-term traders are starting to come in and momentum is moving to the upside. At that point, traders will buy the market. </p> <p dir="ltr"><br /> On the other hand, when the faster moving average dips below the longer-term moving average, then it shows that short-term traders are starting to push momentum to the downside, and it becomes a sell signal. In this scenario, you buy when the indicator of the shorter time frame breaks higher, and you sell or find yourself short when the lower timeframe indicator breaks underneath. </p> <p dir="ltr"><br /> When you look at this chart, you can see the inherent problem with using this system without any type of filter. There would have been five potential losses before the market finally broke in your direction and would have had you selling into a major breakdown. </p> <p dir="ltr"><br /> One simple filter is to look at the longer-term simple moving average indicator, and what the slope is. For example, in this chart you can see that we were relatively flat for most of this, and that may have kept you out of the market as it shows that we weren’t really trending. </p> <p dir="ltr"><br /> On the final crossover, and the one that the market is currently trading, you can see that <strong>the longer-term 50-day EMA started to slope lower</strong>, and the two moving averages started to spread out, showing that there was a real divergence between the two time frames, and that momentum was picking up. </p> <p dir="ltr"><br /> In the end, quite often the simple moving average indicator is used with something along the lines of an oscillator in order to determine momentum, and possible diversions. There are other indicators people will use with it, but it seems to be oscillators are by far the most common.<br /> </p> <p>Some common simple moving averages<br /> </p> While there is no 'magic bullet', there are some common ones that are popular:<br /> <ul> <li>10-SMA, for fast moving short-term trades</li> <li>20-SMA, for slightly longer term momentum on short-term trades</li> <li>50-day SMA, which represents just a bit underneath a quarter</li> <li>100-day SMA, which represents half a year</li> <li>200-day SMA, which represents roughly one year of trading based upon trading hours</li> </ul>
MT4 tips and tricks
<h2><strong style="color:#007c8c;">Customising charts</strong></h2> <p>You can fully customise your charts with indicators, grids and period separators and can add and remove these as you see fit. Here are some useful keyboard shortcuts for easy removals:<span style="font-size: 1.425rem; line-height: 1.6; font-family: EncodeSans, Helvetica, Arial, sans-serif; font-weight: normal;"> </span></p> <h5><span style="font-size: 1.425rem; line-height: 1.6; font-family: EncodeSans, Helvetica, Arial, sans-serif; font-weight: normal; margin-top: 0px;"><img alt="" src="/getmedia/ad730baa-a9bd-415e-8ac7-4ae53466cfcf/MT4-Tips-and-Tricks-Custom-Charts_1.PNG" style="vertical-align: middle; margin-top: 0px; " /></span></h5> <p><br /> <strong><img alt="" src="/TMXWebsite/media/TMXWebsite/MT4-Tips-and-Tricks-hide-the-Bid.PNG?width=300&height=204" style="width: 300px; height: 204px; float: left; margin-top: 0px; margin-right:24px; margin-bottom:8px;" />Hiding the bid line</strong><br /> If you use a lot of technical analysis, the bid line can become rather obtrusive. To remove the bid line you can set the colour of the line to ‘None’, completely removing it from the chart.</p> <h5> </h5> <p><strong><img alt="" src="/TMXWebsite/media/TMXWebsite/MT4-Tips-and-Tricks-Setting-Default-Chart.PNG?width=300&height=489" style="width: 300px; height: 489px; float: left; margin-top: 0px; margin-right:24px;" /><strong>Setting the default chart</strong></strong><br /> Once you have a chart you’re happy with, you can save it as a template. The quickest and easiest way to do this is by right-clicking on the chart and selecting “Template”, followed by “Save Template”. You can have as many templates as you like to match all of your trading strategies.<br /> If you have a preferred template that you wish to save as your default, you can do this by right-clicking on the chart, selecting “Template”, “Save As” and then “Default”.</p> <h2><strong style="color:#007c8c;">Customising toolbars</strong></h2> <p>Many of the toolbar functionalities can be distracting and you may find you don’t use all of them. With MT4 you can add in or hide as many features as you want.<br /> <img alt="" src="/TMXWebsite/media/TMXWebsite/MT4-Tips-and-Tricks-Moving-Tool-Bar.PNG?width=300&height=168" style="width: 300px; height: 168px; float: right;" /> There are four separate toolbars available:</p> <ul> <li>Standard</li> <li>Chart studies</li> <li>Line studies</li> <li>Time frames</li> </ul> <p> </p> <p> </p> <p><br /> You can move toolbars around by simply dragging them to wherever you’d like them to be.<br /> <br /> To customise what you view, you can simply right-click on the toolbar and click on the customise sub-menu. Here you can remove functions that aren’t required by un-ticking them.<br /> <br /> <img alt="" src="/TMXWebsite/media/TMXWebsite/MT4-Tips-and-Tricks-hidden-Tool.PNG?width=300&height=141" style="width: 300px; height: 141px; float: right;" />By using the customise feature on each toolbar, you can access hidden tools, while removing any you don’t require. Through this technique, you can end up with a much cleaner and more compact user interface.</p> <br /> <p><strong>Using shortcuts</strong><br /> Keyboard shortcuts are a quick and easy way to perform tasks. By using shortcuts, you can have faster access to tools – saving plenty of time in the long run. You can remove redundant information and functionalities, and most importantly increase your charting space.<br /> The following keyboard shortcuts can help to navigate your way around the platform easier:<br /> </p> <table border="1" cellpadding="0" cellspacing="0"> <tbody> <tr> <td style="width:113px;"> <p><strong>Terminal</strong></p> </td> <td style="width:85px;"> <p>Control+T</p> </td> <td style="width:403px;"> <p>This is the main window you use while trading – manage open orders, view account history and set alerts</p> </td> </tr> <tr> <td style="width:113px;"> <p><strong>Navigator</strong></p> </td> <td style="width:85px;"> <p>Control+N</p> </td> <td style="width:403px;"> <p>Add Indicators, Expert Advisors and log in</p> </td> </tr> <tr> <td style="width:113px;"> <p><strong>Market Watch</strong></p> </td> <td style="width:85px;"> <p>Control+M</p> </td> <td style="width:403px;"> <p>View available instruments</p> </td> </tr> <tr> <td style="width:113px;"> <p><strong>Data Window</strong></p> </td> <td style="width:85px;"> <p>Control+D</p> </td> <td style="width:403px;"> <p>View all data for the product currently in the chart window</p> </td> </tr> </tbody> </table> <p><br /> You can use the following shortcuts when analysing and trading, which can greatly improve the process speed of your trading:<br /> </p> <table border="1" cellpadding="0" cellspacing="0"> <tbody> <tr> <td style="width:75px;height:17px;"> <p><strong>+</strong></p> </td> <td style="width:192px;height:17px;"> <p>Zoom in</p> </td> </tr> <tr> <td style="width:75px;height:18px;"> <p><strong>-</strong></p> </td> <td style="width:192px;height:18px;"> <p>Zoom out</p> </td> </tr> <tr> <td style="width:75px;height:17px;"> <p>Control+F</p> </td> <td style="width:192px;height:17px;"> <p>Crosshair</p> </td> </tr> <tr> <td style="width:75px;height:18px;"> <p>Control+Drag</p> </td> <td style="width:192px;height:18px;"> <p>Copy objects</p> </td> </tr> <tr> <td style="width:75px;height:17px;"> <p>Alt+Drag</p> </td> <td style="width:192px;height:17px;"> <p>Extend objects</p> </td> </tr> <tr> <td style="width:75px;height:18px;"> <p>Alt+T</p> </td> <td style="width:192px;height:18px;"> <p>One-click trading</p> </td> </tr> <tr> <td style="width:75px;height:17px;"> <p>Hotkeys</p> </td> <td style="width:192px;height:17px;"> <p>User-defined shortcuts</p> </td> </tr> </tbody> </table> <p> <br /> These are the shortcuts for the more visual aspects of your charts:</p> <table border="1" cellpadding="0" cellspacing="0"> <tbody> <tr> <td style="width:75px;height:17px;"> <p>F8</p> </td> <td style="width:192px;height:17px;"> <p>Edit chart graphics</p> </td> </tr> <tr> <td style="width:75px;height:18px;"> <p>F9</p> </td> <td style="width:192px;height:18px;"> <p>Order panel</p> </td> </tr> <tr> <td style="width:75px;height:17px;"> <p>F11</p> </td> <td style="width:192px;height:17px;"> <p>Full screen chart</p> </td> </tr> <tr> <td style="width:75px;height:18px;"> <p>Alt+1</p> </td> <td style="width:192px;height:18px;"> <p>Bar charts</p> </td> </tr> <tr> <td style="width:75px;height:17px;"> <p>Alt+2</p> </td> <td style="width:192px;height:17px;"> <p>Candlestick charts</p> </td> </tr> <tr> <td style="width:75px;height:18px;"> <p>Alt+3</p> </td> <td style="width:192px;height:18px;"> <p>Line charts</p> </td> </tr> </tbody> </table> <p> <br /> <strong>Using hotkeys</strong><br /> <img alt="" src="/TMXWebsite/media/TMXWebsite/MT4-Tips-and-Tricks-Hot-Key.PNG?width=300&height=334" style="width: 300px; height: 334px; float: left;" /><br /> <br /> <br /> </p> <p><br /> In MT4, when you switch your chart templates, you’ll lose any current analysis on your charts. To prevent this, you can leave your price charts open and just change the indicators that you use – this is where hotkeys come into play. You can assign a hotkey to place a certain indicator on your charts, instead of needing to change the template.</p> <p>To assign a hotkey to an indicator, simply right-click on the indicator on the navigator window and select “Hotkey”.<br /> <br /> <br /> <img alt="" src="/TMXWebsite/media/TMXWebsite/MT4-Tips-and-Tricks-Favorite-Chart.PNG?width=300&height=182" style="width: 300px; height: 182px; float: right;" /><br /> <br /> <strong>Favourites indicators list</strong><br /> To streamline the number of indicators that are available to you, you can create a favourites list. Here’s how you can add indicators to your favourites list:</p> <ol> <li> <p>Open Navigator (Control+N)</p> </li> <li> <p>Open relevant tab (Indicators, Scripts etc)</p> </li> <li> <p>Hover mouse over desired favourite</p> </li> <li> <p>Right-click on your mouse</p> </li> <li> <p>Select ‘Add to favourites’</p> </li> </ol> <br /> <img alt="" src="/TMXWebsite/media/TMXWebsite/MT4-Tips-and-Tricks-Alert.PNG?width=300&height=365" style="width: 300px; height: 365px; float: right;" /> <strong>Alerts</strong> <p>Alerts allow you to keep track of important price levels being breached, and can further enhance your analysis and chart organisation. If you track multiple markets, it can become easy to lose track of the markets, especially after an important event and all the markets move their separate ways.<br /> To set up alerts, move your mouse to the area on the chart you’d like to set the alert at, right-click on the position, select ‘Trading’ and then ‘Alert’.</p>

Using the Bill Williams Accelerator Oscillator
<p>The <strong>Bill Williams Accelerator Oscillator</strong> is an indicator that was developed by Bill Williams, a well-known technical analyst responsible for designing multiple commonly used trading tools. In fact, there is an entire Bill Williams section of indicators included with Metatrader 4. </p> <p> </p> <p>In this particular indicator, the indicator looks at momentum and when that changes. This can quite often lead to a change in price shortly thereafter. After all, if the momentum in an uptrend is starting to slow down, that could suggest that there is less interest in that financial asset. This typically will lead to profit-taking and even selling. In the inverse, momentum to the downside will start to slow down before buyers come in and pick the market up or simple short covering happens. </p> <p> </p> <p>The indicator will not only suggest when the direction of momentum starts to change, but it also looks at whether there is an acceleration in the change of momentum. This is very useful information because it can lead to an opportunity to close out a trade that is profitable, or perhaps open up a new one relatively early in the trend change. </p> <h2 dir="ltr">How to add Bill Williams Accelerator Oscillator to MetaTrader 4 </h2> <p>Adding the Bill Williams Accelerator Oscillator to your Metatrader platform is simple. You simply need to click on <em><strong>Insert</strong></em>, followed by <em><strong>Indicators</strong></em>, followed by <em><strong>Bill Williams</strong></em>, and then finally choose <em><strong>Accelerator Oscillator.</strong></em> It’s worth pointing out that the Bill Williams set of indicators is included in all platforms, so there is no need to download anything else. </p> <p> </p> <p><img alt="Adding the Bill Williams Accelerator Oscillator to Metatrader" src="https://k13-dev.thinkmarkets.com/TMXWebsite/media/TMXWebsite/BW-Accelerator-image-1.jpg" /></p> <p> </p> <p>Once you choose the indicator, the dialog box will pop up with a couple of different choices. The <strong>Value Up</strong>, and the <strong>Value Down</strong> are both available to change as far as colors are concerned, and then you can change the <strong>Fixed minimum</strong> and <strong>Fixed maximum</strong>.For the purposes of this article, we will be using the default settings, but if you choose to experiment, you can easily do so on a <a href="https://portal.thinkmarkets.com/account/individual/demo" target="_blank">demo account</a> without risking any of your trading capital.</p> <h2>How the Bill Williams Accelerator Oscillator is calculated</h2> <p>The indicator is calculated like most oscillators are, using a couple of moving averages. As usual, this oscillator will have a faster moving average and a slower moving average. The Accelerator Oscillator ends up showing a histogram that is a moving average that is the fast moving average calculation minus the slow <a href="/uk/trading-academy/indicators-and-patterns/sma-indicator/">moving average</a>. </p> <p><br /> In other words, it takes the difference between the two input moving averages and creates a third moving average representing part of the final equation. This calculation ends up being the <em><strong>AO</strong></em> which then has a <em><strong>Forming moving average</strong></em> subtracted from it in order to smooth out the results. It should be noted that the <em><strong>AO</strong></em> is actually the Awesome Oscillator that Bill Williams also has developed. This is simply a more complex version of that indicator itself.</p> <p> </p> <p> <strong>The calculation works like this: </strong></p> <ul> <li> Fast moving average minus slow moving average to end up with “AO”</li> <li> Forming moving average used as a smoothing tool</li> <li> AC equals AO minus forming moving average for indicator output</li> </ul> <h2>How to Use the Bill Williams Accelerator Oscillator strategy</h2> <p>The Bill Williams Accelerator Oscillator is an indicator that measures whether momentum is likely to continue. When you add the indicator, it opens up a window at the bottom of the platform, like most other oscillators. It has a zero line, showing whether it’s going to be easier for acceleration or deceleration to increase in momentum. The Accelerator Oscillator c<em>rossing above or below the zero level doesn’t necessarily mean that there is a trade</em>, but it does suggest that traders <strong>need to pay attention to the patterns</strong> that they are looking for in price before making a trade. </p> <p> </p> <p>For example, if the Accelerator Oscillator is above the zero line and printing green bars, this suggests that it’s going to be easier for acceleration to continue going to the upside. On the other hand, if red bars are being printed below the zero level, then it suggests that deceleration in speed and momentum is likely to continue or even expand. <em>That of course is a very bearish sign.</em></p> <p> </p> <p><img alt="The Bill Williams Accelerator Oscillator on a chart" src="https://k13-dev.thinkmarkets.com/TMXWebsite/media/TMXWebsite/BW-Accelerator-image-2jpg.jpg" /></p> <p> </p> <p>Bill Williams himself suggested that if you are buying above the zero line then you are trading along with the overall momentum. He also suggested that if you are selling below the zero line you are doing much the same. He said that you only need to see two bars in a row in order to see enough agreement with the oscillator to open up a new trade in that direction.</p> <p> </p> <p>He also said that if you are buying below the zero line, you need to see three green bars in a row to buy the asset below that level. Alternatively, if you are looking to short a market but the Accelerator Oscillator is above the zero line, you need to see three consecutive red bars print before doing so.</p> <p> </p> <p>Take a look at the chart below. There are multiple red arrows on it suggesting areas that someone using the Bill Williams Accelerator Oscillator would be interested in selling. You’ll notice that at the top of the chart there were <a href="https://k13-dev.thinkmarkets.com/en/trading-academy/forex/japanese-candlesticks">several candlesticks</a> that went back and forth in order to suggest a flattening market. Below there and in the Accelerator Oscillator window you can see that the indicator was forming several red bars in that region. You should also notice that the print just above the zero line that formed to green bars was very short in length.</p> <p> </p> <p>This suggests that momentum is shifting over a longer term as well, as it spends almost all of its time underneath the zero line regardless of color. Later on, you can see that price had been rallying and forming several green bars in a row. </p> <p> </p> <p>This technically was a buying opportunity in the short term, but more importantly notice that after four green bars the indicator started printing red bars again, albeit above the zero level. It should be noted that momentum is dropping rapidly, as not only is deceleration increasing, but the length of the bars in the indicator are starting to drop towards the zero level again.</p> <p> </p> <p><img alt="The Accelerator Oscillator in action" src="https://k13-dev.thinkmarkets.com/TMXWebsite/media/TMXWebsite/BW-Accelerator-image-3.jpg" /></p> <p>Bill Williams Accelerator Oscillator as an Early Warning System</p> <p>One of the great aspects of the Bill Williams Accelerator Oscillator is that it can function as an early warning system. For example, if you start to see price rising but the Accelerator Oscillator rolling over, that can be the first sign of trouble. It functions very much like divergence in any other oscillator, when momentum is moving opposite of price.</p> <p> </p> <p>When trading, most of the time you are looking to go with the overall trend. However, when you can find out that the trend is about the end or at least there is going to be a significant pullback, you can save a considerable amount of your trading capital by taking profits at that point. At the very least, it gives you an opportunity to move your stop loss closer to the current price of the financial asset that you are trading. </p> <p> </p> <p>Take a look at the chart below. The Australian dollar/New Zealand dollar pair on the weekly timeframe is shown. You will notice that on the far left-hand side there is a pair of blue arrows that shows a market that was clearly in a downtrend, but the Accelerator Oscillator was starting to rise. In fact, it had formed a couple of green bars. This was a sign that the downtrend was running out of momentum.</p> <p> </p> <p><img alt="Accelerator Oscillator as a early warning system" src="https://k13-dev.thinkmarkets.com/TMXWebsite/media/TMXWebsite/BW-Accelerator-image-4.jpg" /></p> <p> </p> <p>A little while later, you can see that the market had clearly been in a strong move to the upside but notice how by the time the first red arrow on the chart is pointed out, the histogram in the Accelerator Oscillator formed a “<em>lower high</em>.” Beyond that, the histogram also started to turn red while price was still rising slightly. This was the beginning of the end for the buyers, and as you can see not only could a buyer have taken profit, but short-sellers could have been looking for an opportunity to sell which did in fact present itself shortly thereafter. </p> <p> </p> <p>And even later on the chart, you can see that price was rising again, but this time the histogram in the indicator didn’t rise above the previous time. Price did, but the momentum did not and that is classic divergence. Notice how the indicator started to drop from that level, forming several red bars. Furthermore, it ended up dropping below the zero line and eventually the markets fell rather significantly. What’s interesting about these examples is that you had several candlesticks to react. In this case, that means several weeks. The same principle would of course apply to a five minute chart, so timeframe is rather irrelevant, but it does suggest that you have time to make a decision or at least look for confirmation of that potential scenario. </p> <p> </p> <p>All of this shows that the Accelerator Oscillator can function on several fronts, not only as a confirmation of a potential set up but also has the ability to tell you when to exit a trade or trend. This makes it extraordinarily valuable, even though it’s not one of the more well-known indicators. It should also be noted that quite often Bill Williams has suggested that some of his other indicators should be used in congruence with this one, but it’s crucial that you understand how this indicator functions on its own, and thereby you can choose to build a system based upon some of his others.</p>
How do Heikin Ashi candles work?
<p><strong>Heikin Ashi </strong>is a Japanese term that means “average bar”.<br /> <br /> Heikin Ashi candles are a modified way of displaying data on your candlestick chart, most notably the ability to smooth out volatility of a currency pair - allowing you to build more sophisticated trading strategies.<br /> <br /> A typical candlestick chart will both show the overall trend and how volatile the markets were in a particular candlestick itself.<br /> <br /> Heikin Ashi smooths out the price action on a chart by displaying values using averages to create something that does look very similar to the candlestick, but without a lot of noise.<br /> <br /> The main purpose of using the Heikin Ashi indicator is to see past the choppiness and volatility that is so common in the markets. The Heikin Ashi candles will apply a mathematical formula in order to give a clear picture of whether or not the market is in a bullish or bearish trend.</p> <h2>How Heikin Ashi is calculated</h2> <p>While the traditional bar or candlestick chart plots the open, close, high, and low of a time period, the Heikin Ashi calculates these values slightly differently.<br /> <br /> The Heikin Ashi formula used to come up with the average values on each candle is:<br /> </p> <ul> <li><strong>Open of candle:</strong> (open of previous bar + close of previous bar) / 2</li> <li><strong>Close of candle:</strong> (open + high + low + close) / 4</li> <li><strong>High of candle: </strong>the maximum value from the high, open, or even close of the current period</li> <li><strong>Low of candle:</strong> the lowest value from the low, open, or close of the current period</li> </ul> <p dir="ltr"><br /> As you can see, this is quite different from just plotting the values as usual. This helps slow down the churn and keeps the same trend visualised for longer.<br /> <br /> While the indicator is slow to change, it does help keep the trade going longer when on the correct side of it.<br /> <br /> <img alt="" src="/TMXWebsite/media/TMXWebsite/heikin_ashi_1.png" /><br /> </p>
How to spot bullish and bearish divergence patterns
<p dir="ltr">Some of the most successful forex traders will tell you that a <strong>forex divergence trading strategy</strong> is one of the most accurate strategies you can use. This is because the strategy not only makes use of information that is on the charts, but also uses candlesticks that provide clear information about what buyers and sellers are doing in the market. </p> <p dir="ltr"><br /> This article will present a clear-cut way of identifying bullish and bearish divergence setups on the charts. </p> <p dir="ltr"><br /> You would be best placed to practise this forex divergence trading strategy on a demo account. A demo account provides a chance for a beginner trader to develop the ability to detect bullish and bearish patterns, as well as detect divergence setups. You can <a data-di-id="di-id-b39f6aa3-f2404134" href="https://portal.thinkmarkets.com/account/individual/demo" target="_blank"><u>open a FREE demo trading account</u></a> in less than five minutes. </p> <p>What Is a Divergence?</p> <p dir="ltr">Divergence simply means to deviate from, or to do something distinctive from what another entity is doing. This definition should provide a clue as to what a divergence setup is. The forex trading divergence strategy employs the use of any suitable oscillator such as the <strong>Relative Strength Index (RSI)</strong> or the <strong>Moving Average Convergence Divergence (MACD)</strong> indicator. Other oscillators such as the DeMarker indicator and the Momentum indicator are equally capable of providing guidance on divergence, so they can be utilised as well. The oscillators used for this strategy are found on the <a href="/uk/metatrader5"><u>MT4 or MT5</u></a> platforms. </p> <p dir="ltr"><br /> <strong>Why are oscillators used? </strong>The oscillators are used because they are leading indicators. They tend to point in the direction of the next price move, before this appears on the charts. So they lead the way. Trend indicators follow the market and are lagging indicators, which makes them unsuitable for use in divergence strategies. </p> <p dir="ltr"> </p> <p><strong>So what is divergence?</strong> A situation where the price candles’ tops or bottoms point in a different direction from the corresponding tops or bottoms of the indicator’s signal line is called a divergence. Such divergence can be bullish or bearish.</p> <h2>What is bullish divergence?</h2> <p dir="ltr">A price chart showcasing <strong>bullish divergence</strong> is characterised by the formation of progressively lower lows by the price candles when the signal line of the oscillator forms progressively higher lows. It does not matter whether it is a bullish divergence RSI signal or a bullish divergence MACD signal: the principle of spotting and trading the divergence is the same. The sole difference is that a bullish divergence RSI signal uses the price troughs formed by the single signal line to detect the divergence. The bullish divergence MACD signal uses the point of the cross between the MACD lines in the indicator window as the reference signal from the oscillator. </p> <p dir="ltr"> </p> <p>Furthermore, the bullish divergence RSI signal uses a special setup on the RSI signal line known as the <strong><em>failure swing</em></strong>. The bullish divergence setups using the RSI and the MACD indicators are shown below.</p> <br /> <strong><img alt="Bullish Divergence RSI Setup" src="https://k13-dev.thinkmarkets.com/TMXWebsite/media/TMXWebsite/Bullish-Divergence-RSI-Setup.jpg" /></strong> <p> </p> <p>The bullish divergence RSI setup shows two troughs in the RSI indicator window forming higher lows while the price shows lower lows. The RSI, therefore, leads the price action and is pointing in the new direction. The price follows directly after to correct the divergence in the direction of the indicator’s signal.</p> <h2>What is bearish divergence?</h2> <p dir="ltr">A price chart showing <strong>bearish divergence</strong> is characterised by the formation of progressively higher highs by the price candles in the presence of progressively lower peaks formed by the oscillator’s signal line. This setup can occur in the form of a bearish divergence RSI signal or a bearish divergence MACD signal. The sole difference is that a bearish divergence RSI signal uses the price troughs formed by the single signal line to detect the divergence, while the bearish divergence MACD signal uses the peaks of the MACD lines in the indicator window as the reference signal from the oscillator. The example demonstrated below is that of a bearish divergence MACD signal.</p> <br /> <img alt="Bearish Divergence MACD Setup" src="https://k13-dev.thinkmarkets.com/TMXWebsite/media/TMXWebsite/Bearish-Divergence-MACD-Setup-pic-2.jpg" /><br /> <p dir="ltr">We can see that the bearish divergence MACD setup requires the identification of two progressively lower peaks on the MACD indicator line. The occurrence of the divergence setup should alert the trader towards seizing the initiative for necessary trade action. </p> <p dir="ltr"><br /> Various platforms provide different variations of the MACD indicator. The MACD indicator used above is obtained from the ThinkMarkets MT4 platform. </p> <p dir="ltr"><br /> The RSI can in addition, be used to spot a bearish pattern of divergence. The snapshot below illustrates how to spot a divergence using the RSI.<br /> </p> <img alt="Bearish Divergence RSI Setup" src="https://k13-dev.thinkmarkets.com/TMXWebsite/media/TMXWebsite/Bearish-Divergence-RSI-Setup-pic-3.jpg" /> <p dir="ltr"> </p> <p dir="ltr">This setup may look like it delivered very little profit. The fact is that the trade was set up on a daily chart. On the daily chart, a single candle represents a whole day's price action. Some assets have daily trading ranges of up to 200 pips. So initiating a divergence trade on a daily chart provides a realistic chance of banking a lot of pips. Indeed, the move from the possible sell point at 101.17 to the <a data-di-id="di-id-9877e2be-956ef5d7" href="https://portal.thinkmarkets.com/account/individual/" target="_blank"><u>take-profit area</u></a> totaled nearly 287 pips. This shows the potentials that can be found in a divergence setup. <br /> <br /> The MT5 platform possesses a <em><strong>Depth of Market</strong></em> tool which allows you to spot where the big players are setting up orders. If you employ this tool and see an increase in institutional orders in a direction which follows the divergence trade, this should give you more confidence on how to trade divergence setups. You can get the MT5 and the depth of market tool <a data-di-id="di-id-76e68987-1d3b3793" href="/uk/metatrader5"><u>here</u></a>.<br /> </p> <p dir="ltr">The instances of the divergence trades that you have been shown are overt divergence setups. However, there are divergence setups that are not overt. These are identified as the <strong>hidden divergence patterns</strong>. Just like the overt divergence setups, hidden divergence setups can be of the bullish or bearish variety. </p> <p dir="ltr"><br /> Typically, hidden divergences are routinely continuation patterns while the regular divergences signify price reversals. Let's look at in detail what <em>hidden divergences</em> are. </p> <h2>What is hidden bullish divergence?</h2> <p>A hidden bullish divergence is a setup where the oscillator forms progressively lower lows at the same time that the price is forming higher lows. This setup is frequently seen in situations where the price has been in consolidation or has performed a pullback from an uptrend. This setup, therefore, indicates that price still has some upside momentum and that any pullback is more likely the outcome of profit taking from previous buyers as opposed to strong selling. The emergence of a hidden bullish divergence represents a signal that the prior uptrend is likely to continue. The hidden bullish divergence is presented in this setup below.</p> <br /> <img alt="Hidden Bullish Divergence Setup" src="https://k13-dev.thinkmarkets.com/TMXWebsite/media/TMXWebsite/Hidden-bullish-divergence-setup-pic-4.jpg" /> <p><br /> Here, we can see that the RSI formed lower lows at the same time the price formed higher lows. The period of divergence occurred at the time that price was pulling back in a retracement move. Usually divergence is hidden and not immediately obvious until it has occurred. That is why traders need to incorporate other tools or indicators to enable the early spotting of the hidden divergence signal, especially if the trader wants to re-enter the market on the completion of the pullback. Such tools include the <a data-di-id="di-id-7d8cb4b1-f5d0272a" href="/uk/trading-academy/indicators-and-patterns/analysis-fibonacci-ratios/"><u>Fibonacci retracement tools</u></a>, which are able to detect the exact pullback levels and match them with the higher lows formed by the price bars/candles.</p>
How to start trading the markets
<h2 id="how-to-start-heading-unique-id-1">Step 1 – Apply for an account with us</h2> We offer a wide range of financial instruments to trade across two of the industry’s leading platforms: MetaTrader 4 (MT4) and our very own ThinkTrader®. Simply apply for an account and provide us with the requested documentation and once approved, we’ll provide you with your login details to access your trading account for the very first time.<br /> <br /> <a href="https://portal.thinkmarkets.com/account/register/live?lang=en" id="button-one" target="_blank">Apply today</a><br /> <h2 id="how-to-start-heading-unique-id-2">Step 2 – Time to fund</h2> Once your account is opened you’ll be able to fund it and place your first trade. Funding your account is simple with our online client portal, ThinkPortal. In ThinkPortal you’ll have access to a wide list of funding options, from credit/debit card and bank wires to local payment providers and digital wallet services. The funds will usually be in your account within 12 hours and you’ll be ready to place your first trade.<br /> <br /> <a href="https://portal.thinkmarkets.com/" id="button-two" target="_blank">Fund your account</a><br /> <h2>Step 3 – Let’s get trading</h2> <p>Now that your account is open and funded, you can take that final step and open your first position. Here are a few pointers to help you get started:<br /> </p> <p>Remember – never place a trade that you’re not sure about. Your investment is at risk with every trade you place, so make sure you’re fully behind the decision of placing the trade before hitting the button.<br /> </p> <p> </p> <ol> <li> <p>Understand the markets – ensure you know what you want to trade and when to trade it. Our market analysis section provides plenty of market insight on a daily basis and becoming familiar with our analysts and their articles can be a helpful place to keep track of market news and trading opportunities.</p> </li> <li> <p>Know the platform – before opening your first trade we highly recommend that you become familiar with the platform of your choice. Explore the different platform features and ensure you’re comfortable with the settings before opening the order ticket for the first time. Read about our ThinkTrader® and MetaTrader 4 (MT4) platforms <a href="/uk/account-types/">here</a></p> </li> <li> <p>Place your trade – once you’re comfortable within the platform, identify the trade you want to make and how you plan to execute it, open the order ticket, set your parameters and place the trade.</p> </li> </ol>