 UK
UKArticles (53)

Fibonacci ratios
<p>The Fibonacci ratios commonly used are 100%, 61.8%, 50%, 38.2%, 23.6% - these are shown as horizontal lines on a chart and may identify areas of support and resistance. These levels are created by drawing a trend line between two extreme points and diving the vertical distance by the key Fibonacci ratios. These extreme levels are known as the recent swing high and swing low, <br /> <br /> To identify the Fibonacci levels for an uptrend, click on the swing low and draw the trend line to the swing high. In a down trend you simply reverse the trend line. The following chart shows the Fibonacci levels on price which is in an uptrend.<br /> <br /> <img alt="Fibonacci Retracement" src="/TMXWebsite/media/TMXWebsite/Fibonacci-Retracement.png" /><br /> <br /> As you can see on the chart, we have plotted the Fibonacci levels by clicking on the swing lows at 1.000 and swing highs at 1.14. The Fibonacci levels plotted show where price travels to and reverses, and are evident at the 61.8%, 38.2% and 23.6% levels. The 61.8% level is a common support level, as in the above example you can see the price has tested this level on many occasions. More recently, you can see where the price broke through the 38.2% level and retested this level. In this example there’s an expectation for the currency pair to test the 23.6% level at 1.11.<br /> <br /> The next chart shows the Fibonacci ratios plotted for the pricing action in a down trend. As you can see, we’ve drawn a trend line from the swing high at 1.1037 to the swing low at 1.0994. Again, you can clearly see where the price reversed at key Fibonacci levels such as the 50% and 23.6% levels.<br /> <br /> <img alt="Fibonacci Retracement" src="/TMXWebsite/media/TMXWebsite/Fibonacci-Retracement-2.png" /><br /> <br /> Fibonacci levels are by no means fool proof – they’re not areas where you would buy and sell from. You should look at them as areas of interest – an indication of where the price may go to in the future.<br /> </p> <h3><strong>Combining Fibonacci ratios with support and resistance</strong></h3> <p>Fibonacci ratios can be subjective, but can also be used to identify key support and resistance levels. A potential way to use the Fibonacci levels is to spot potential support and resistance levels, and see if these levels line up with the Fibonacci levels. If you do spot these levels, the chances of the price bouncing off them are higher.<br /> <br /> <img alt="Fibonacci Retracement" src="/TMXWebsite/media/TMXWebsite/Fibonacci-Retracement-and-Support.png" /><br /> <br /> As you can see from the chart, the key Fibonacci levels 61.8% and 38.2% have been areas of support and resistance previously, and by identifying this on the chart, these levels can potentially be areas where you could enter the market. With traders looking at the same support and resistance levels, there’s a good chance that there will be a number of orders around those levels. </p>
.png?width=1160&height=389&ext=.png)
ThinkMarkets’ all-around guide to spread betting
<p lang="EN-US" paraeid="{4b77d25d-7f72-4907-8288-a499ceee47fc}{39}" paraid="1584232785" xml:lang="EN-US">Discover an alternative way to CFD trading with spread betting. Check out our all-around guide and become a knowledgeable spread better in no time! <br /> </p> <h2 aria-level="2" lang="EN-US" paraeid="{98782ed2-1584-42bc-9b6e-f7ff4d4fd9bf}{41}" paraid="1722769441" role="heading" xml:lang="EN-US">What is spread betting?</h2> <p lang="EN-US" paraeid="{98782ed2-1584-42bc-9b6e-f7ff4d4fd9bf}{143}" paraid="1214097965" xml:lang="EN-US">Spread betting is an innovative financial strategy that allows you to speculate on the price movements of various financial markets – including forex, indices, and commodities – without owning the underlying assets.<br /> </p> <p lang="EN-US" paraeid="{e75172a4-3f04-409e-a918-6518d8158281}{88}" paraid="333310598" xml:lang="EN-US">The key principle is simple: you bet a certain amount of money per point of movement in the market. If your prediction is correct, you earn multiples of your stake for every point the market moves in your favour. On the other hand, you lose multiples of your stake for every point the market moves against your prediction.<br /> </p> <p lang="EN-US" paraeid="{e75172a4-3f04-409e-a918-6518d8158281}{128}" paraid="2010494215" xml:lang="EN-US">Spread betting offers a high degree of flexibility, making it a popular choice among traders.<br /> </p> <h2 aria-level="2" lang="EN-US" paraeid="{98782ed2-1584-42bc-9b6e-f7ff4d4fd9bf}{196}" paraid="1381132088" role="heading" xml:lang="EN-US">Spread betting vs. CFD trading</h2> <p lang="EN-US" paraeid="{e75172a4-3f04-409e-a918-6518d8158281}{220}" paraid="1632978422" xml:lang="EN-US">Spread betting and CFD trading are two sides of the same coin. While they may share major similarities, they also have distinct characteristics that set them apart.</p> <h3 aria-level="3" lang="EN-US" paraeid="{c18c692f-b8e0-4eaf-b54b-b660e9642275}{74}" paraid="1353468910" role="heading" xml:lang="EN-US"><br /> <strong>Similarities</strong></h3> <p lang="EN-US" paraeid="{3b1fbb22-130e-4d66-944a-0e9c0701f682}{164}" paraid="976289505" xml:lang="EN-US">Here are some commonalities between spread betting and CFD trading:<br /> </p> <ul> <li lang="EN-US" paraeid="{f4a163aa-99b2-4e64-89f2-f513989f89d6}{255}" paraid="1051782352" xml:lang="EN-US">Both are forms of derivative trading, providing access to global financial markets without ownership of the underlying asset.</li> <li lang="EN-US" paraeid="{8c04c440-e1ee-450f-8885-5483a1986c5f}{26}" paraid="1413569791" xml:lang="EN-US">There is an opportunity to profit from both rising and falling prices of instruments.</li> <li lang="EN-US" paraeid="{81ac6307-d36f-4481-9ca6-9715ea24a60c}{163}" paraid="1898764181" xml:lang="EN-US">Leverage is available, allowing spread betters and traders to open large positions with a relatively small amount of capital.</li> </ul> <h3 lang="EN-US" paraeid="{6d5824b7-b140-41fb-9e73-d2afa5a35fde}{15}" paraid="1715095146" xml:lang="EN-US"><strong>Differences</strong></h3> <p lang="EN-US" paraeid="{355c3efe-d97b-429d-a775-bec0cd351540}{235}" paraid="374237628" xml:lang="EN-US">Here are the differences between spread betting and CFD trading:<br /> </p> <ul> <li lang="EN-US" paraeid="{a527d36b-ae5d-41f2-8cb4-e46e7f99aa0f}{70}" paraid="724486527" xml:lang="EN-US">One key benefit of spread betting is that it is free from Capital Gains Tax*, while profits from CFD trading are subject to tax.</li> <li lang="EN-US" paraeid="{12cd94dc-550c-49d0-9ddb-5a6701760ea7}{26}" paraid="2138015435" xml:lang="EN-US">In spread betting, all of the costs are included in the spread. Meanwhile, CFD trading may involve commissions, depending on the trading conditions set by your broker.</li> <li lang="EN-US" paraeid="{2061edb1-5262-4553-9c3e-42b15fe9a184}{249}" paraid="175270194" xml:lang="EN-US">Spread betting is often limited to forex, indices, and commodities, while CFDs typically offer broader market access, including individual stocks, ETFs, and futures contracts.</li> <li lang="EN-US" paraeid="{5278b7d5-da8f-499b-b17b-83138d301723}{223}" paraid="740594330" xml:lang="EN-US">In spread betting, profits and losses are calculated in the currency of the bet per point movement, while in CFD trading, they are based on the total number of contract units multiplied by the value of each contract.</li> </ul> <p lang="EN-US" paraeid="{db99f984-d8cb-4389-b878-e86c274f999d}{187}" paraid="2037065378" xml:lang="EN-US"><br /> <em>* - Tax laws are subject to change and depend on the jurisdiction in your country of residence. </em></p> <p lang="EN-US" paraeid="{885a0ef8-6df4-452c-82e3-a8a38d3e3eb8}{113}" paraid="33711569" xml:lang="EN-US"><br /> Here’s a table to help you visualise it easier.<br /> </p> <table aria-rowcount="8" border="1" data-tablelook="1696" data-tablestyle="MsoTableGrid"> <tbody> <tr aria-rowindex="1" role="row"> <td colspan="3" data-celllook="0" role="rowheader" rowspan="1"> <p lang="EN-US" paraeid="{161d74e3-38f1-4b4d-8d88-645e2f30840f}{25}" paraid="923769014" xml:lang="EN-US">Spread betting vs CFD trading </p> </td> </tr> <tr aria-rowindex="2" role="row"> <td colspan="1" data-celllook="0"> </td> <td colspan="1" data-celllook="0"> <p lang="EN-US" paraeid="{c69ebd4c-60f2-42df-a750-e947408c8a27}{175}" paraid="29024001" xml:lang="EN-US">Spread betting </p> </td> <td colspan="1" data-celllook="0"> <p lang="EN-US" paraeid="{c69ebd4c-60f2-42df-a750-e947408c8a27}{181}" paraid="1113051659" xml:lang="EN-US">CFD trading </p> </td> </tr> <tr aria-rowindex="3" role="row"> <td data-celllook="0" role="rowheader"> <p lang="EN-US" paraeid="{729b1cb2-4ba2-42cf-bc04-e63d0d8f4364}{47}" paraid="539531881" xml:lang="EN-US">Non-ownership of assets </p> </td> <td data-celllook="0"> <p lang="EN-US" paraeid="{c69ebd4c-60f2-42df-a750-e947408c8a27}{189}" paraid="1869960218" xml:lang="EN-US">Yes</p> </td> <td data-celllook="0"> <p lang="EN-US" paraeid="{c69ebd4c-60f2-42df-a750-e947408c8a27}{193}" paraid="1483099438" xml:lang="EN-US">Yes </p> </td> </tr> <tr aria-rowindex="4" role="row"> <td data-celllook="0" role="rowheader"> <p lang="EN-US" paraeid="{c69ebd4c-60f2-42df-a750-e947408c8a27}{197}" paraid="479864919" xml:lang="EN-US">Profit from falling and rising prices </p> </td> <td data-celllook="0"> <p lang="EN-US" paraeid="{c69ebd4c-60f2-42df-a750-e947408c8a27}{201}" paraid="1192930312" xml:lang="EN-US">Yes </p> </td> <td data-celllook="0"> <p lang="EN-US" paraeid="{c69ebd4c-60f2-42df-a750-e947408c8a27}{205}" paraid="256228778" xml:lang="EN-US">Yes </p> </td> </tr> <tr aria-rowindex="5" role="row"> <td data-celllook="0" role="rowheader"> <p lang="EN-US" paraeid="{c69ebd4c-60f2-42df-a750-e947408c8a27}{209}" paraid="100580764" xml:lang="EN-US">Leverage </p> </td> <td data-celllook="0"> <p lang="EN-US" paraeid="{c69ebd4c-60f2-42df-a750-e947408c8a27}{213}" paraid="978679138" xml:lang="EN-US">Yes </p> </td> <td data-celllook="0"> <p lang="EN-US" paraeid="{c69ebd4c-60f2-42df-a750-e947408c8a27}{217}" paraid="1311959523" xml:lang="EN-US">Yes </p> </td> </tr> <tr aria-rowindex="6" role="row"> <td data-celllook="0" role="rowheader"> <p lang="EN-US" paraeid="{87667e56-703b-435c-8660-f03fc5530082}{222}" paraid="197082624" xml:lang="EN-US">Tax-free </p> </td> <td data-celllook="0"> <p lang="EN-US" paraeid="{ca55eaa1-4137-422d-aca3-572864ad9367}{159}" paraid="724140765" xml:lang="EN-US">Yes </p> </td> <td data-celllook="0"> <p lang="EN-US" paraeid="{ca55eaa1-4137-422d-aca3-572864ad9367}{230}" paraid="2082367673" xml:lang="EN-US">No </p> </td> </tr> <tr aria-rowindex="7" role="row"> <td data-celllook="0" role="rowheader"> <p lang="EN-US" paraeid="{c69ebd4c-60f2-42df-a750-e947408c8a27}{233}" paraid="1424828168" xml:lang="EN-US">Costs </p> </td> <td data-celllook="0"> <p lang="EN-US" paraeid="{c69ebd4c-60f2-42df-a750-e947408c8a27}{237}" paraid="1769081475" xml:lang="EN-US">Spreads </p> </td> <td data-celllook="0"> <p lang="EN-US" paraeid="{c69ebd4c-60f2-42df-a750-e947408c8a27}{241}" paraid="1212371436" xml:lang="EN-US">Spreads and/or commission </p> </td> </tr> <tr aria-rowindex="8" role="row"> <td data-celllook="0" role="rowheader"> <p lang="EN-US" paraeid="{52ddba66-1653-414f-b4c7-4a514acc1c5a}{22}" paraid="345213813" xml:lang="EN-US">Markets </p> </td> <td data-celllook="0"> <p lang="EN-US" paraeid="{52ddba66-1653-414f-b4c7-4a514acc1c5a}{28}" paraid="1025963316" xml:lang="EN-US">Forex, indices, commodities </p> </td> <td data-celllook="0"> <p lang="EN-US" paraeid="{52ddba66-1653-414f-b4c7-4a514acc1c5a}{34}" paraid="1061162620" xml:lang="EN-US">Forex, stocks, indices, commodities, cryptocurrencies, ETFs, futures </p> </td> </tr> </tbody> </table> <p lang="EN-US" paraeid="{4413d524-477f-41d0-8468-c7d16eb03ff0}{194}" paraid="890053329" xml:lang="EN-US"> </p> <p aria-level="2" lang="EN-US" paraeid="{79fc2fc3-a592-4a52-8f80-e5ccfc0e702d}{195}" paraid="1016588277" role="heading" xml:lang="EN-US">Spread betting scenario with EUR/USD<br /> </p> <p lang="EN-US" paraeid="{79fc2fc3-a592-4a52-8f80-e5ccfc0e702d}{222}" paraid="917634062" xml:lang="EN-US">Let’s go through a spread betting winning and losing scenario to understand it further.<br /> </p> <p lang="EN-US" paraeid="{1ad5e251-0662-4f87-a99f-71fdfaa71b6e}{241}" paraid="1158808876" xml:lang="EN-US">You spread bet a long position of EUR/USD at £10 per point, predicting that Fibre will rise in price.<br /> </p> <table aria-rowcount="2" border="1" data-tablelook="1696" data-tablestyle="MsoTableGrid"> <tbody> <tr aria-rowindex="1" role="row"> <td data-celllook="0" role="rowheader"> <p lang="EN-US" paraeid="{b359ca9c-4ef7-4cbf-b1ba-7b395579375e}{222}" paraid="1632643316" xml:lang="EN-US">Winning case </p> </td> <td data-celllook="0" role="columnheader"> <p lang="EN-US" paraeid="{b359ca9c-4ef7-4cbf-b1ba-7b395579375e}{228}" paraid="1827397620" xml:lang="EN-US">Losing case </p> </td> </tr> <tr aria-rowindex="2" role="row"> <td data-celllook="0" role="rowheader"> <p lang="EN-US" paraeid="{b137009c-2afe-487c-916f-592000adb48c}{160}" paraid="895767437" xml:lang="EN-US">If the price of EUR/USD moves from 1.15 to 1.1550,<br /> you gain 50 points. </p> <p lang="EN-US" paraeid="{c345bbd4-33a8-4cec-8df5-b111c44c9c5b}{249}" paraid="1248136883" xml:lang="EN-US">The calculation would be: </p> <p lang="EN-US" paraeid="{2c7442e8-2096-4d6b-ba99-e0a0f5132c65}{37}" paraid="302979886" xml:lang="EN-US">£10 x 50 points = £500 profit </p> </td> <td data-celllook="0"> <p lang="EN-US" paraeid="{b137009c-2afe-487c-916f-592000adb48c}{166}" paraid="1111958946" xml:lang="EN-US">If the price of EUR/USD moves from 1.15 to 1.1450,<br /> you lose 50 points. </p> <p lang="EN-US" paraeid="{e3518e55-9fff-411d-bc64-415c814e596d}{51}" paraid="1854088519" xml:lang="EN-US">The calculation would be </p> <p lang="EN-US" paraeid="{e3518e55-9fff-411d-bc64-415c814e596d}{193}" paraid="1490514868" xml:lang="EN-US">-£10 x 50 points = £500 loss </p> </td> </tr> </tbody> </table> <p lang="EN-US" paraeid="{79fc2fc3-a592-4a52-8f80-e5ccfc0e702d}{240}" paraid="1024679020" xml:lang="EN-US"> </p> <p lang="EN-US" paraeid="{3165fb89-987e-48b1-97fe-262c5f2dac0a}{122}" paraid="886000311" xml:lang="EN-US">Risk management, such as take-profit and stop-loss orders, is essential to avoid bigger than expected losses. </p> <p lang="EN-US" paraeid="{3165fb89-987e-48b1-97fe-262c5f2dac0a}{113}" paraid="199996003" xml:lang="EN-US"> </p> <h2 aria-level="2" lang="EN-US" paraeid="{aea75930-7953-405d-95fd-e226a6fec6b5}{25}" paraid="647369111" role="heading" xml:lang="EN-US">Why spread bet with ThinkMarkets? <br /> </h2> <p lang="EN-US" paraeid="{1dc40da3-ed2f-481b-af83-3a0aae48fa70}{226}" paraid="1331634660" xml:lang="EN-US">As a leading broker in the spread betting and CFD trading industry, here are the advantages that ThinkMarkets offers:<br /> </p> <ul> <li>Access to financial markets</li> </ul> Spread bet on a diverse range of markets, including major forex pairs, global indices, and precious metals. <br /> <ul> <li aria-level="3" lang="EN-US" paraeid="{453485db-3864-4838-8584-3dedf30e3658}{53}" paraid="1764749868" role="heading" xml:lang="EN-US">Advanced and powerful platforms </li> </ul> <p lang="EN-US" paraeid="{453485db-3864-4838-8584-3dedf30e3658}{226}" paraid="1228636328" xml:lang="EN-US">Spread betting recently launched on ThinkTrader, our proprietary, award-winning web and mobile trading platform. Equipped with state-of-the-art technology, ThinkTrader is designed to take your spread betting experience to the next level. Spread betting is also available on both MetaTrader 4 and 5.<br /> </p> <ul> <li aria-level="3" lang="EN-US" paraeid="{d64cc7e8-69d0-4805-aff5-49ed8f9518c6}{121}" paraid="1978819375" role="heading" xml:lang="EN-US">FSCS insurance </li> </ul> <p lang="EN-US" paraeid="{98bbe5dc-bf78-4596-b1d1-f751534673f7}{23}" paraid="113172962" xml:lang="EN-US">As a regulated entity of the Financial Conduct Authority (FCA), ThinkMarkets clients receive automatic FSCS coverage of up to £85,000. <br /> </p> <ul> <li aria-level="3" lang="EN-US" paraeid="{feb0beb7-d8ae-4aa4-8d46-35fe150576f7}{45}" paraid="1507508952" role="heading" xml:lang="EN-US">World-class client support </li> </ul> <p lang="EN-US" paraeid="{feb0beb7-d8ae-4aa4-8d46-35fe150576f7}{246}" paraid="182589112" xml:lang="EN-US">Our dedicated client support team is ready to assist you in over 20 languages, 24/7. <br /> </p> <ul> <li aria-level="3" lang="EN-US" paraeid="{e065062a-648c-40c4-b04b-df89f49a1cdf}{159}" paraid="768898947" role="heading" xml:lang="EN-US">ThinkPortal </li> </ul> <p lang="EN-US" paraeid="{592fbca2-f893-4d1f-8be2-17d48c6909c4}{79}" paraid="2130426178" xml:lang="EN-US">Account management and funding is easy with ThinkPortal, available on both web and mobile, and enabled with convenient payment solutions. <br /> </p> <h2 aria-level="2" lang="EN-US" paraeid="{216b3c56-c139-47d8-8bab-0d5027876545}{231}" paraid="1903367425" role="heading" xml:lang="EN-US">How to start with spread betting <br /> </h2> <ul> <li aria-level="3" lang="EN-US" paraeid="{084099a1-6b42-4255-88f5-ed763fdf5563}{178}" paraid="1879674606" role="heading" xml:lang="EN-US">Stay informed </li> </ul> <p lang="EN-US" paraeid="{084099a1-6b42-4255-88f5-ed763fdf5563}{239}" paraid="1799046533" xml:lang="EN-US">Keep up with market trends and news. Our clients get access to a global economic calendar and a vast library of educational resources, all designed to help traders like you make informed decisions. <br /> </p> <ul> <li aria-level="3" lang="EN-US" paraeid="{e25cd808-05ad-4c45-8fc6-b28e9d6c8e4d}{184}" paraid="239443366" role="heading" xml:lang="EN-US">Manage your risk </li> </ul> <p lang="EN-US" paraeid="{fc97bcc9-c507-4304-a50a-f26c4f9a2c4d}{47}" paraid="88120394" xml:lang="EN-US">As spread betting involves leverage, it carries a high amount of risk. Always place take-profit and stop-loss orders to secure your winnings or manage your potential losses. <br /> </p> <ul> <li aria-level="3" lang="EN-US" paraeid="{fc97bcc9-c507-4304-a50a-f26c4f9a2c4d}{105}" paraid="1617031995" role="heading" xml:lang="EN-US">Start small </li> </ul> <p lang="EN-US" paraeid="{fc97bcc9-c507-4304-a50a-f26c4f9a2c4d}{186}" paraid="1381089851" xml:lang="EN-US">If you’re new to spread betting, begin with smaller stakes to understand how the market works. </p> <p lang="EN-US" paraeid="{f5942623-62ea-444e-9fc6-bfc91665d78d}{222}" paraid="849041055" xml:lang="EN-US"> </p> <p lang="EN-US" paraeid="{cb643a50-167e-47be-b513-fe95cc333d1e}{92}" paraid="1259965644" xml:lang="EN-US">Are you ready to spread bet? Log in to ThinkPortal to create your spread betting account today! </p>

Foreign policy and forex: how US presidential elections influence global currency markets
<p>Every four years, the United States gears up for its presidential elections, with the whole world waiting in baited anticipation. Traders and investors across the globe closely monitor campaign trails, proposed policies, and public polls, not just for political curiosity, but for clues on how the elections and its eventual winner would affect the global financial markets.<br /> <br /> As the President of the United States, whoever wins can reshape the global economic landscape opening up opportunities for traders. In this article, we’ll go through how US presidential elections can influence the forex market.<br /> <br /> US foreign policy decisions, often significantly influenced by the outcome of presidential elections, can have far-reaching effects on global economic relations, trade agreements, and geopolitical stability. These factors collectively play a crucial role in defining the strength and movement of major currencies, including the US dollar.<br /> <br /> For forex traders, it is extremely important to stay up to date with the news during election years. Historically speaking, the run-up towards the US elections have led to major price swings in currency pairs, such as EUR/USD, GBP/USD, and USD/JPY.</p> <h2>Historical impact of the US presidential elections on forex pairs</h2> <p>While historical data is not a sure guarantee that the market will move the same way, it is likely that prior circumstances will cause the same price movements. It’s important to note that the price movements of currency pairs are caused by the accumulation of a multitude of factors, with the US presidential elections being one of the major reasons.<br /> <br /> Using EUR/USD and USD/JPY as examples, we’ll look at the price movements in November 2016 and 2020, the pivotal month of the US presidential elections.</p> <h2>EUR/USD 2016</h2> <p>This pair often reacts to shifts in US-EU relations. Trade policies that lean towards protectionism or changes in NATO funding have historically caused volatility. Public sentiment on the candidate that’s favoured to win, and their policies have led to fluctuations in this pair as traders speculated on the future of US-EU economic relations.<br /> <br /> <img alt="" src="/getmedia/037fbef6-8aa1-459e-803c-53ea783ca2df/market-events-fereign-policy-and-forex-chart-article-image.jpg" /></p> <p>November 1-30, 2016</p> <p>Let’s look at the price movements of EUR/USD in November 2016, when Donald Trump won with 304 votes as opposed to the 227 votes for the Democrat Hillary Clinton. The price of EUR/USD slipped from 1.1292 to 1.0515, showing a massive 7.4% decrease.<br /> <br /> Following Trump's victory over Clinton, there was an immediate weakening of the Euro and a strengthening of the US dollar. This can be attributed to various factors influenced by the election results, such as: </p> <ul> <li>Trump's victory added to the political uncertainty in the Eurozone. This uncertainty was expected to slow Eurozone growth and complicate the job of the European Central Bank (ECB), thereby undermining the Euro</li> <li>Trump's fiscal stimulus agenda, which proposed increasing government spending and significant tax cuts, particularly reducing corporate tax rates, was expected to alter the competitiveness of American businesses</li> <li>Trump's pledge to implement tariffs on imports was likely to lower the volume of imports into the US, supporting the US dollar’s strength. Additionally, any reduction in immigration could impact remittances abroad</li> <li>With Trump’s victory, experts expected the Fed to take a hawkish stance and hike interest rates in December 2016</li> </ul> <p> </p> <h2>EUR/USD 2020</h2> <p><br /> <img alt="" src="/getmedia/784d6b87-ae2d-44b4-999d-fbe3fa37240f/market-events-fereign-policy-and-forex-chart2-article-image.jpg" /></p> <p>November 1 – 30, 2020</p> <p>In November 2020, Joseph Biden Jr. won the quadrennial presidential election. Biden's in the 2020 US presidential election was seen as a positive development for emerging markets and led to a weakening of the US dollar against these currencies. The market's reaction was influenced by expectations of normalised trade policies, improved global growth prospects, and uncertainties regarding future fiscal policies in the US.<br /> <br /> In the span of 5 weeks, the price of EUR/USD rose by 4.87%, from 1.1602 to 1.2167. Several reasons caused this reaction, including the factors below:</p> <ul> <li>The clarity that emerged with Biden's win improved global market sentiment. There were high expectations of US foreign policy and trade relations stabilising, easing tensions and boosting global economy. Wall Street had a strong performance during this period, marking its best week since early April at the time</li> <li>Biden's presidency was anticipated to mark a significant shift from the Trump administration's approach, especially in terms of foreign policy and trade relations. The prospect of a cooldown in trade tensions, particularly with China, was viewed positively by the markets</li> <li>The anticipation of reduced trade tensions under Biden's administration led to increased capital flow back into emerging markets. The MSCI Emerging Markets Index (EEM), for instance, closed at its highest point in over two years </li> <li>Biden's win raised expectations for fiscal stimulus, which was passed to support economic recovery in the US</li> </ul> <h2>USD/JPY 2016</h2> <p><br /> <img alt="" src="/getmedia/ad99ea26-7bf7-44ea-ae13-11618e18ec0f/market-events-fereign-policy-and-forex-chart3-article-image.jpg" /><br /> <br /> In November 2016, USD/JPY rose from 101.75 to 118.691, recording a massive 17.31% jump in just one month. This major rise could be attributed to several factors, although experts note that Donald Trump’s victory was a key driver. Here are some reasons why the USD was expected to strengthen following Trump’s win:</p> <ul> <li>Trump’s proposed policies during the 2016 debates were considered more likely to lead to fiscal expansion, higher inflation, and potentially more aggressive interest rate hikes by the Federal Reserve</li> <li>Trump's promises of significant infrastructure spending, tax cuts, and deregulation raised expectations of accelerated economic growth and higher inflation in the US</li> <li>The Federal Reserve was already on a path to tightening monetary policy in November 2016, whereas the Bank of Japan maintained an ultra-loose monetary policy to combat deflation</li> <li>The Japanese yen is often sought as a safe-haven asset in times of market uncertainty and turmoil. The initial reaction to Trump's win was uncertainty, but as markets began to focus on his pro-growth policies, there was a shift in sentiment that favoured riskier assets, leading to a decrease in demand for the yen</li> <li>As global markets absorbed the potential impacts of Trump's victory, there was a shift towards riskier investments. This change in sentiment often leads to reduced demand for safe-haven currencies like the yen and gold (XAUUSD)</li> <li>Trump’s critical stance on trade agreements and potential changes to global trade policies created expectations of a stronger US economy, further supporting the dollar against the yen</li> </ul> <h2>USD/JPY 2020</h2> <p><img alt="" src="/getmedia/fdc90066-bc01-46d0-9efa-c49fc0cfbdba/market-events-fereign-policy-and-forex-chart4-article-image.jpg" /><br /> <br /> Joe Biden’s victory in 2020 caused a rise in the price of USD/JPY. This is primarily due to investors expecting an easing of trade tensions, encouraging riskier investments. Safe haven assets, such as the Japanese yen, were sidelined for high interest yielding assets.</p> <h2>Trading the US elections with ThinkMarkets</h2> <p>The US election opens a wide range of opportunities for traders. Whether you’re trading forex pairs, commodities, stocks, indices, or even futures, it’s important to rely on a data-driven strategy for better results.<br /> <br /> This is where ThinkMarkets comes in. We provide our traders with access to an extensive library of guides and feature-rich platforms designed to boost your trading.<br /> <br /> Stay ahead of the curve and create an account today!<br /> <br /> <i>Any opinions, news, research, analyses, prices or other information contained on this website is provided as general market commentary and does not constitute investment advice. ThinkMarkets will not accept liability for any loss or damage including, without limitation, to any loss of profit which may arise directly or indirectly from use of or reliance on such information.</i></p>

What is the Consumer Price Index (CPI), and how does it affect the markets?
<p>What is the Consumer Price Index (CPI), and how does it affect the markets?</p> <h2>Types of CPI</h2> <p>The BLS regularly produces official CPI estimates based on two population groups – CPI for all urban consumers (CPI-U) and CPI for urban wage earners and clerical workers (CPI-W).<br /> <br /> The CPI-U covers almost 93% of the entire US population and is the main report used by the Federal Reserve. As such, when we talk about the CPI in this article, we’ll be pertaining to the CPI-U data.<br /> <br /> On the other hand, the CPI-W covers the prices paid by urban wage earners, clerical workers, self-employed individuals, short-term workers, unemployed individuals, and retirees.</p> <h2>How is the CPI market basket determined?</h2> <p>The US Bureau of Labor Statistics (BLS) surveys consumers in private households nationwide as a reference population, collecting information on their spending habits and frequently purchased items. The data collected determines the weight of the item categories in the CPI index structure.</p> <h2>What goods and services are covered by the CPI?</h2> <p>The BLS classified the average American expenditure and consumption patterns into eight major categories.<br /> <br /> <img alt="" src="/getmedia/a8ab296c-c0f7-4830-a75a-e9f3738c5890/article-what-is-cpi-pie-diagram.webp" /></p> <ol> <li>Housing </li> <li>Food and beverages </li> <li>Transportation </li> <li>Commodities </li> <li>Healthcare </li> <li>Energy prices </li> <li>Education </li> <li>Other expenses</li> </ol> <p><br /> The change in price over time for each category is weighed and averaged to create the CPI data.</p> <h3>How is the CPI calculated?</h3> <p>The BLS enlists the help of price collectors to survey over 80,000 price data from 23,000 retail and service establishments throughout the country. They also monitor over 50,000 housing units to calculate the average price changes in rental properties.<br /> </p> <p>Below is the formula to calculate the annual CPI.</p> <br /> <br /> <strong>Annual CPI = (value of goods and services for the current year/value of goods and services in the previous year) x 100</strong><br /> <br /> Let’s look at an example to visualise it further. The price movements below are for illustrative purposes only, and the figures are oversimplified. Let’s assume that this table is the current total expenditure of an average urban consumer for 2021 and 2022.<br /> <br /> <img alt="" src="/getmedia/677c64a3-9049-4aa7-986f-26f99c025c46/article-what-is-cpi-table-expenditure.webp" /> <p>Below is the formula to calculate the CPI.</p> <img alt="" src="/getmedia/ec721e29-4b2e-4159-8d81-778949e8dd49/article-what-is-cpi-calculation-annual.webp" /><br /> <br /> Given this calculation, the annual <strong>CPI for 2022 is 112.31.</strong> <h2>How is the inflation rate calculated from the CPI report?</h2> <p>Inflation is the rise in prices of goods and services. The rate at which prices increase is called the inflation rate.<br /> <br /> A steady inflation rate is a significant economic indicator symbolising a country’s economic health. High inflation rates mean prices rise rapidly at the expense of the general public’s purchasing power. A low or negative inflation rate, called deflation, is also negative as the economy has become stagnant.<br /> <br /> <a href="/en/trading-academy/federal-reserve">The Federal Reserve</a> aims to keep the inflation rate at 2% in the US. The Fed uses the CPI published monthly by the BLS to measure inflation. Below is the formula to calculate the US inflation rate:<br /> <br /> <strong>Inflation rate = (current CPI – previous CPI) x 100</strong><br /> <br /> Let’s use the example above to illustrate. Let’s assume that the 2021 CPI is 101.4.<br /> <br /> <img alt="" src="/getmedia/e443f689-1573-4297-ac57-af171047ca19/article-what-is-cpi-calculation-inflation.webp" /><br /> <br /> Given this calculation, the inflation rate from 2021 to 2022 is 10.91%. That means the price of consumer goods and services rose by 10.91%.</p> <h2>How does the CPI affect the markets?</h2> <p>The release of CPI data is one of the most anticipated events by traders. It is normal to see volatility in charts before and after the release. However, one thing to note is that traders do not react to the CPI data. Traders react in anticipation of the Federal Reserve’s actions with regard to the CPI report.<br /> <br /> The Federal Reserve looks at the CPI report, the Price Producer Index (PPI), and the Personal Consumption Expenditures (PCE) price index to determine whether they should adjust the current monetary policy.<br /> <br /> The current mandate of the Federal Reserve is to keep inflation at a steady 2%. Suppose the rate falls below or above this level. In that case, the Fed may implement either an expansionary monetary policy, lowering the interest rates to stimulate the economy or a contractionary monetary policy, increasing interest rates to reduce the money supply in circulation.<br /> <br /> To find out how these policies affect the markets, read our article on the <a href="/en/trading-academy/federal-reserve">Federal Reserve</a>.</p>
Trading the Non-farm payroll (NFP) report
<h2>What is the Non-farm Payroll Report (NFP)?</h2> <p>Non-farm payroll (NFP) is a monthly report that provides employment figures in the manufacturing, construction, and goods sectors, accounting for approximately 80% of jobs in the US. It contains information related to the unemployment rate, job growth, and other key employment statistics. The report does not include US jobs in private households, the federal government, nonprofit organizations, and, as the name suggests, farm workers. Data within the NFP report is measured by the <a href="https://www.bls.gov/news.release/empsit.nr0.htm">Federal Bureau of Labor Statistics</a> through the Employment Situation report and is typically released on the first Friday of every calendar month.</p> <h2>How to Read the NFP Report</h2> <p>Learning how to read NFP data not only helps you understand employment numbers in the US economy but also enables you to make smarter trading decisions. Start by focusing on the total jobs gained or lost, which can indicate the health of the labor market. Pay close attention to sector-specific employment figures, as these can reveal trends that impact the stock market. If you’re trading in the short term, it’s important to react quickly to this data, as it is vital for decision-making. Additionally, consider how changes in employment numbers might influence broader financial markets, including interest rates and inflation.</p> <h2>Why is the NFP Report Important?</h2> <p>The report serves as a key economic indicator of the US economy's health by detailing employment and unemployment figures. The data is known for triggering volatile market conditions, especially for major currency pairs in forex trading, particularly if the data beats or misses expectations. As a stand-alone report, it is important in its own right, as an indication of whether the economy will strengthen or decline; for example, if the unemployment rate is high, it could indicate a declining economy.</p> <p>However, it is also an important piece of a jigsaw when looking at other key factors that influence the US economy, such as economic policy-making. Interest rates, for example, are set by the <a href="https://www.federalreserve.gov/monetarypolicy/fomc.htm">Federal Open Market Committee (FOMC)</a> in the monthly Federal Reserve meeting, and the board will look at the Bureau of Labor Statistics NFP figures when deciding if they are going to lower or raise interest rates in their monetary policy. Changing interest rates usually have a significant impact on markets such as forex, commodities, and stocks, and can cause major volatility.</p> <h2>NFP Report Calendar</h2> <p>The NFP is released typically every first Friday of the calendar month at 13:30 PM (GMT), below you can see the dates for 2024.</p> <p><img alt="NFP Calendar" src="/getmedia/7ade571b-7f2e-4ac4-acb2-32f69f83074d/NFP-calendar.png" title="NFP Calendar" /></p> <h2>How Does the NFP Affect the Markets?</h2> <p>The NFP report is important to traders as it provides cues on how other factors, such as the Federal Reserve and government agencies, will adapt to steer the economy in a certain direction. The government will implement policies to combat economic issues like inflation or recession. If the NFP report indicates a drop in employment, it could signal that the economy is declining. This, in turn, may prompt the Federal Reserve to adjust interest rates to restore balance, which will trickle down into the markets. The central bank will closely analyze the NFP figures as part of its decision-making process.</p> <h4>Trading on NFP</h4> <p>Firstly, monitor the report. The primary focus of the NFP report is the employment figures, mainly regarding jobs added or reduced. However, there are smaller components you should also watch when trading.</p> <h4>Take Note of Sector-Specific Data</h4> <p>If the NFP report shows a decline in employment, traders will monitor which industries or sectors are experiencing this decline. It could indicate that the sector itself is struggling, potentially affecting stocks and shares.</p> <h4>Focus on Earnings</h4> <p>If average hourly earnings have dropped while employment figures remain stagnant, this could also indicate a decline. It may point to issues where workforce output could fall as employees might leave because of declining earnings. Conversely, higher earnings could suggest wage inflation.</p> <h4>Monitor Previous Reports</h4> <p>Given the scale of the NFP report, it is often subject to significant revisions of previous headline figures. If this occurs, it could cause a sudden jolt in the markets.</p> <p>When trading based on the NFP report, economists attempt to predict the headline figures (or NFP number) monthly while also monitoring other reports, rates, and financial events. Trades will then be placed based on whether they believe this result will drive the markets up or down. The markets most affected by the NFP report are forex, indices, and commodities.</p> <p>A declining report may not be bad news for traders, as it is possible to benefit from this outcome with <a href="https://www.thinkmarkets.com/en/trading-academy/cfds/what-are-cfds">contracts for difference (CFDs)</a>. CFDs allow you to trade volatile markets whether they go up or down; you simply need to correctly predict the market direction by going long or short. You can utilize <a href="https://www.thinkmarkets.com/en/trading-academy/cfds/risk-management-tools-in-cfd-trading">risk management tools</a> such as stop loss and take profit to minimize your risk, but as always with trading, proceed with caution. Plan your strategy, monitor reports such as the NFP, and take advantage of our built-in economic calendar to keep track of other major financial events on our award-winning app, ThinkTrader.</p>
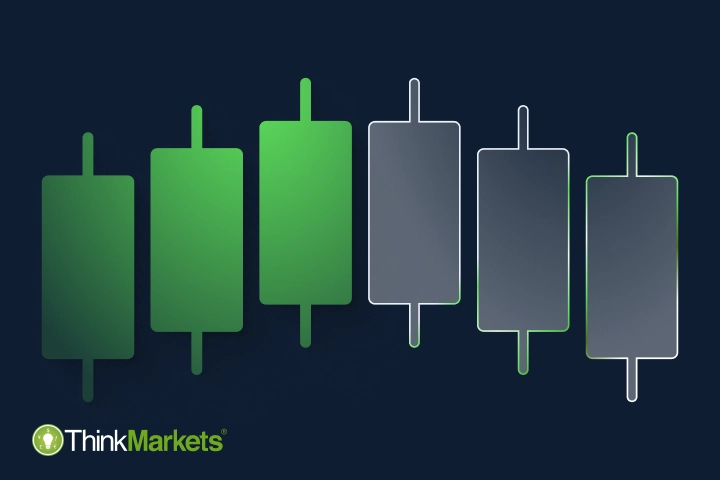
Three White Soldiers and Three Black Crows candlestick patterns
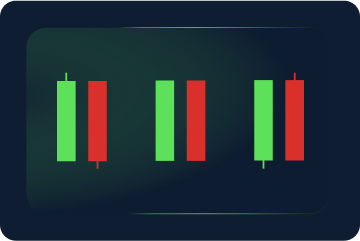
<p paraeid="{a93e94ed-6fea-4c9f-a350-f7bc6677a4d1}{52}" paraid="1878194966">The Three White Soldiers and Three Black Crows candlestick patterns are reversal patterns made of three candles, as their names suggest. Both formations indicate a potential change in the direction of a trend and are only valid when they appear after a strong uptrend or downtrend.</p> <h2 paraeid="{a93e94ed-6fea-4c9f-a350-f7bc6677a4d1}{52}" paraid="1878194966">Three White Soldiers pattern structure</h2> A Three White Soldiers is a bullish reversal pattern occurring in a strong downtrend and signals a potential upcoming change in price direction. The formation consists of three consecutive bullish candles, each opening and closing higher than the previous candle did.<br /> <br /> <img alt="A Three White Soldiers candlestick pattern" src="/getmedia/88b2dfb8-8864-44ed-9dc0-96bd9c68d551/A-Three-White-Soldiers-candlestick-pattern.png" /><br /> All three candles may have short wicks or no wicks at all. Long wicks usually indicate that the opposing power – bears – remain strong, making the pattern less reliable. <h2>Three Black Crows pattern structure </h2> The opposite version of Three White Soldiers is called Three Black Crows. This is a bearish reversal formation, which occurs near the top of an uptrend. Like the bullish version, the Three Black Crows pattern consists of three consecutive bearish candles, preferably with long bodies. <br /> <br /> <img alt="A Three Black Crows candlestick pattern" src="/getmedia/1d4b2a72-2aa2-4223-af17-bad129553cfb/A-Three-Black-Crows-candlestick-pattern.png" /><br /> The pattern follows the same logic as Three White Soldiers but in reverse – each candle has to open and close lower than the previous one and has no long wicks. <h2>How do Three White Soldiers and Three Black Crows patterns work?</h2> Belonging to the family of reversal patterns, the Three White Soldiers and Three Black Crows are considered powerful patterns. They occur in a strong trend when the opposing power gains more strength, pushing for a reversal.<br /> <br /> Besides indicating that the trend may change, both patterns serve as a trend confirmation themselves, as they are made of three candles in the same direction.<br /> <br /> While this is an advantage of these two patterns compared to the other reversal formations, the apparent weakness is that the three candles carry the price level far away from the recent low/high, making it more difficult to identify stop loss and take profit. <h2>How to trade with a Three White Soldiers candlestick pattern</h2> Trading with a Three White Soldiers pattern is very intuitive. All you need to do once you confirm that it’s been formed is open a position in the direction of a new trend.<br /> <br /> On the image below, you can see a price chart with a strong downtrend. At one point, bulls take control of the price and push it higher for three consecutive days, creating a strong reversal.<br /> <br /> <img alt="A trading example with a Three White Soldiers Pattern" src="/getmedia/64c0d8d2-b1c4-4737-809a-274bbfb28103/A-trading-example-with-a-Three-White-Soldiers-Pattern.png" /><br /> To enter the market, most traders use the third candle’s closing price as a starting point. As we mentioned earlier, stop loss is quite hard to identify in this case. Risk-takers may set it at the lowest point of the first candle in the pattern, while less risky traders would choose a closer placement.<br /> <br /> Just like in any trade, higher risk often comes with higher gains but also with higher losses. On the other hand, less risky trades provide better protection from large losses but may limit trading opportunities as well. That's why it is important to assess your risk appetite before you start trading to not fall prey to your emotions.<br /> <br /> For take-profit orders, it is advisable to use support and resistance and identify the levels where the price has been stopped previously. This is why the pattern itself does not provide a take profit level. <h2>How to trade with a Three Black Crows candlestick pattern</h2> Trading with the Three Black Crows works exactly the same but in reverse. In the same chart earlier, we can see that the downtrend was created earlier by the three consecutive bearish candles.<br /> <br /> <img alt="A trading example with a Three Black Crows candlestick pattern" src="/getmedia/3278e632-5a1d-4361-a5f9-df2603513e18/A-trading-example-with-a-Three-Black-Crows-candlestick-pattern.png" /><br /> <br /> Once this pattern was fully formed, traders had a chance to open a short position, taking the closing price at the openinging of the first candle. The take-profit level would need to be identified using something else than the pattern.<br /> <br /> You can notice that although this downtrend had a few upswings, the price never reached the opening price of the first candle's opening price. This means the swings didn't trigger the stop loss. However, if they missed the opportunity to lock their profit at the right time, it was erased by the Three White Soldiers that appeared at the end of this downtrend.<br /> <br /> As it is impossible to predict the movements of the markets with a 100% guarantee, experienced traders usually use a few additional technical analysis tools before they make a decision.<br /> <br /> On the other hand, beginners can identify the risk level they are comfortable with using a risk-free demo account. Sign up today to practise trading with chart patterns and build your trading strategy.<br /> <br /> If you’d like to know more about chart patterns, head to our next article, where we will explain how complex patterns with multiple candles, such as Flags, work.
How to trade Tweezer Bottom and Tweezer Top candlestick patterns
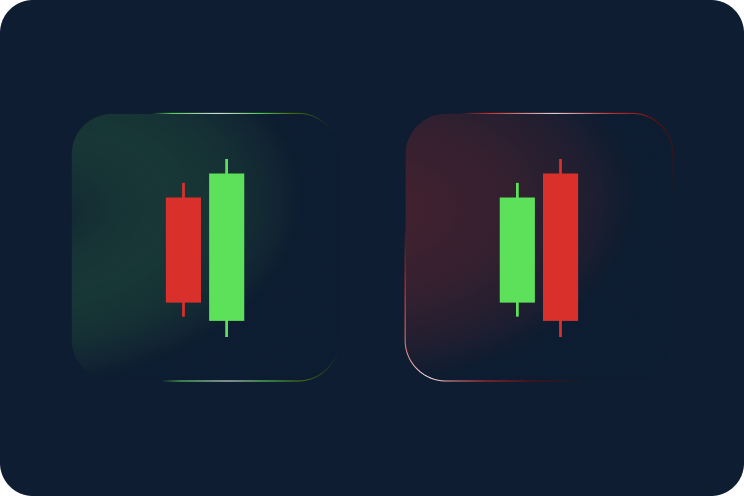
<p> Tweezer Top and Bottom, also known as Tweezers, are reversal candlestick patterns that indicate a potential change in the price direction. Both formations consist of two candles that occur at the end of a trend, signaling its weakening. </p> <h2>Tweezer Bottom candlestick pattern structure</h2> <p> A Tweezer Bottom is a bullish reversal pattern that appears at the bottom of a downtrend. Both candles are of the same length but the first candle in this formation is bearish, in line with the bearish trend, while the second is bullish. </p> <p> The key message that this pattern signals is that despite a poor performance on the first day, the bears were not able to control the price direction as buyers were able to claw back all of their losses on the second day, which marks a deep blow for short sellers. </p> <p> For the pattern to qualify as a Tweezer bottom, the opening price of the new candle needs to be near the close of the prior day. The price should also not trade below the prior day’s closing price. </p> <br /> <img alt="Tweezer Bottom candlestick pattern" src="/TMXWebsite/media/TMXWebsite/Tweezer-Bottom-candlestick-pattern.png" /> <h2>Tweezer Top candlestick pattern structure</h2> <p> A Tweezer Top candlestick pattern has exactly the same structure as a Tweezer Bottom but reversed. This formation occurs at the end of an uptrend, indicating potential change. Therefore, it is a bearish reversal pattern. The first candle of a Tweezer Top is bullish and continues in the same direction as the trend, while the second candle is bearish and suggests that the trend may be changing soon. </p> <br /> <img alt="Tweezer Top candlestick pattern" src="/TMXWebsite/media/TMXWebsite/Tweezer-Top-candlestick-pattern.png" /> <p> Similar to Tweezer Bottom, both candles should roughly match each other. However, the high prices of both candles must be approximately on the same level. </p> <p> Keep in mind that both Tweezer patterns are only considered valid when they occur in uptrends and downtrends. In a sideways trading market, they don’t provide any value and signal the indecision to move in either direction. </p> <h2>How do Tweezer Bottom and Tweezer Top patterns work?</h2> <p> As reversal patterns, Tweezers are quite popular among traders searching for clues on when the price will change its direction. This pattern can be a powerful signal of a potential upcoming reverse, as it suggests that the dominating power loses its control over the price. In turn, the opposing power gains momentum to close the session in their favour. </p> <p> It is important to note that the stronger (longer) the second candle is, the stronger signal this pattern generates, indicating that the opposing power had enough strength to push the closing price far from the opening. In some cases, a tweezer pattern takes the form of the <a href="/trading-academy/forex/analysis/bullish-bearish-engulfing-patterns">Engulfing</a> formation, where the second candle shuts down the first one entirely, indicating a particularly strong reversal signal. </p> <p> Nevertheless, just like any other candlestick pattern, neither Tweezer Bottom nor Tweezer Top guarantees market reversal and serves only as a suggestion. To help confirm their findings, traders often use additional tools. </p> <h2>How to trade with a Tweezer Bottom candlestick pattern</h2> <p> As noted earlier, the bullish Tweezer occurs at the bottom of a downtrend. On the image below, you can see that the instrument’s price has been moving lower for some time, creating lower highs and lower lows. </p> <br /> <img alt="A trading example with Tweezer Bottom candlestick pattern in a chart" src="/TMXWebsite/media/TMXWebsite/A-trading-example-with-Tweezer-Bottom-candlestick-pattern-in-a-chart.png" /> <p> If you look at the bullish Tweezer at the bottom, the first candle is a strong bearish candle that indicates the continuation of the downside move. However, the second candle surges in the opposite direction. </p> <p> In the following trading sessions, the bulls were able to keep pushing the price higher, completely reversing the trend, despite occasional pushbacks from bears. </p> <p> In this particular case, we see a very strong bullish candle that further adds to the overall bullishness of the tweezer bottom candlestick pattern. </p> <p> Trading the bullish Tweezer is not much different from trading other bullish reversal candlestick patterns – it is advisable to wait for the formation to be completed before entering a trade. Risk-averse traders may wait for an additional candle to close to confirm the new trade. </p> <p> Once you are confident that the pattern strongly indicates an upcoming reversal, you can open a long trade. The stop loss may be placed below the low point of the pattern because if the price trades below this level, it will invalidate the pattern. </p> <h2>How to trade with a Tweezer Top candlestick pattern</h2> <p> As you already know, unlike the bullish Tweezer Bottom, the Tweezer Top candlestick formation occurs at the top of an uptrend. Therefore, it is a bearish pattern. </p> <p> On the image below, you can see a strong bullish trend. A bearish Tweezer Top was formed on its top, suggesting a trend reversal. </p> <br /> <img alt="A trading example with Tweezer Top candlestick pattern in a chart" src="/TMXWebsite/media/TMXWebsite/A-trading-example-with-Tweezer-Top-candlestick-pattern-in-a-chart.png" /> <p> Although the second candle is slightly weaker than the first one, the uptrend still sees a strong reversal. Like with a Tweezer Bottom, traders usually open their position in the opposite direction from the main trend. In this case, it means going short, using the latest high as a stop loss. </p> <p> If the second candle is not strong enough to provide confidence in the upcoming reversal, you may use additional tools, such as trendlines. In the example illustration below, you can see how a crossed support line confirms the reversing trend. </p> <br /> <img alt="Support trendline with a Tweezer Top candlestick pattern in a chart" src="/TMXWebsite/media/TMXWebsite/Support-trendline-with-a-Tweezer-Top-candlestick-pattern-in-a-chart.png" /> <p> A great way to learn the Tweezer candlestick patterns trading is to practise identifying them in a risk-free demo account environment. Sign up today and practise opening positions with this candlestick pattern. </p> <p> If you want to learn more about other patterns, head to our next article, where we explain how the <a href="/en/trading-academy/indicators-and-patterns/morning-evening-star-candlestick-patterns/">Morning Star and Evening Star candles</a> work. </p>
.png?width=744&height=496&ext=.png)
How to trade bullish and bearish Engulfing candlestick patterns
Bullish and bearish Engulfing candlestick patterns, also called Outside bars, are powerful dual-candle formations. Found at the end of a downtrend or uptrend, these patterns often indicate a potential reversal. Engulfing patterns are also easy to spot, which adds to their popularity and makes trading with them very straightforward. <br /> <br /> The difference between this pattern's bullish and bearing versions depends on the candle order within it. <h2>Bullish Engulfing candlestick pattern</h2> A bullish Engulfing pattern occurs at the end of a downtrend and consists of two candles. The first candle is bearish (red) and has a relatively small body and short shadows, also known as wicks. The second candle, on the other hand, is bullish (green) and has longer wicks and a longer body that engulfs the body of the previous bearish candle. <br /> <br /> <img alt="Bullish Engulfing candlestick pattern (Outside Bar)" src="/getmedia/4908dd05-65dd-4e63-8e2c-91688f3ef6cd/Bullish-Engulfing-candlestick-pattern-(Outside-Bar).png" /><br /> <br /> The body of the first candle doesn't necessarily need to be exactly in the middle as long as it's completely overwhelmed by the body of the second candle. For a candlestick pattern to qualify as bullish Engulfing, the high price of the second candle should be higher than the high price of the first candle. The same scenario applies to the low prices – the second candle must have a lower low price than the first one. <br /> <br /> If the closing price (top of the body) of the second candle is higher than the high price (top of the wick) of the first candle, the Engulfing pattern is considered a much stronger bullish reversal signal. The reason is that the second candle indicates that bulls gained control over the price. <h2>Bearish Engulfing candlestick pattern</h2> A bearish Engulfing pattern works exactly the same way. The only difference is that it is a bearish reversal pattern that occurs at the top of an uptrend, with a bullish (green) candle on the left and a bearish (red) one on the right. <br /> <br /> <img alt="Bearish Engulfing candlestick pattern" src="/getmedia/b35bbf54-f9e5-4090-a3ae-155c631dcdb8/Bearish-Engulfing-candlestick-pattern.png" /> <h2>How do Engulfing patterns work?</h2> As we mentioned above, both patterns take place at the end of a strong trend. The first candle in both formations (either bullish or bearish) signals the continuation of a trend. On the other hand, the second candle (bearish or bullish, respectively) is powerful enough to completely shut down the first one and initiate a new trend. <br /> <br /> Engulfing candles in trading are very significant when conducting analysis, as traders usually aim to capitalise on new trends when markets change direction. Reversal patterns, such as bullish and bearish Engulfing patterns, signal an impending change in the price direction, as the so far dominant force has started losing momentum, which allows the other force to step in. <br /> However, as with other candlestick patterns, Engulfing formations have their own limitations. While they are quite powerful at the end of a strong trend, they are almost non-tradeable when they appear in a sideways market. <h2>Engulfing vs Harami candlestick patterns</h2> An Engulfing pattern has an opposite version – a Harami candlestick formation, also called an Inside Bar. Its structure is identical, but the candles within it swap places. The first candle is long, entirely overwhelming the second smaller candle. A Harami candle can also exist in two variations – bullish and bearish. <br /> <br /> <img alt="Bullish and bearish Harami candlestick pattern (Inside bars)" src="/getmedia/418d3953-c8d9-46f8-b205-af678bcf1aeb/Bullish-and-bearish-Harami-candlestick-pattern-(Inside-bars).png" /><br /> <br /> However, in general, this pattern doesn't provide a strong signal. Once it occurs, it may indicate an upcoming reversal, but the price often starts trading sideways instead or continues following the trend. That's why this pattern is not particularly popular among traders. <h2>How to trade with Engulfing patterns</h2> A trading strategy with Engulfing patterns is pretty straightforward as they provide a powerful signal on their own. <h2>Trading with a bearish Engulfing pattern</h2> On the image below, you can see a series of highs and lows that created an uptrend. Following a new short-term high price (the first candle in the bearish Engulfing pattern), the price suddenly drops lower to create a strong, powerful bearish candle. <br /> <img alt="Trading with a bearish Engulfing pattern" src="/getmedia/e13e4fd6-918a-47a1-8d3f-669a1d94f57e/Trading-with-a-bearish-Engulfing-pattern.png" /><br /> All elements are in place, and the bearish Engulfing pattern occurs. After that, the price still has both lows and highs but ultimately trades at lower levels. <br /> <br /> In this particular example, you can see the power of a bearish Engulfing pattern. The trend reversed after the second candle generated a signal that the bears had taken control of the price, and the downtrend may be finished. <br /> In such cases, traders tend to go short, using the second candle as an entry point and its high price as a stop loss. The take-profit level is derived using other technical indicators. <br /> <br /> For a more complete trading strategy, you may also use additional technical analysis tools, such as support and resistance or technical indicators. <br /> For example, if we zoom out of the previous price chart, we can see a potential placement of two support levels that may (and did, in this case) affect a newly formed trend. <br /> <br /> <img alt="A bearish Engulfing candlestick pattern with support lines in a price chart" src="/getmedia/097e5469-ff87-4b8d-92c0-5528ed694c04/A-bearish-Engulfing-candlestick-pattern-with-support-lines-in-a-price-chart.png" /><br /> <br /> On the other hand, if you have a long position open in an uptrend, a bullish Engulfing candle pattern may serve as a signal to exit the market before it reverses. <h2>Trading with a bullish Engulfing pattern</h2> A strategy with a bullish Engulfing formation would work exactly the same, but you would go long following the same logic. With a short position in a downtrend, this pattern would also serve as an exit signal. <br /> <br /> For example, the image below shows a bullish Engulfing pattern in action – the downward reversed right after the formation occurred. <br /> <br /> <img alt="Trading with a bullish Engulfing pattern" src="/getmedia/13a3792d-d4e9-4eed-9fe4-0bbbd24b7401/Trading-with-a-bullish-Engulfing-pattern.png" /><br /> <br /> Keep in mind that even the most accurate trading signals never guarantee that the market will move in the predicted direction. That's why experienced traders always have risk management tools, such as stop loss and take profit in place.<br /> <p>Create a demo account to solidify your knowledge in a risk-free market environment. Alternatively, move to our next article, where we explain how <a href="/uk/trading-academy/indicators-and-patterns/marubozu-candlestick-pattern/">Marubozu candles</a> work.</p>
What is the Marubozu candlestick pattern?
<h2 paraeid="{a93e94ed-6fea-4c9f-a350-f7bc6677a4d1}{52}" paraid="1878194966">Marubozu candlestick structure</h2> A Marubozu candle is very easy to spot because of its prominent structure. A candle consists of a long body created by a big gap between the opening and closing price and a very short wick on either side or no wicks at all. <br /> Depending on the presence and location of a wick, analysts define three types of Marubozu candles: <br /> <br /> <img alt="Marubozu candle patterns" src="/getmedia/c3c4ac1e-313d-4c9d-99f8-06d7a5f36964/Marubozu-candle-patterns.png" /><br /> <br /> In all three cases, this candle has bullish and bearish versions. <br /> <br /> In general, for a pattern to be classified as a Marubozu candlestick formation, at least one of its wicks has to be missing. In the bullish Marubozu Full, for example, the opening price is the lowest level, and the closing price is the highest price of the candle. This means that the instrument’s price opens the session, starts rallying in a certain direction and closes at the exact end. Thus, open and close are at the same price as the high and low. <br /> <br /> As for the bullish Marubozu Open, the opening price is also the session low, indicating that buyers took control from the very start of the trading session. However, the closing price on the other side of the body can slightly differ from the high/low, leaving some room for a short wick. <br /> <br /> The Marubozu Close candle is the opposite version of the Marubozu Open. <h2>How does a Marubozu pattern work?</h2> Marubozu candle patterns send a powerful message – the market is moving in one direction. This applies to Marubozu Open and Close candles, too, despite their small wicks, as buying or selling pressure was so strong that it overwhelmed the other side of the market. <br /> <br /> In general, bearish Marubozu candles signal that the sellers are in full control as they dominated the session in the desired direction, and vice versa for the bullish Marubozu candles. <h2>How to trade with a Marubozu candlestick pattern</h2> The rule of thumb with Marubozu candles is to trade in the direction of a candle. It is generally considered a continuation pattern, but due to the length of its body, continuation implies following the direction of the candle itself, not necessarily the trend's direction. <h2>How to trade with a bullish Marubozu</h2> For example, in the price chart below, you can see a bullish Marubozu Open candlestick in action.<br /> <br /> <img alt="a bullish Marubozu" src="/getmedia/ae326ae9-a8d9-48f8-8760-2fda6d6e4ed2/a-bullish-Marubozu.png" /><br /> <br /> After a downtrend, the price movements consolidated into trading sideways with short-term highs and lows. At one point, bulls took charge by pushing the price higher, creating a Marubozu Open candle. <br /> <br /> This means that bulls controlled the market from the candle’s opening price to the closing. Following such a strong bullish signal, the trend continued moving upward. <h2>How to trade with a bearish Marubozu</h2> On the second image, you can see the opposite scenario. A long bearish Marubozu candle was formed in an uptrend, leading to its reversal. The candle indicated that bears gained control, and the market started forming new lows and lower highs.<br /> <br /> <img alt="a bearish Marubozu" src="/getmedia/f428c190-f8e8-41ff-996f-1cc110439790/a-bearish-Marubozu.png" /><br /> <br /> However, in both trading charts, you can see other Marubozu candles and where the market didn’t follow their directions. It happens because this pattern is not as precise as some other Japanese candlestick patterns. Moreover, it only confirms the fact that there is never a guaranteed outcome in the financial markets and all technical analysis tools provide only a suggestion. That’s why professional traders use several tools to combine their findings and make informed decisions.<br /> <br /> For example, support and resistance levels can be very helpful when you trade with a Marubozu candle. If a candle closes right before one of those levels, the price will likely bounce off and move in the opposite direction – away from the level. <br /> <br /> In some cases, a Marubozu candle opens at a support/resistance level, crosses it and closes on the other side. This means that bears/bulls were strong enough to break through an earlier established barrier and may indicate a stronger suggestion to trade in the direction of the candle.<br /> <p>It is also very important to place a stop loss according to your risk appetite. Many traders have their stop loss at the candle’s opening or closing price depending on if trading the bullish or bearish pattern. Create a free demo account today and try finding Marubozu candles on the charts. Learn how you can use technical analysis and risk management tools in a risk-free trading environment with ThinkMarkets. To learn more about candlestick patterns, check out our next article, where we explain how <a href="/uk/trading-academy/indicators-and-patterns/tweezer-top-bottom-candlesticks/">Tweezer candles</a> work.</p>
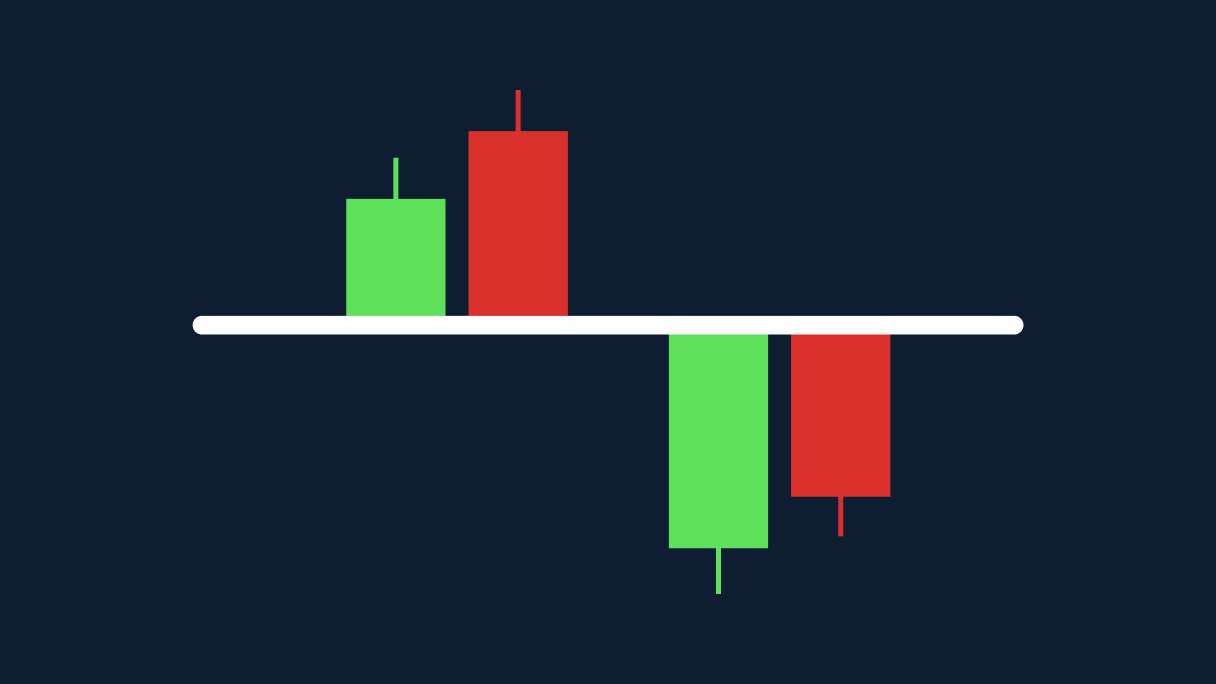
What is a Spinning Top candlestick pattern?
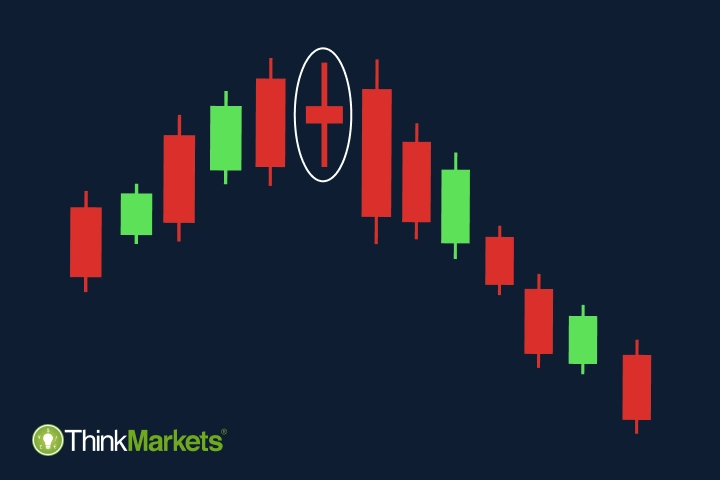
<p paraeid="{a93e94ed-6fea-4c9f-a350-f7bc6677a4d1}{52}" paraid="1878194966">A Spinning Top is another common candlestick pattern that indicates indecisiveness on the market. Similar to a <a href="/uk/trading-academy/indicators-and-patterns/doji-candlestick-pattern/">Doji candle</a>, a Spinning Top is a single-candle formation that is considered a neutral pattern, although appearing at the end of a trend, many end in reversals.<br /> <br /> Due to its conflicting nature, a Spinning Top candle alone is not considered a strong trading signal. However, this pattern is much stronger in a trending market, whether uptrend or downtrend. When it takes place in a sideways trend, it can be seen as another signal that there is no clarity in the price action.</p> <h2 paraeid="{a93e94ed-6fea-4c9f-a350-f7bc6677a4d1}{52}" paraid="1878194966">Spinning Top candlestick structure</h2> A Spinning Top candle is formed by a short body in the middle and two long wicks on both sides of it. Ideally, these two wicks should be of similar length, and the difference between the opening and closing prices is very small.<br /> <br /> <img alt="Bullish and bearish Spinning Top candlestick chart patterns" src="/getmedia/7260dcfb-14c9-4ef9-9b53-c04cb6f327d8/Bullish-and-bearish-Spinning-Top-candlestick-chart-patterns.png" /><br /> <br /> Because the Spinning Top is considered a neutral pattern, neither the bullish (green) nor bearish (red) version of it is particularly stronger than the other one. As with almost all candlestick patterns, the role of the next candle is important.<br /> <br /> A reversal may happen if the next candle after the Spinning Top opposes the current trend. On the other hand, a candle that goes in the same direction as a trend may signal its continuation. <h2>Doji vs Spinning Top candlestick patterns</h2> The shape of the Spinning Top candle is very similar to a Doji candlestick pattern. Both have wicks that extend higher and lower and are considered neutral patterns.<br /> <br /> <img alt="Doji candles vs Spinning Top candles" src="/getmedia/421a31a0-fcf8-40f9-a836-306d541acecf/Doji-candles-vs-Spinning-Top-candles.png" /><br /> However, Doji candles have a shorter wick and no, or almost no body. Spinning tops have longer wicks extending to both sides, while the body is also longer, although still short. <h2>How does a Spinning Top candle work?</h2> A Spinning Top candlestick pattern forms when the price moves in one direction and then aggressively reverses in the opposite one. At the end of the candle's timeframe, both sides settle for a draw as the closing price appears near the opening price. This means neither bulls nor bears have the upper hand on the market. Both powers are strong enough to push the price higher and lower, but neither could force a close on their side. That’s why it is classified as a neutral pattern.<br /> <br /> At the same time, in a strong uptrend or downtrend, the Spinning Top shows that there is a new balance of forces, where the opposite side of the prevailing trend is gaining more control. This indicates that the short-term outcome is uncertain, and the trend may weaken. <h2>How to trade with a Spinning Top pattern</h2> Like with any other candlestick pattern, a trading strategy with a Spinning Top candle depends on traders’ risk appetite. Moreover, it is also important whether they open long-term or short-term positions.<br /> <br /> For example, the image below shows that the downtrend has reversed after the Spinning Top candle appeared. However, it didn’t happen right away. The first candle after the Spinning Top was strongly bearish, and many traders could have considered it a trend continuation signal.<br /> <br /> <img alt="Trading with a Spinning Top candle" src="/getmedia/ba322613-3865-4999-bbd5-1a8525e4f279/Trading-with-a-Spinning-Top-candle.png" /><br /> Risk-tolerant bears had a chance to capitalise on the short-term downward price movement, but in the long term, the price went upward, although with a lot of volatility on its way. That’s why a Spinning Top is considered a suggestion and not a strong entry signal.<br /> <br /> Risk-averse traders usually wait for a trend confirmation before they open a position – three higher highs and higher lows for an uptrend and three lower highs and lower lows for a downtrend. As you can see, there was no strong uptrend confirmation either, as the second candle after the Spinning Top had a lower low than the first one, indicating market volatility and indecisiveness.<br /> <br /> In such cases, adding insights provided by other technical analysis tools can help traders decide on a trading opportunity.<br /> <br /> For example, the image below illustrates a Spinning Top candle used with trendlines to find a price breakout. Moreover, because a strong uptrend preceded it, this candle indicated a trend reversal.<br /> <br /> <img alt="Spinning Top candle with trendlines in a price chart" src="/getmedia/812d4d52-085c-492f-9d03-0ca9bcae376f/Spinning-Top-candle-with-trendlines-in-a-price-chart.png" /><br /> <br /> If you are familiar with technical indicators, they may also be handy in clarifying market signals. However, keep in mind that no technical tool provides 100% accurate trading signals, and it is important to always use risk management tools to prevent bigger than expected losses.<br /> <br /> Using a demo account proves to be helpful as well when it comes to planning a trading strategy. Create one for free and practise finding candlestick patterns and opening positions in a risk-free market environment. If you want to know more patterns, head to our next article, where we explain how <a href="/trading-academy/forex/analysis/bullish-bearish-engulfing-patterns">Engulfing candles</a> work.
Hanging Man vs Shooting Star candlestick patterns
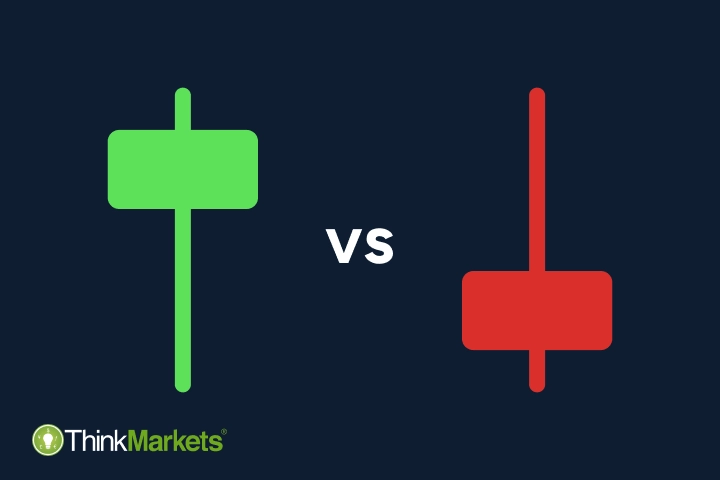
<p>The hanging man and shooting star candles are often considered a part of the hammers group, along with the hammer and inverted hammer. All four patterns are indeed very alike in their structure and are single-candle reversal chart patterns.</p> <p>As we mentioned in our previous article about <a href="/uk/trading-academy/indicators-and-patterns/hammer-candlestick-pattern/">hammer candle stick patterns</a>, the main difference is that the hanging man and shooting star appear in uptrends, while both hammers occur in a downtrend. Hence, the hanging man and shooting star patterns are considered bearish – the opposite of bullish hammers.</p> <p><img alt="Hanging Man vs Shooting Star vs Hammer vs Inverted Hammer" src="/getmedia/7bdfd60c-d229-4aa6-ade5-26a2e31a7679/Hanging-Man-vs-Shooting-Star-vs-Hammer-vs-Inverted-Hammer.png" /></p> <h2 paraeid="{a93e94ed-6fea-4c9f-a350-f7bc6677a4d1}{52}" paraid="1878194966">Hanging man candlestick pattern</h2> <p>A Hanging man formation is the uptrend version of a hammer candlestick. Their structures are virtually the same – little to no upper shadow (wick), a small body with the high, closing and opening price close to each other and a long wick extending to the bottom. The lower wick is usually at least twice as long as the body. </p> <br /> <img alt="Bearish and bullish Hanging Man pattern" src="/getmedia/8c89ad4d-4b7e-43a4-bc9e-c257d070c474/Bearish-and-bullish-Hanging-Man-pattern.png" /> <p>A Hanging man candle can also be bullish (green) and bearish (red). Since this is a bearish reversal pattern, the red version of it is usually considered a stronger indication of the potential trend reversal.</p> <h2>Shooting star candlestick pattern</h2> <p>A shooting star candle is the uptrend version of the inverted hammer candlestick. Its short body is created by the closing, opening and high prices located near each other and a twice as long wick protruding upward. A lower shadow is usually either very short or doesn’t occur at all. </p> <br /> <img alt="Bearish and bullish Shooting Star candlestick pattern" src="/getmedia/a10c2061-e0ae-4a23-a28f-01798e0bd049/Bearish-and-bullish-Shooting-Star-candlestick-pattern.png" /> <p>Similar to the hanging man candle, a bearish shooting star formation is considered stronger due to the overall bearish nature of the pattern. </p> <h2>How do hanging man and shooting star candles work?</h2> <p>Occurring in an uptrend, both hanging man and shooting star indicate that the trend is losing its momentum, and bears are trying to overpower the bulls.</p> <p>The hanging man candle tells us that, although bulls still have some power that helped them to achieve a high close, bears were powerful enough to push the price much lower to create a long wick at the bottom.</p> <p>The shooting star pattern is considered stronger than the hanging man candle because bears managed to push the closing price to the bottom despite the long wick at the top created by bulls.</p> <h2>How to trade with a hanging man and shooting star</h2> <p>When a hanging man and shooting star patterns occur, traders have two options. The first option is to go short right away, using the candle’s closing price as an entry point and its high price as a stop loss. The second option is to wait for two to three candles to close and confirm a trend.</p> <p>There is no right or wrong decision, as it depends purely on the trader’s perception and risk appetite. However, it is important to keep in mind that neither hanging man nor shooting star candles serve as a direct trading signal. Just like any other chart pattern or technical indicator, they only suggest that a bullish trend is weakening, and price reversal may occur. It doesn’t necessarily mean that the price will reverse right after the hanging man or shooting star candle – it may take some back and forth between bulls and bears.</p> <p>As you can see on the image below, a shooting star was formed at the end of the uptrend. However, the price didn’t reverse immediately. It took a hanging man and some side traction for bears to assume power and turn the trend downward.</p> <br /> <img alt="Identifying Shooting Star and Hanging Man candlestick patterns in a price chart" src="/getmedia/c3064b11-26bb-441e-979f-6e7c8351b039/Identifying-Shooting-Star-and-Hanging-Man-candlestick-patterns-in-a-price-chart.png" /> <p>It may also be helpful to confirm the trading signal you identified with other technical analysis tools, such as <a href="/uk/trading-academy/technical-analysis/support-resistance/">trendlines</a> and <a href="/uk/trading-academy/indicators-and-patterns/technical-indicators-beginners-guide/">technical indicators</a>.</p> <p>Another important set of tools to use are risk management tools – stop loss and take profit. We suggest using them at all times to prevent larger than expected losses.</p> <p>Create a free demo account to practise identifying Hanging Man and Shooting Star candlesticks and opening positions in a risk-free environment. To discover more helpful chart patterns, head to our next article, where we will explain how a <a href="/uk/trading-academy/indicators-and-patterns/spinning-top-pattern/">spinning top candle</a> works.</p>
What is the Doji candle pattern?
<p>A doji candlestick is a short-term pattern made of a single candle. Doji translates as “the same thing” from Japanese. It’s the perfect name for a candle that has its open and close prices at the same or almost the same level, making the body of a doji candle very small.</p> <p>The reason for this is the balanced power of bulls and bears, with neither being in control. Dominated by wicks, a doji candle often indicates indecision in the market.</p> <p>This type of candlestick can be classified as both a reversal and continuation pattern. The signal doji provides depends on the shape of a candle and its positioning within the trend.</p> <h2>Types of doji candles</h2> <p>Analysts distinguish five types of doji patterns:</p> <ul> <li>Doji Star (Neutral)</li> <li>Four-price doji</li> <li>Long-legged doji</li> <li>Gravestone doji</li> <li>Dragonfly doji</li> </ul> <h2>Doji star candlestick pattern (neutral doji)</h2> <br /> <img alt="Doji Star candle" src="/getmedia/f06ed2c2-224a-4ec9-ad3d-d0b00f809296/Doji-Star-candle.png" /><br /> <p>A doji star candle looks like a cross with a very short body in the middle and both wicks of similar length. This type of candlestick can occur at the end of the downtrend or in the closing stages of the uptrend. This may signal the trend weakening and a potential upcoming reversal.</p> <h2>Four-price doji</h2> <br /> <img alt="Four-price Doji candle" src="/getmedia/21738b3c-89de-4037-9d05-8750295aac1c/Four-price-Doji-candle.png" /><br /> <p>The four-price doji is a very rare formation that looks like a horizontal line with high, low, opening and closing prices at the same, or nearly the same, level. This doji pattern signals very low volatility and high indecisiveness in the market. Similar to the neutral doji, the four-price doji may indicate the trend weakening.</p> <h2>Long-legged doji candlestick pattern</h2> <br /> <img alt="Long-legged Doji candle" src="/getmedia/540cf30b-9488-46c8-a9a6-bbe92e3e67bf/Long-legged-Doji-candle.png" /><br /> <p>A long-legged foji, or a ‘rickshaw man’, is similar to a doji star but has longer wicks on either side. This type of candle also signals indecision as there is no clear indication about the future trend but with much higher volatility on the market.</p> <p>A long-legged doji candlestick formation can occur in both strong uptrends and downtrends, suggesting that the current trend may be in the closing stages, and a reversal may take place soon.</p> <h2>Gravestone doji candlestick pattern</h2> <br /> <img alt="Gravestone Doji – a bearish reversal candlestick pattern" src="/getmedia/e9104f26-7bfc-4b19-9cdb-0b66743c996a/Gravestone-Doji-%e2%80%93-a-bearish-reversal-candlestick-pattern.png" /><br /> <p>A gravestone doji candle has a very long upper wick and a considerably shorter lower wick, with the candle’s body located close to the bottom.</p> <p>It is a bearish reversal pattern that often takes place at the end of the uptrend. The gravestone doji suggests that the bulls have pushed the price higher but could not force a close near the candle’s high price. As a result, the bears were able to return the price lower, bringing the open, close, and low prices to almost the same level, which may indicate the impending reversal of the price direction.</p> <p>On the other hand, when found in the downtrend, the gravestone doji may indicate its continuation.</p> <h2>Dragonfly doji candlestick pattern</h2> <br /> <img alt="Dragonfly Doji – a bullish reversal candlestick chart pattern" src="/getmedia/630b1b89-7ccc-4496-aa66-0af48ad588de/Dragonfly-Doji-%e2%80%93-a-bullish-reversal-candlestick-chart-pattern.png" /><br /> <p>A dragonfly doji candlestick formation is the opposite of a gravestone doji.</p> <p>It’s a bullish signal with a very long lower wick, a much shorter upper wick, and the body located closer to the top. Thus, in a dragonfly doji candle, the open, high, and close prices are all very close to each other.</p> <p>This type of candle can occur in both uptrend and downtrend, but it is considered to be stronger when it takes place at the bottom of the downtrend and often suggests an upcoming price reversal.</p> <br /> Found in the uptrend, a dragonfly doji may indicate its continuation. <h2>How to trade with the doji candlestick</h2> <p>The doji candle alone is usually not strong enough to provide a definitive trading signal, so it is often used in combination with other technical analysis tools to support the findings.</p> <p>Support and resistance level are some of the most commonly used tools with a doji candle. For example, on the image below, you can see a gravestone doji that closed near the resistance level of the uptrend. It means that the higher price was rejected, and bears pushed the price to stay within the trend channel. Since bears had slightly more control over the market, they kept pushing the price down, causing the trend to change its direction.</p> <br /> <br /> <img alt="Trading with a Doji candle and support and resistance levels" src="/getmedia/9c17bd9d-3e86-49de-8426-f5a9874cf14e/Trading-with-a-Doji-candle-and-support-and-resistance-levels.png" /><br /> <p>Another way to trade with a doji candle is to spot two consecutive doji candles, which usually means even greater indecisiveness on the market. When two candles appear one after another in a trend channel, it often results in a trend reversal.</p> <br /> <br /> <img alt="Trading with a double Doji candle" src="/getmedia/e1a02e93-7d33-4bdc-b100-5b9b7338f7cb/Trading-with-a-double-Doji-candle.png" /><br /> <p>One more popular method of trading with a doji candle is to use it with the RSI oscillator. As you can see on the image below, doji candles appeared in the uptrend, signalling indecisiveness. At the same time, RSI suggests the instrument is overbought. These two factors resulted in the trend reversal</p> <br /> <br /> <img alt="Trading with a Doji candlestick and RSI indicator" src="/getmedia/ad2dabe0-1248-4e82-af28-d691c091705e/Trading-with-a-Doji-candlestick-and-RSI-indicator.png" /><br /> <p>These are just a few examples of potential positions with doji candles. Keep in mind that the appearance of these candlestick patterns does not guarantee trend reversal or continuation – it is merely an indication. That’s why using risk management tools is crucial to prevent unexpected losses should the market move in the opposite direction of your prediction.</p> <p>Create a demo account to practise trading with doji candles, stop loss and take profit. Ready for more technical analysis tools? Move to our next article, where we explain how the <a href="/uk/trading-academy/indicators-and-patterns/hammer-candlestick-pattern/">hammer and inverted hammer chart patterns work</a>.</p>