 ZA
ZA
Articles (3)
Trendlines in technical analysis: support and resistance explained
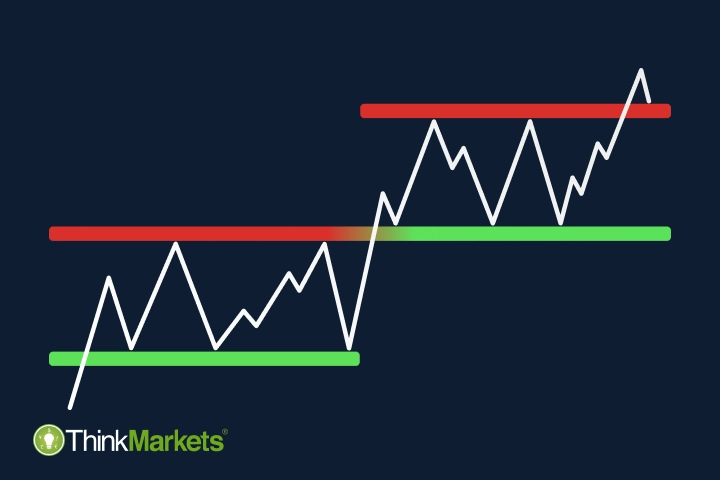
<p>Identifying trends is often a starting point of the technical analysis journey for many beginners, as it's the most beginner-friendly way to find trading opportunities.<br /> <br /> In this article, we'll explain what trendlines are, how support and resistance work and how to spot potential entry points in a market.</p> <h2>What are trendlines?</h2> <p>A trendline is a line connecting two or more price points in a chart. Traders draw this line with the help of various drawing tools offered by almost every trading platform.<br /> <br /> For example, here is a wide selection of drawing tools on ThinkTrader, ThinkMarkets' proprietary trading platform.<br /> <br /> <img alt="Drawing tools on ThinkTrader" src="~/getmedia/d039a5ad-8318-4690-b5c8-01063a5ee1e0/Drawing-tools-on-ThinkTrader.png" /></p> <h2>Support and resistance</h2> <p>Trend lines are used to identify the trend direction of an instrument, and to indicate potential support and resistance.<br /> <br /> Both support and resistance represent levels where a price bounces back and starts moving in the opposite direction.<br /> <br /> <img alt="Support and resistance levels" src="~/getmedia/68c1b4f5-a387-4380-ad1b-d8326d955bd7/Support-and-resistance-levels.png" /><br /> <br /> As you can see in the image, resistance is located on top of the price channel. It is called so because that's where the rising price meets resistance and slows down. On the other hand, the support level is located at the bottom of the price channel that's where the falling price is supported and slowed down.</p> <h2>How do support and resistance work?</h2> <p>Price movements and direction depend on market psychology and how many bullish and bearish traders are active on the market at any given time.<br /> <br /> When the market has more buyers than sellers and subsequently more buy positions than sell positions, it pushes the price higher toward the resistance level. As it approaches the level, traders that bought at lower levels will realise that the price reversed lower from the same price in the past and take the opportunity to lock-in profits. As there are more sellers than buyers at the resistance level, the price will reverse again, and reach a new resistance level.<br /> <br /> There is no set timeframe for identifying the previous price reversal level. It could have happened a few days, weeks or months ago. It is important to note that the more often the price bounced off to the same level in the past, the higher the chances it will happen again. The older the resistance level, the more important it becomes.<br /> <br /> If bullish traders overpower bearish, which means more people buying (going long) than selling (going short), the price rises and breaks through the resistance level. This breakthrough is usually caused by some external news on the market, such as a new monetary policy announcement, that can be identified with the help of fundamental analysis.<br /> <br /> Once the breakout happens, the role of support/resistance usually flips – resistance becomes support, and if the breakout happens in a downward movement, support becomes resistance.<br /> <br /> <img alt="Resistance level reversed into support level" src="~/getmedia/85ee2f59-6c3f-45f2-9598-0ef19d15f71b/Resistance-level-reversed-into-support-level.png" /></p> <h2>How to find support and resistance levels</h2> <p>Both support and resistance can be very helpful tools to identify a potential trading opportunity because once a breakout occurs, it may indicate a potential entry point for a position in the same direction.<br /> <br /> To identify and draw support and resistance in a chart, you need to find and connect the highs and the lows (also called peaks and troughs) of the same price level. You don’t necessarily need to look for both levels simultaneously – even one of them can be quite insightful.<br /> <br /> For example, on the image below, you can see how we identified a level that was both support and resistance during different periods of time.<br /> <br /> <img alt="A valid trend line as both support and resistance." src="~/getmedia/3cb82df4-4120-4601-b438-5916187ef0c1/A-valid-trend-line-as-both-support-and-resistance.png" /><br /> <br /> One more factor to pay attention to is that when the price approaches the support/resistance level or even when it breaks through, it can trigger a lot of hesitation on the market with an equal number of bullish and bearish activities creating sideways price movement.<br /> <br /> Once you find such a movement, you can add an additional support or resistance level there that will serve as an extra suggestion for a trading opportunity.<br /> <br /> For example, on the image below, you see the same <a href="~/en/eur-usd">EUR/USD</a> chart with support and resistance levels and an additional support level:<br /> <br /> <img alt="Additional support level in a price chart" src="~/getmedia/2ebfa33c-4579-4b03-9c80-f648f967225c/Additional-support-level-in-a-price-chart.png" /><br /> <br /> Once you are comfortable with drawing support and resistance, you can step up your technical analysis and try to identify trends.</p> <h2>What are trends in trading?</h2> <p>A trend in trading, just like in any other aspect of life, means a general direction of movement or development. When experienced traders talk about trends and trend trading, they imply the direction of price movements of an instrument.<br /> <br /> All trends are formed by a succession of highs and lows. To identify one, you need to connect these highs and lows in the same manner you did, drawing support and resistance.<br /> <br /> For example, on the image below, we connected the highs of a certain part of the chart with one trendline and the lows with another one. Such formation is called a channel, and the two trendlines essentially serve as support (the lower one) and resistance (the higher one).<br /> <br /> <img alt="How to draw trend lines in a price chart" src="~/getmedia/9a9c2e1a-521c-41cc-a3fa-d4599e5bcb5e/How-to-draw-trend-lines-in-a-price-chart.png" /><br /> <br /> As you can see, the resistance line doesn’t connect all the available highs, as one of them goes through the line. Keep this thought; we’ll explain what it means further in the article.</p> <h2>Bullish, bearing and sideways trends</h2> <p>The direction of the channel can tell us whether a trend is bullish, bearish or sideways – the only three possible types of trends.<br /> <br /> If a trend is upward, it is called bullish. It can also be defined as higher highs and lower lows. A downward trend is considered bearish, as it forms lower highs and lower lows. When highs and lows are not reaching new grounds and moving horizontally instead, a trend is considered sideways.<br /> <br /> <img alt="Bullish, bearish and sideways trends" src="~/getmedia/28a29822-4d0f-42d8-98e0-8ec6c19bbc63/Bullish,-bearish-and-sideways-trends.png" /><br /> <br /> To confirm whether you have identified the correct trend, you need to wait for at least three price movements and analyse their highs and lows. On the image below, you can see how the price formed a higher high first, then a higher low and then moved past the previously formed high; hence we can consider this trend bullish.<br /> <br /> <img alt="Trend formation" src="~/getmedia/8890c69e-3dbf-4b78-8b98-28904bef66bc/Trend-formation.png" /></p> <h2>Trends within trends</h2> <p>There are two ways to look at trends. You can zoom in and consider smaller individual price movements, or you can zoom out and take a look at a bigger trend.<br /> <br /> Charles H. Dow, a founder and co-founder of multiple financial entities, such as the Dow Jones stock index and The Wall Street Journal, developed the Dow theory, where he identified three types of trends by their size:</p> <ul> <li>Minor trend – day-to-day prices; </li> <li>Secondary trend – bigger trends; </li> <li>Primary trend – long-term trends, called bull or bear trends. </li> </ul> <br /> On the image below, you can see a graphic representation of such trends:<br /> <br /> <img alt="Primary, secondary and minor trends graphic." src="~/getmedia/9865d22d-07db-4952-ae4f-4eac931f21b1/Primary,-secondary-and-minor-trends-graphic.png" /><br /> <br /> The next image shows a real-life example of all three trends within each other on a EUR/USD chart:<br /> <br /> <img alt="Primary, secondary and minor trends on a price chart" src="~/getmedia/eff31d3a-a3a2-4557-95cd-4d453d06d821/Primary,-secondary-and-minor-trends-on-a-price-chart.png" /><br /> <br /> Experienced traders tend to use a combination of different trend sizes to find the best trading opportunities. Some start from a primary trend and move inward – to the secondary one, followed by the minor one, while others do the opposite. If, during this research, breakouts overlap in multiple trend channels, it usually indicates a stronger trading signal.<br /> <br /> It can also be useful to switch timeframes to confirm the findings. For example, you can use 1-day candlesticks for primary and secondary trends and 1-hour candlesticks for minor trends identification. There are no set rules; it is up to every trader's individual preference.<br /> <br /> Essentially, no matter which trend size you are looking at, from the technical analysis standpoint, they all follow the same logic. Once the price breaks through the support or resistance, it may indicate a trading opportunity. This happens because trends tend to reverse after the breakout.<br /> <br /> <img alt="Price breakout on a chart." src="~/getmedia/a8466348-db0f-4ed4-82fb-0ceca2653a14/Price-breakout-on-a-chart.png" /> <p> </p> <h2>False breakouts</h2> <p>It is important to keep in mind that a breakout doesn't necessarily mean that the trend will reverse. Sometimes false breakouts occur, and after a short movement through a trendline, the price moves back to the channel.<br /> <br /> <img alt="False breakouts on a price chart." src="~/getmedia/76376df2-fb56-46c3-af81-e0b3bbc7007f/False-breakouts-on-a-price-chart.png" /><br /> <br /> That's why every breakout needs to be studied closely to understand whether the trend is weakening and showing signs of an upcoming reverse. It can be observed when the price stops following the trend's pattern.<br /> <br /> For example, in a bearish trend – lower highs and lower lows – the price suddenly forms a higher or equal high and a higher or equal low:<br /> <br /> <img alt="The signs of trend weaking and trend reverse." src="~/getmedia/913cfcd5-3c2b-4aa2-aebd-401e7225ddbe/The-signs-of-trend-weaking-and-trend-reverse.png" /><br /> <br /> If we zoom in on the breakout on our EUR/USD chart, we can see how It works in a real trading environment:<br /> <br /> <img alt="Studying price data to identify false breakout." src="~/getmedia/bda471ed-0370-43b4-b2e4-7c102aebb831/Studying-price-data-to-identify-false-breakout.png" /><br /> <br /> As we mentioned previously, to confirm a trend, you need to observe at least three price movements following the pattern.<br /> <br /> On the image above, when the price breaks through the resistance level in the upward movement first, the third candle has the same high as the second, which means the trend is weak. Indeed, the price returns to the channel after that, revealing the false breakout.<br /> <br /> On the contrary, the second time the price breaks through the same resistance level, the first three candles have higher highs and higher lows, forming a new bullish trend in an upward movement.<br /> <br /> However, it's important to keep in mind that any indication of a potential trading opportunity you find is no more than just an indication, and it is never a guaranteed signal. Experienced technical analysts use multiple tools to analyse price charts, compare their findings and confirm the probability of a certain price movement in the future. In our following articles, we will talk about chart patterns and technical indicators to equip you with more technical analysis tools.<br /> <br /> Meanwhile, you can practise finding support and resistance levels in a chart with your demo trading account. Identify entry points and see if the price behaves as you predicted in a risk-free trading environment with virtual money.</p>

What is technical analysis in trading?
<p>The most important part of any trading strategy is knowing when to enter and exit the market. In our previous trading guides and articles, we covered various factors influencing price movements in financial markets, such as economic indicators and political climate.<br /> <br /> Analysing such factors is called fundamental analysis, and it is a very popular method to evaluate future price movements among traders.<br /> <br /> However, some traders consider insights found with the help of fundamental analysis insufficient to provide exact buy and sell levels. That’s where technical analysis can be useful.</p> <p>In this article, we’ll explain what technical analysis is, how it works, and its main types.</p> <h2>What is technical analysis?</h2> <p>Technical analysis is the process of evaluating past price movements of an instrument to determine its future moves. The reason it’s called technical is because it’s based purely on statistics and is not affected by news, economic or political factors.<br /> <br /> While this method is widely used by traders all over the globe, it’s important to understand that past prices don’t predict or dictate future prices, and all the insights gathered with the help of technical analysis are solely indicative.<br /> <br /> Technical analysis includes multiple tools. An experienced technical analyst usually uses various combinations of them to compare results and make an informed trading decision. These tools can be divided into three categories: trend lines, chart patterns and technical indicators.<br /> <br /> All three analyse price charts. So whichever type you choose, the single most important thing is to learn how to read price charts.</p> <h2>What is a price chart?</h2> <p>A price chart in trading is a graphic sequence of historical prices of an instrument. Charts are at the heart of trading as they help traders to monitor the value of their current positions, analyse past price movements and get cues as to where the price may move next. Understanding how to read a price chart is a key step in learning technical analysis.<br /> <br /> Each trading platform offers a different set of various chart types, and the choice depends purely on a trader’s personal preference. ThinkMarkets’ proprietary platform ThinkTrader, for example, has over 15 different charts to accommodate traders’ needs.<br /> <br /> <img alt="" src="/getmedia/6aae82dc-4ad4-43ba-9b7b-fdbf2373e549/article-what-is-technical-analysis-price-chart-1.webp" style="width: 552px; height: 464px;" /><br /> <br /> Some popular ones are candlestick, bar and line charts:<br /> <br /> <img alt="" src="/getmedia/ffc042b3-bc5a-4a9e-81e8-da5cb1ba5b5c/article-what-is-technical-analysis-chart-types.webp" style="width: 552px; height: 258px;" /><br /> <br /> As a candlestick chart is the most commonly used by traders, let’s see how it works in detail.</p> <h2>Candlestick chart</h2> <p>A candlestick chart is called so because each unit of it looks like a candle. The time frame of candles can be adjusted from one minute to one month, depending on the strategy:<br /> <br /> <img alt="" src="/getmedia/0f95f823-f6c9-42e1-a8f7-dcfb6ace79e7/article-what-is-technical-analysis-candlestick-chart.webp" style="width: 552px; height: 431px;" /><br /> <br /> Regardless of the chosen time frame, each candle consists of two main elements: the wick and the body that represent four prices of an instrument:</p> <ul> <li>Opening price</li> <li>Highest price reached during the chosen period</li> <li>Lowest price reached during the chosen period</li> <li>Closing price</li> </ul> <p><br /> The candles are coloured depending on whether the market rose or fell during the selected timeframe. Green candles (white on some platforms) indicate rising or bullish prices, and red (black) represent falling prices, also called bearish.<br /> <br /> <img alt="" src="/getmedia/38272a03-b39f-4a17-85b3-e0377aacfc0a/article-what-is-technical-analysis-candlestick-wicks.webp" style="width: 552px; height: 327px;" /><br /> <br /> In technical analysis, it is exactly the relationship between individual candlesticks that helps traders predict a future price movement.</p> <h2>Types of technical analysis</h2> <p>As we mentioned above, technical analysis tools can be segregated into three categories: trend lines, chart patterns and technical indicators.</p> <h5>Trend lines</h5> <p>Prices never move in straight lines. Influenced by many factors, they move up and down, forming highs and lows. A trend means the overall direction of the price movements. Trend lines are just straight lines that traders use to connect highs and lows on a price chart to identify a trend. Some trend lines, such as support and resistance, are used to identify an entry and exit level before opening a position.<br /> <br /> In one of our following articles, we’ll explain how trend analysis works and how to identify a trend in detail.</p> <h5>Chart patterns</h5> <p>A chart pattern is a graphic sequence of lines that can be identified on a price chart. Chart patterns are very popular among traders as they can often signal the beginning, end, strengthening or weakening of a trend.<br /> <br /> We’ll go through the most popular patterns in one of our next articles as well and explain how they work.</p> <h5>Technical indicators</h5> <p>Technical analysis indicators are mathematical calculations based on historical data and used to identify price action. As complex as it sounds, traders don’t need to do the actual math. Every trading platform offers technical indicators that can be simply applied to a price chart. The main goal for a trader is to learn how to read them.<br /> <br /> Depending on their types, technical indicators can analyse trend direction and strength and identify potential entry and exit points. We will cover this topic in detail in our following articles too.<br /> <br /> For now, to start getting familiar with technical analysis, we suggest creating a <a href="~/en/demo-account">risk-free demo account</a> on ThinkTrader and studying various price charts. You will be able to use the same platform to continue your journey with technical analysis, as it offers an extensive suite of analytical tools.<br /> </p>
How to start trading the markets
<h2 id="how-to-start-heading-unique-id-1">Step 1 – Apply for an account with us</h2> We offer a wide range of financial instruments to trade across two of the industry’s leading platforms: MetaTrader 4 (MT4) and our very own ThinkTrader®. Simply apply for an account and provide us with the requested documentation and once approved, we’ll provide you with your login details to access your trading account for the very first time.<br /> <br /> <a href="https://portal.thinkmarkets.com/account/register/live?lang=en" id="button-one">Apply today</a><br /> <h2 id="how-to-start-heading-unique-id-2">Step 2 – Time to fund</h2> Once your account is opened you’ll be able to fund it and place your first trade. Funding your account is simple with our online client portal, ThinkPortal. In ThinkPortal you’ll have access to a wide list of funding options, from credit/debit card and bank wires to local payment providers and digital wallet services. The funds will usually be in your account within 12 hours and you’ll be ready to place your first trade.<br /> <br /> <a href="https://portal.thinkmarkets.com/" id="button-two">Fund your account</a><br /> <h2>Step 3 – Let’s get trading</h2> <p>Now that your account is open and funded, you can take that final step and open your first position. Here are a few pointers to help you get started:<br /> </p> <p>Remember – never place a trade that you’re not sure about. Your investment is at risk with every trade you place, so make sure you’re fully behind the decision of placing the trade before hitting the button.<br /> </p> <p> </p> <ol> <li> <p>Understand the markets – ensure you know what you want to trade and when to trade it. Our market analysis section provides plenty of market insight on a daily basis and becoming familiar with our analysts and their articles can be a helpful place to keep track of market news and trading opportunities.</p> </li> <li> <p>Know the platform – before opening your first trade we highly recommend that you become familiar with the platform of your choice. Explore the different platform features and ensure you’re comfortable with the settings before opening the order ticket for the first time. Read about our ThinkTrader® and MetaTrader 4 (MT4) platforms <a href="/en/platformoverview/">here</a></p> </li> <li> <p>Place your trade – once you’re comfortable within the platform, identify the trade you want to make and how you plan to execute it, open the order ticket, set your parameters and place the trade.</p> </li> </ol>
Ready to trade?
Ready to start your trading journey with ThinkMarkets? Apply for an account in just a matter of minutes.


