Trading the Double Bottom Pattern
We will now use the same example to show you how to trade the double bottom pattern. This example also offers great insight into how the failed breakouts work. As you can see in the chart below, as soon as the price action created a second bottom, it surged higher, breaking above the levels where two previous highs were recorded.
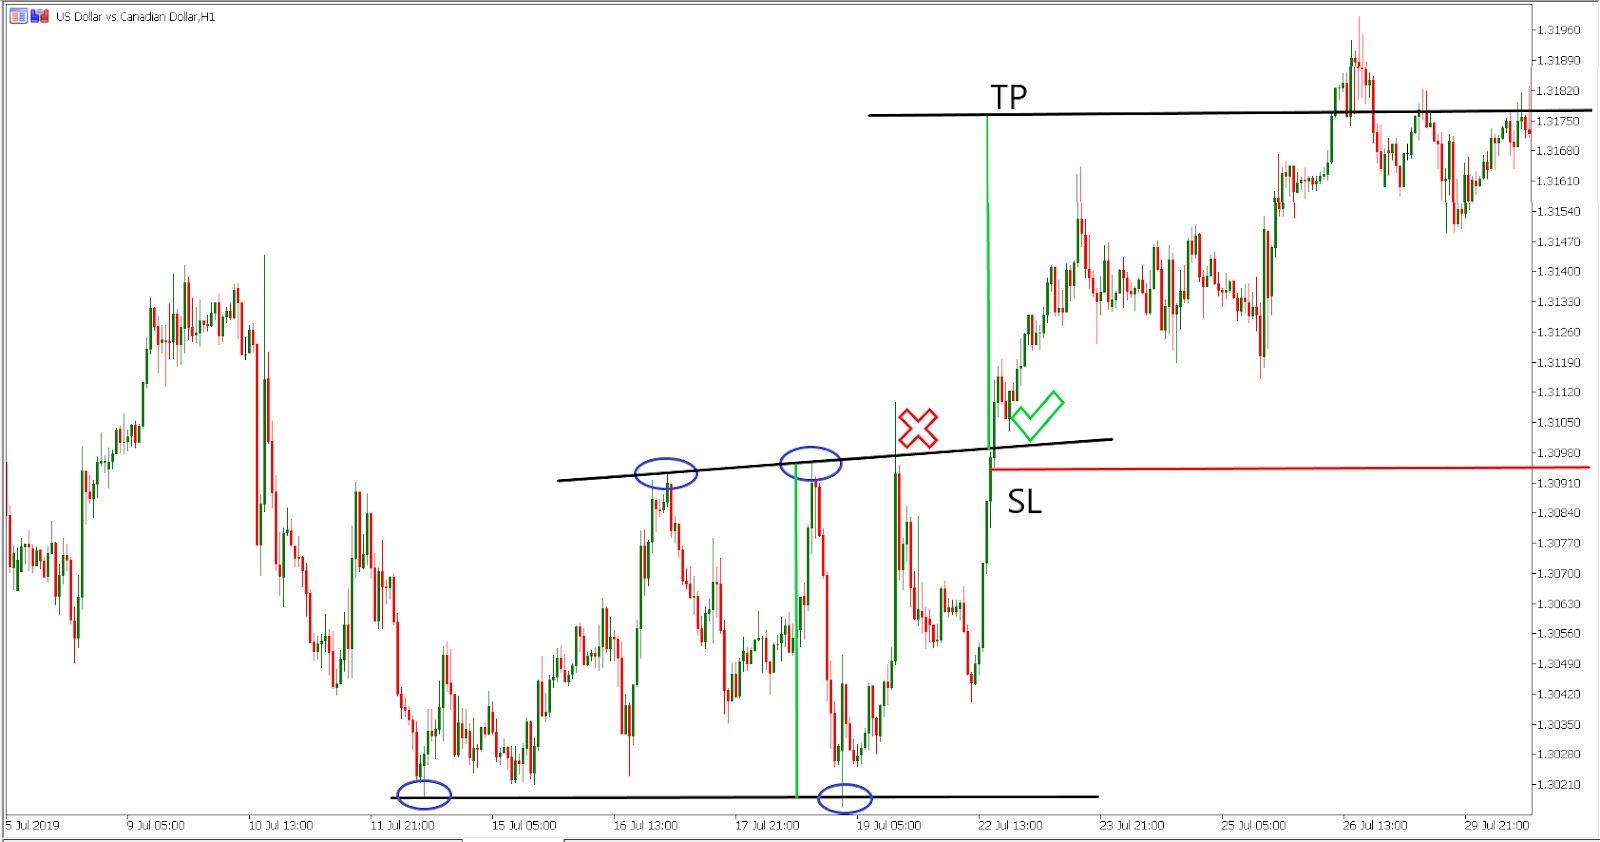
However, this proved to be a failed breakout as the price quickly returned below the neckline. This perfectly shows how important the virtue of patience is in trading. Moreover, this also shows why it is important to wait for a close above the neckline before entering the market.
The failed breakouts are usually followed by a sharp move lower to punish the buyers for failing to finalize the initial move higher. This is exactly what happened. However, the buyers regrouped at lower prices, and launched another strong push higher to ultimately break above the neckline around the $1.31 handle.
Hence, our entry is at $1.3110, a level where the USD/CAD closed above the neckline for the first time. The stop-loss should be placed below the neckline, allowing some space for the move similar to a failed breakout where the price action quickly penetrates through the support/resistance without a follow up.
The exact level for stop-loss depends on your risk tolerance, but it can range from 15 to 30 pips below the neckline. Any move and close below the neckline invalidates the activated double bottom pattern.
The take profit is calculated in the same manner as it is the case with the head and shoulders pattern i.e. measuring the distance between the supporting trend line (double bottoms) and the neckline. The same trend line is then copy-pasted from the point where the breakout occurred, with an end point of the trend line being our take profit. In our case, the trend line ends at $1.3180.
Finally, our take profit order is hit a few days later, banking us around 70 pips. Depending on your risk tolerance and stop loss position, we earned 70 pips by risking 15/30 pips, which represents a great risk-reward ratio.
Any opinions, news, research, analyses, prices or other information contained on this website is provided as general market commentary and does not constitute investment advice. ThinkMarkets will not accept liability for any loss or damage including, without limitation, to any loss of profit which may arise directly or indirectly from use of or reliance on such information.