What is Bearish Divergence?
A price chart showing bearish divergence is characterized by the formation of progressively higher highs by the price candles in the presence of progressively lower peaks formed by the oscillator’s signal line. This setup can occur in the form of a bearish divergence RSI signal or a bearish divergence MACD signal. The sole difference is that a bearish divergence RSI signal uses the price troughs formed by the single signal line to detect the divergence, while the bearish divergence MACD signal uses the peaks of the MACD lines in the indicator window as the reference signal from the oscillator. The example demonstrated below is that of a bearish divergence MACD signal.
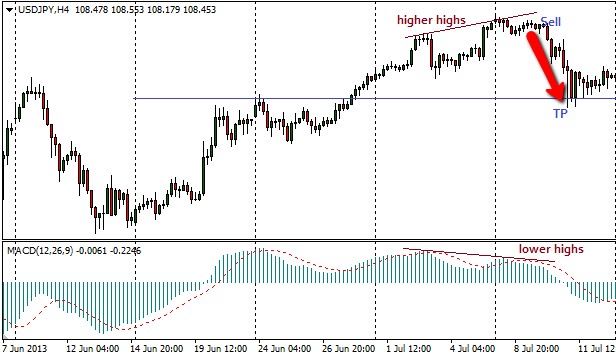
We can see that the bearish divergence MACD setup requires the identification of two progressively lower peaks on the MACD indicator line. The occurrence of the divergence setup should alert the trader towards seizing the initiative for necessary trade action.
Various platforms provide different variations of the MACD indicator. The MACD indicator used above is obtained from the ThinkMarkets MT4 platform.
The RSI can in addition, be used to spot a bearish pattern of divergence. The snapshot below illustrates how to spot a divergence using the RSI.
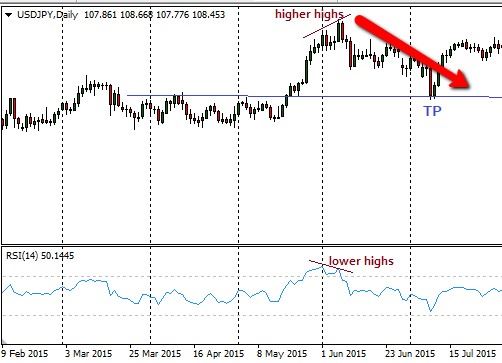
This setup may look like it delivered very little profit. The fact is that the trade was set up on a daily chart. On the daily chart, a single candle represents a whole day's price action. Some assets have daily trading ranges of up to 200 pips. So initiating a divergence trade on a daily chart provides a realistic chance of banking a lot of pips. Indeed, the move from the possible sell point at 101.17 to the take-profit area totaled nearly 287 pips. This shows the potentials that can be found in a divergence setup.
The MT5 platform possesses a Depth of Market tool which allows you to spot where the big players are setting up orders. If you employ this tool and see an increase in institutional orders in a direction which follows the divergence trade, this should give you more confidence on how to trade divergence setups. You can get the MT5 and the depth of market tool here.
The instances of the divergence trades that you have been shown are overt divergence setups. However, there are divergence setups that are not overt. These are identified as the hidden divergence patterns. Just like the overt divergence setups, hidden divergence setups can be of the bullish or bearish variety.
Typically, hidden divergences are routinely continuation patterns while the regular divergences signify price reversals. Let's look at in detail what hidden divergences are.