Please note ThinkMarkets does not provide CFD services to residents of the US.

Please note ThinkMarkets does not provide CFD services to residents of the US.

Learn To Trade
 
Indicators & Chart Patterns

Deepen your knowledge of technical analysis indicators and hone your skills as a trader.

Find your detailed guides here
Live Webinars

Boost your knowledge with our live, interactive webinars delivered by industry experts.

Learn More
Trading Glossary

From beginners to experts, all traders need to know a wide range of technical terms. Let us be your guide.

Learn more
Knowledge Base

No matter your experience level, download our free trading guides and develop your skills.

Learn more
Learn To Trade

Trade smarter: boost your skills with our training resources.

Create a live account
Market Analysis
 
Market News

All the latest market news, with regular insights and analysis from our in-house experts

Learn more
Economic Calendar

Make sure you are ahead of every market move with our constantly updated economic calendar.

Learn more
Technical Analysis

Harness past market data to forecast price direction and anticipate market moves.

Learn more
Live Webinars

Boost your knowledge with our live, interactive webinars delivered by industry experts.

Register now
Special Reports

Engaging, in-depth macroeconomic analysis and expert educational content from our in-house analysts

Learn more
Market Analysis

Harness the market intelligence you need to build your trading strategies.

Create a live account
About ThinkMarkets
 
Sponsorships

Check out our sponsorships with global institutions and athletes, built on shared values of excellence.

Learn more
About Us

Find out more about ThinkMarkets, an established, multi-award winning global broker you can trust.

Learn more
Careers

Discover a range of rewarding career possibilities across the globe

Apply now
ThinkMarkets News

Keep up to date with our latest company news and announcements

Learn more
Trading Infrastructure

When it comes to the speed we execute your trades, no expense is spared. Find out more.

Learn more
Contact Us

Our multilingual support team is here for you 24/7.

Learn more
About ThinkMarkets

Global presence, local expertise - find out what sets us apart.

Create a live account
Log in Create account

How to Use the Force Index Strategy in Trading

The force index indicator is a technical tool used by traders to measure the power behind movements in the price action. It belongs to the family of oscillators. This strategy was first documented by Alexander Elder, a trader and psychologist, in his 1993 book titled Trading for a living
 
In this blog post, we look at the basics of the force index indicator, how it is calculated, how to interpret its readings, and we share with you a simple trading strategy.

How Is It Calculated?

The force index indicator is based on price action and volume. In essence, the indicator compares the current market price with a prior market price, and multiples it with a volume over the same period. 

Based on a formula shared below, the indicator measures the strength of price movements and generates signals of potential changes in the price direction

The formula for calculating the force index is as follows:


FI(1)=(CCP − PCP)∗VFI(13)=13-Period EMA of FI(1)

The elements of this formula are:

FI = Force index
CCP = Current close price
PCP = Prior close price
VFI = Volume force index
EMA = Exponential moving average
​    
Almost all trading platforms nowadays have a built-in force index indicator, hence, you are not required to manually calculate the values. In MetaTrader5, you simply select the indicator from a drop-down menu of listed indicators, as shown in the picture below. The standard average, on which the force indicator is calculated, is 13 periods. 


Applying the Force Index indicator


Arguably the most important use of the force index indicator is to confirm breakouts and potential trend changes. It generates readings that inform the trader about the strength of a current move as values travel from a positive to a negative territory, and vice versa. 

An interesting characteristic of this indicator is that it has no bounds i.e. its values can travel up or down indefinitely. If the index goes above zero - a rising force index - it is confirming the rise in the price action. On the other hand, a falling force index generates values below zero and helps confirm a price action that is moving lower.

In a picture below, you can see the applied indicator on a NZD/USD daily chart. The values travel from positive to negative territory as the index calculates the amount of power used to move the price action around. 


Force Index indicator on MetaTrader 5


Strengths and Weaknesses

As said earlier, the force index measures the power deployed by sellers or buyers behind market movements. As such, the indicator is very effective as it practically verifies the legitimacy of a movement i.e. if the breakout is followed by a spike in the direction of a breakout it helps confirm the breakout. On the other hand, breakouts without high readings (lower volume) have a higher chance of ending up as false breakouts. 

The lower force index values are usually associated with the sideways price action, as volume is lower and price movements are not as sharp as during the breakouts. Thus, the force index readings spike in value during an uptrend and fall during downtrends. 

When it comes to the negative aspects of the force indicator, it shares the key weakness of all lagging indicators. Due to their inherent design, lagging indicators use prior price and volume data to calculate the readings. As such, they may be slow in generating signals.

For instance, the force index indicator may confirm the breakout a few sessions after the price had broken out initially. Hence, you may be stuck waiting for confirmation while the price action has already travelled significantly in a certain direction. 
Trading the Force Index Indicator The role of the force index indicator in the trading process is very similar to other oscillators and lagging indicators. Given its design, the best way to use this technical tool is to see it as a tool for confirmation of the breakouts.

The first step would be to perform a basic technical analysis and identify important price points from the perspective of supply and demand i.e. support and resistance. Once we have marked these levels on a chart, the base is set to monitor the price action closely, and wait for a potential breakout to the upside or downside to occur.
 

Let’s see an example of how to use the force index to confirm sharp movements in the price direction. We have a AUD/USD daily chart below, whose price action we can divide into two parts. The left part of the chart is characterized by the sideways price movement, which generates values around zero. 

On the other hand, the right part of the chart is when the pair is moving sharply in both directions. As a result, the force index indicator is following the price movements up and down as well.


Trading the force index indicator

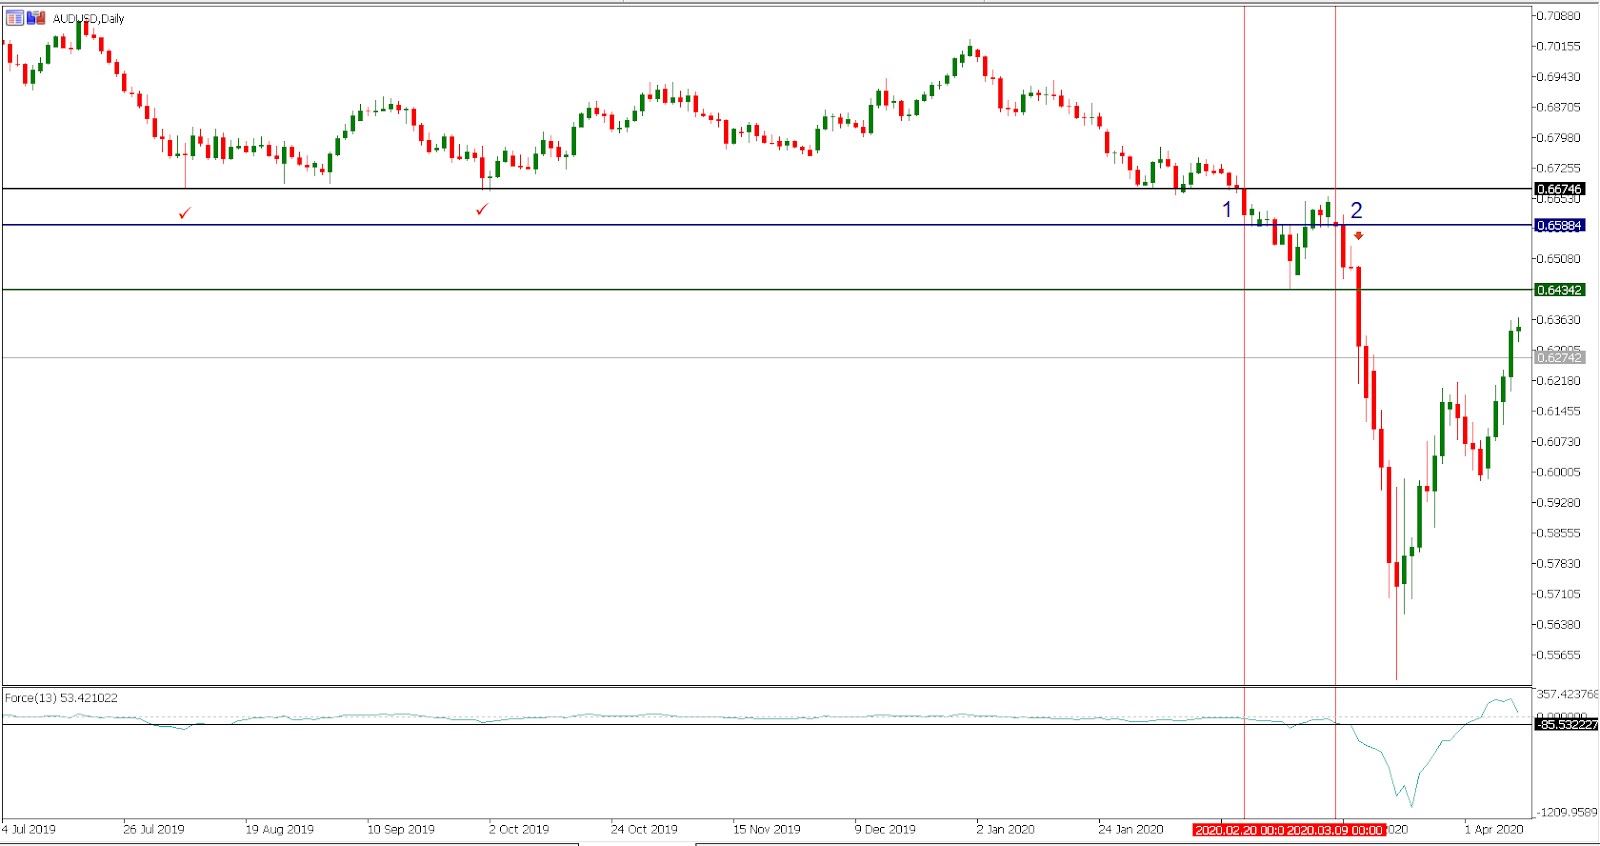
The bulls fail in an attempt to push the price action higher above the horizontal resistance, which opens up the space for the sellers to secure a bigger move lower. This time, the second attempt from the sellers to push the price action to the downside is followed by a sharp decline in values of the force index indicator - falling force index - signalling that this time there is a significant force behind this move.


Ultimately, the sellers get a move of around 1,000 pips lower. At the point where the second move lower was initiated, the force index reading was at minus-85

Entry (the blue line) should be placed at the point where it is obvious that the buyers failed to push above the horizontal resistance i.e. a change in the price direction is imminent. The stop loss is above the horizontal resistance, meanwhile we placed the take profit order where the first move lower was capped (the green line), as we have clear evidence that this level is a support now.

Ultimately, we risked 105 pips to earn 155 pips, putting the risk-reward ratio at around 1:1.5, which is acceptable.

Summary

The force index is a technical indicator which is used to calculate the power behind movements in the price action. As such, the indicator is mainly used to confirm the breakouts and identify potential changes in the trend direction. It is based on the formula that compares the current market price with a prior market price, and multiples it with a volume over the same period. 


The force index indicator belongs to the family oscillators and generates values that can travel up or down indefinitely.


Any opinions, news, research, analyses, prices or other information contained on this website is provided as general market commentary and does not constitute investment advice. ThinkMarkets will not accept liability for any loss or damage including, without limitation, to any loss of profit which may arise directly or indirectly from use of or reliance on such information.
Back to top