Reading the CCI on a MetaTrader platform
As mentioned previously, there are two areas that suggest an overbought or oversold condition.
The idea is that when the market sends the signal line above the +100 level, the trader should start to look for signs of selling or rolling over by the market.
On the other hand, if the signal line drops below the -100 level, then the market looks likely to be oversold, and the trader should be looking for the signs of a reversal.
While the market is in an overbought or oversold condition, the trader will look for candlestick formations or perhaps another indicator to tell them when it is time to act.
Take a look at the chart below.
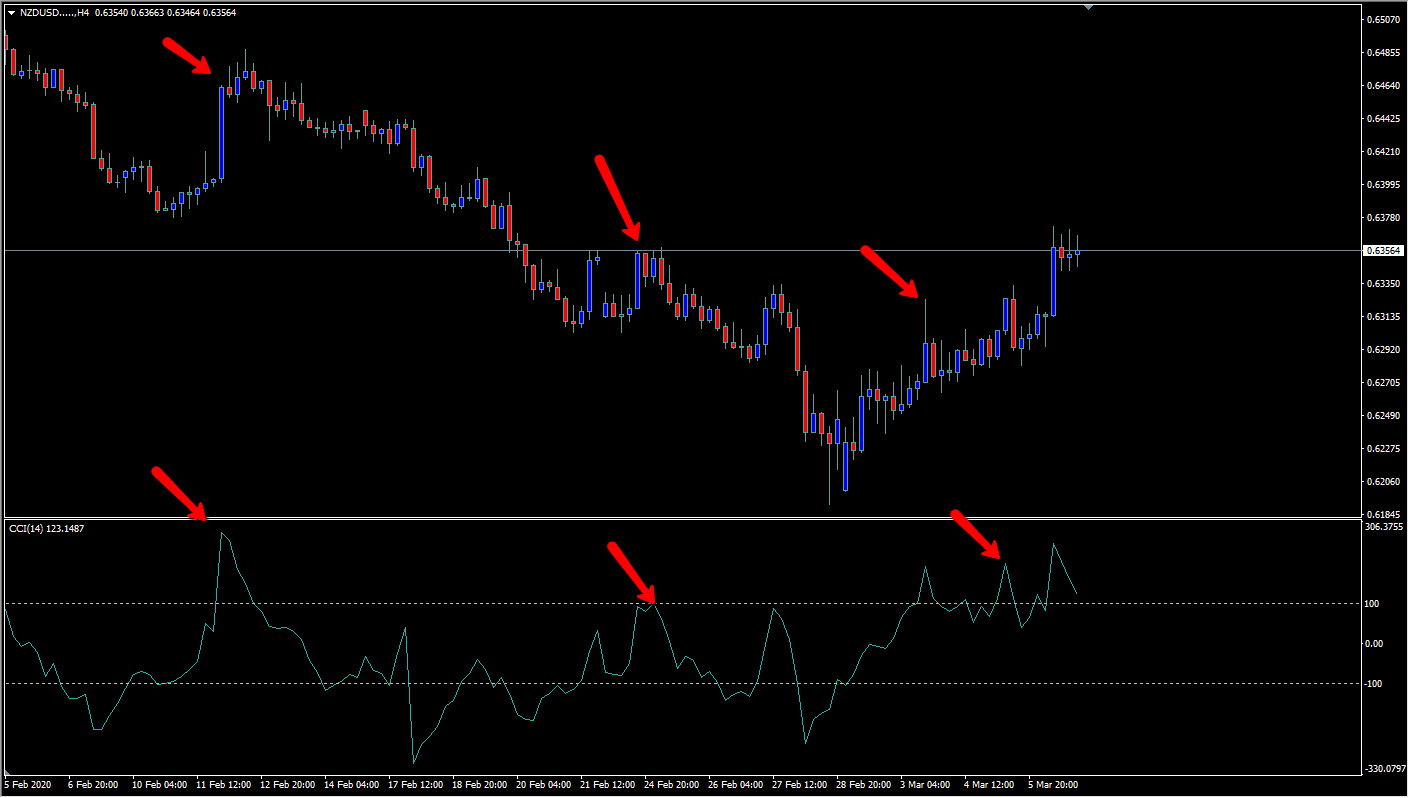
You can see that the first set of red arrows was when the CCI spiked well above the +100 level.
You can see that the market went on to drop from there as the New Zealand dollar fell from extreme highs.
The next arrows suggest an oversold condition, and therefore - in theory - a buying opportunity. However, this signal failed.
Conversely, the next two signals, the first one a sell signal and the second a buy signal, both worked out.
The very last set (not marked by an arrow) is a sell signal that has yet to play out completely. In other words, out of the first four signals, three of them were profitable.
However, no indicator is perfect, so traders use candlestick formations or perhaps moving averages to help confirm opportunities.
Any opinions, news, research, analyses, prices or other information contained on this website is provided as general market commentary and does not constitute investment advice. ThinkMarkets will not accept liability for any loss or damage including, without limitation, to any loss of profit which may arise directly or indirectly from use of or reliance on such information.