How to trade the RSI
In order to avoid trading the false signals from the RSI, it is advised to cross-check signals against other technical indicators. In the example below, we have GBP/USD trading in an aggressive downtrend, on a daily chart.
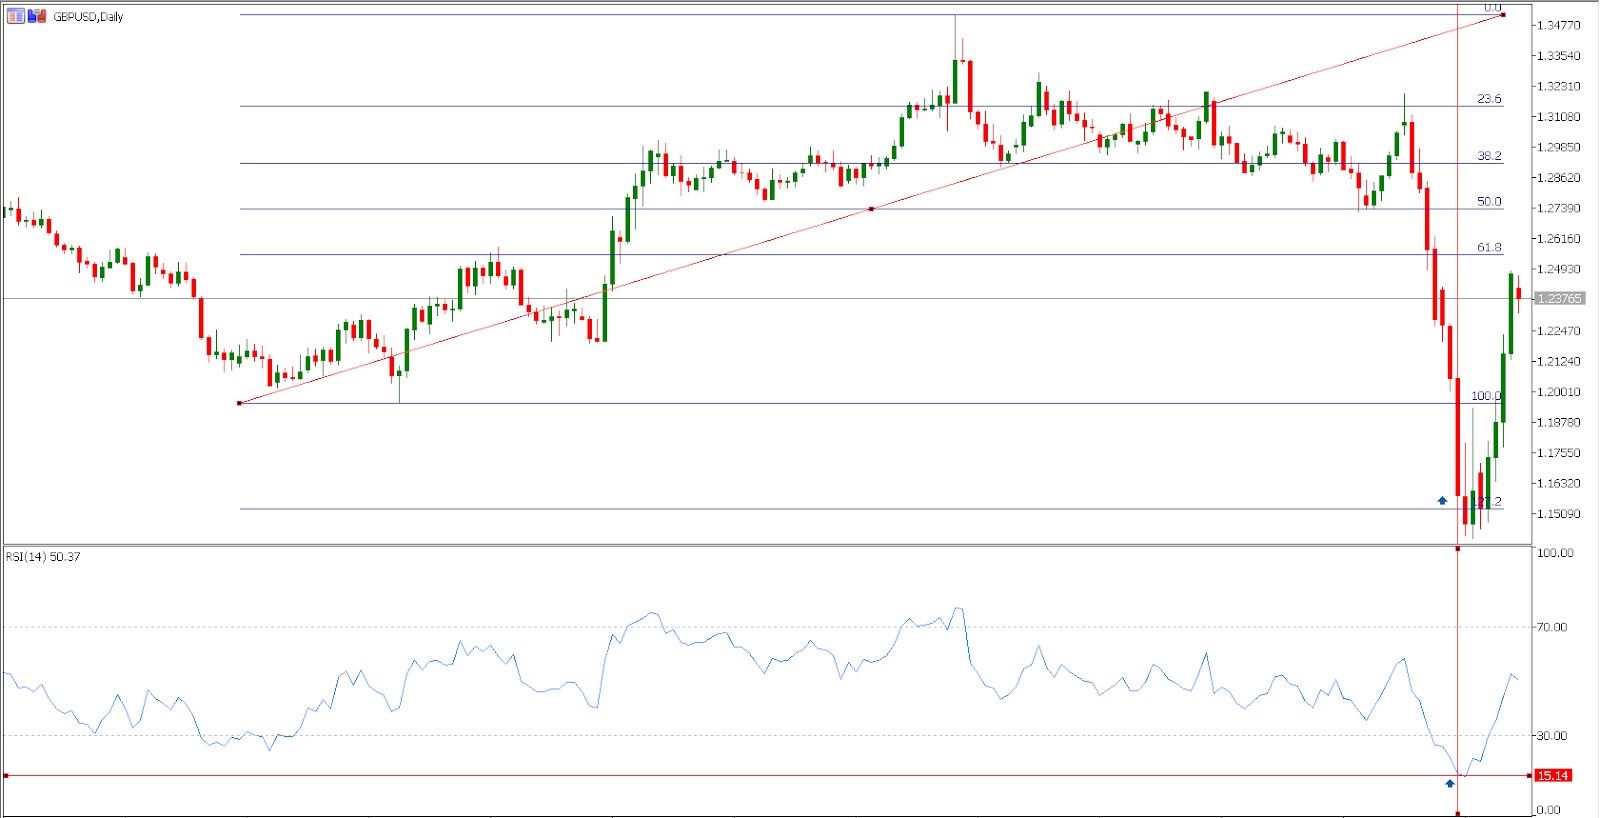
Similarly to the previous example involving EUR/USD, the RSI enters the oversold territory already in the first part of the downtrend. This happens as a result of a strong push lower as the bears completely overwhelm the bulls. As a result, readings are also decreasing in an accelerated fashion.
Our approach, in this case, is to use Fibonacci extensions to identify the 127.2% and 161.8% levels as potential support blocks. As you can see in the chart, a downtrend of around 1,800 pips stops at the first extension level.
Once we see that the bears are losing momentum, and we have a clearly identified level as a key factor for a slowdown, we check the RSI readings to get the confirmation that the market is oversold.
Given the magnitude of the move, you would expect the RSI to trade at extremely low levels. When the price action touches the 127.2% extension, the RSI trades around 15. This is not surprising given that this bearish move pushed GBP/USD towards the lowest levels since 2008.
If you go to a monthly GBP/USD chart, you will see that the last time RSI was trending around the 15 mark was in 2008. Although the RSI can always go lower until it reaches 0, a reading of 15 is quite low, especially for the higher time frames.
Hence, the RSI is best used as a confirmation indicator. You can also use other technical indicators, such as moving average, Fibonacci retracements, trend lines etc., to identify important levels and then cross-check them with the RSI readings.
In this particular case, we are trading against the 127.2% extension. A stop-loss should be placed below the extension, while a profit-taking order depends on your risk sentiment and risk/reward ratio.
Practice trading of the RSI, and other technical indicators, by opening a demo trading account. This way, you can identify trading opportunities yourself, by applying RSI and other technical indicators to better understand their co-existence, as well as to protect your capital until you feel comfortable to trade live markets.