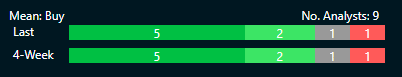
Sasol (SOL) – Annual Financial Results for the Year ended 30 June 2022
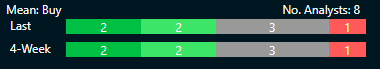
Consensus Recommendation BUY
| Highlights |
Actual |
Change |
| Turnover |
R275.7 billion |
37% |
| EBIT |
R61.4 billion |
>100% |
| HEPS |
4 758 cents |
20% |
| DPS |
1 470 cents |
>100% |
| Valuation |
Price/Earnings |
Dividend Yield |
| Sasol |
7.40x |
4.2% |
| FTSE/JSE Chemicals |
7.40x |
4.2% |
Sasol had an outstanding year driven by higher energy prices witnessed globally. The energy and chemicals group had such a strong year they were able to declare a dividend for the first time in three years. Turnover growth of 37% was largely driven by higher prices in all its markets, however, the Group did deliver lower volume production due to challenges in South African value chains, and the KZN floods in early 2022 which affected port export infrastructure. Their chemicals business in America also experienced production volume challenges. The average Rand per barrel price of brent crude oil and the average chemical sales basket price were up 68% and 39% respectively during the financial year. This resulted in earnings before interest and taxes (EBIT) growth of more than 100%. The group reported an EBIT loss of R111.9 billion only two financial years ago. What was a key area of concern in FY2020, net debt to EBITDA contracted to 0.8 times (FY2020: 4.3x, FY2021: 1.5x), as gearing improved to 41% from 61.5% improving the Group’s balance sheet strength. The oil price is expected to remain at elevated levels due to supply constraints at least well into the rest of 2022 and 2023. At a price-earnings ratio of 7.4x, Sasol isn’t too expensive compared to its own historical long-term average P/E, with an above-peer average dividend yield of 4.2%.
24 August 2022
Bid Corporation (BID) –Results for the Year Ended 30 June 2022
Consensus Recommendation STRONG BUY

| Highlights |
Actual |
Change |
| Revenue |
R147.1 billion |
28.2% |
| Gross Profit |
R35.6 billion |
29.6% |
| Trading Profit |
R7.6 billion |
58.8% |
| HEPS |
1 538 cents |
77.1% |
| DPS |
700 cents |
75% |
| Valuation |
Price/Earnings |
Dividend Yield |
| BID |
22.1x |
2.1% |
| FTSE/JSE Personal Care,Drug & Grocery Stores |
22.8x |
2.4% |
Bidcorp delivered a strong set of results for its annual financial year ended 30 June 2022 as demand for hotels, restaurants, and cafes recovered as the world came out of covid-19 related lockdowns and started socialising more. Not only did the Group deliver record profits of R4.9 billion, but many of its global operations are trading at or above pre-pandemic levels. Group revenue and profit growth were driven by strong performance in the UK, Europe, and Emerging Markets and less so by Australasia. Group gross profit and trading profit margins have also improved to pre-pandemic levels at 24.2% and 5.15% respectively from 23.9% and 4.17% in FY2021. Gross profit margin growth was achieved against a backdrop of rapid food inflation across markets, while trading profit margin growth was achieved despite rising operating expenses such as wages, energy, and fuel costs. The Group remain highly cash generative. Going forward, inflation may impact consumer demand however the Group think inflation has peaked and is seeing it taper off.
25 August 2022
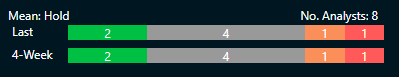
Gold Fields (GFI) – Interim Results for the Half Year ended 30 June 2022
Consensus Recommendation HOLD
| Highlights |
Actual |
Change |
| Revenue |
$2.2 billion |
12.7% |
| Normalised earnings |
$498 million |
16% |
| HEPS |
58 US cents |
28.8% |
| DPS |
300 cents |
43% |
| Valuation |
Price/Earnings |
Dividend Yield |
| Gold Fields |
8.7x |
3.8% |
| FTSE/JSE Precious Metals and Mining |
8.0x |
6.0% |
Gold Fields, one of the world’s largest gold miners reported strong results for their half-year ended 30 June 2022. Revenue increased by 12.7% to $2.2 billion from $1.983 billion on the back of higher average gold prices during the first half. The average gold price was $1891 per ounce in H12022 (FY2020: average price $1799/oz, FY2021: average price $1770/oz). Gold produced increased to 1.2 million ounces from 1.1 million ounces at H12022. Normalised earnings increased by 16%, as the miner’s all-in costs only increased by about 6% vs mining inflation of 11%. The miner became more profitable as profit margins increased by more than 300 basis points to 24%. Its balance sheet strengthened as net debt decreased to $851 million from $969 million, while net debt to EBITDA decreased to 0.33x from 0.4x at the end of the 2021 financial year. A dividend of 300 cents was supported by strong free cash flow generation to $293 million.
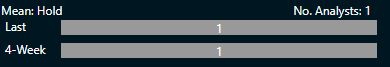
Distell (DGH) - Reviewed Group Results for the Year Ended 30 June 2022
Consensus Recommendation HOLD
| Highlights |
Actual |
Change |
| Revenue |
R12.2 billion |
11.6% |
| EBITDA |
R2.8 billion |
10.0% |
| HEPS |
718 cents |
17.4% |
| DPS |
nil |
- |
| Valuation |
Price/Earnings |
Dividend Yield |
| Distell |
16.4x |
- |
| FTSE/JSE Beverages |
19.6x |
0.5% |
Distell reported a solid set of interim results for the half year ended 30 June 2022. Revenue growth was driven by strong segmental performance in the Group’s Spirits, and Ciders & Ready to Drink (RTD) divisions. Volumes and revenues in South Africa increased by 15.4% and 22.9% respectively, while volumes and revenues increased only marginally by 6.5% and 0.9% in Africa. International volumes and revenues decreased by 9.5% and 3.8% respectively. International revenues were impacted by amongst other factors, Taiwan covid-19 related trading conditions, and export disruption following the July 2021 riots in KwaZulu Natal. Spirits revenues and volumes increased by 20.8% and 16.1% respectively, Ciders & RTDs revenues and volumes increased by 21.8% and 17.7% respectively however the Group’s wine division reported flat revenue growth and only a 2.9% increase in volumes. The Group is growing market share in beers and RTDs but is losing share in wine. Overall volumes for the Group were up 12.1%. Distell is still in a process of being bought out by the Heineken Group, which is something to keep your eye on.
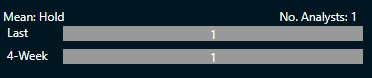
Adcock Ingram (AIP) - Audited Group Financial Results and Cash Dividend Declaration for the year ended 30 June 2022
Consensus Recommendation HOLD
| Highlights |
Actual |
Change |
| Revenue |
R8.7 billion |
12% |
| Gross Profit |
R3.1 billion |
14% |
| HEPS |
502 cents |
24% |
| DPS |
109 cents |
- |
| Valuation |
Price/Earnings |
Dividend Yield |
| Adcock Ingram |
9.9x |
4.3% |
| Aspen |
10.3x |
1.8% |
Adcock reported a solid set of full-year results for the year ended 30 June 2022. The Group produced a strong recovery in its over-the-counter and consumer healthcare products. Revenue growth was supported by strong organic volume growth of 5.8% and a mix benefit of 4.6%. Consumer healthcare products revenue and trading profit increased by 23.3% and 49% to R1.6 billion and R351 million respectively, supported by the full-year inclusion of the Epimax brand. The OTC segment revenue and trading profit increased by 18.7% and 8.8% to R2.06 billion and R318 million respectively due to a higher cold and flu season following the easing of COVID-19 restrictions. Prescription segment revenue and trading profit increased by 6.8% and 23.5% to R3.2 billion and R277 million respectively as restrictions eased and elective surgeries steadily picked up, while the Hospital segment revenue and trading profit increased by 5.9% and 1.8% to R1.88 billion and R164 million respectively. Overall, group trading profits increased by 21.6% to R1.1 billion and the trading profit margin improved by 108 basis points to 12.77%.
Sibanye Stillwater - Results for the Six Months ended 30 June 2022
Consensus Recommendation N/A
| Highlights |
Actual |
Change |
| Revenue |
R70.4 billion |
-22% |
| Headline earnings |
R11.9 billion |
-52% |
| HEPS |
423 cents |
-49.8% |
| DPS |
138 cents |
|
| Valuation |
Price/Earnings |
Dividend Yield |
| Sibanye Stillwater |
4.7x |
8.1% |
| FTSE/JSE Precious Metals & Mining |
7.5x |
6.2% |
Sibanye Stillwater had a challenging six months due to lower average PGM prices (down 19% in Rands) as the global and political sentiment deteriorated and the Group experienced disruptions to operations, a more than three-month-long strike at its South African gold operations and a severe flood at its US PGM operations. Production at their SA and US mines were down 63% and 23% respectively. The Group is cash-flush and in a strong financial position and can face the prevailing economic down-cycle, net cash is at R7.9 billion and net cash to adjusted EBITDA is at 0.2x. The Group’s second half of the year is expected to be better as operations at both its SA gold and US PGM mines have resumed.
26 August 2022
Northam Platinum (NPH) - Audited Group Annual Results for the Year ended 30 June 2022
Consensus Recommendation BUY
| Highlights |
Actual |
Change |
| Revenue |
R34.1 billion |
4.4% |
| Operating profit |
R14.9 billion |
-7.5% |
| HEPS |
2611.1 cents |
-2.9% |
| Valuation |
Price to Earnings |
Dividend Yield |
| Northam Platinum |
6.2x |
- |
| FTSE/JSE Precious Metals & Mining |
7.5x |
6.2% |
Northam’s revenue growth was driven by 12.8% growth in 4E (platinum, palladium, rhodium, and gold) volumes, a 13.4% decrease in the average 4E basket price and a 1.7% weaker average ZAR/USD exchange rate. Contraction in profit can be attributed to rising costs, community unrest and lower-than-expected growth at Northam’s Booysendal mine. Production at the mine grew by only 4.5% to 372 623 ounces (guidance of 380 000- 390 000 ounces). The unit costs per refined platinum per ounce increased by 18.9%, while sales only increased by 4.4%. Headline earnings per share (HEPS) contracted by 2.9% and earnings before interest, taxation, depreciation, and amortisation (EBITDA) decreased by 1.2% lower to R16.5bn. Net debt increased to R16 billion, following a costly expansion which includes the stake acquired in Royal Bafokeng Platinum (RBP). Production is forecast to range from 770 000 to 810 000oz in 2023 and group Capex is set to rise to R5.4 billion from R4.6 billion in 2023.
Grindrod (GND)- Unaudited Condensed Consolidated Interim Results for the Six Months Ended 30 June 2022
Consensus Recommendation N/A
| Highlights |
Actual |
Change |
| Revenue |
R3.1 billion |
31% |
| Trading profit |
R1.1 billion |
37% |
| HEPS |
2611.1 cents |
-2.9% |
| DPS |
17.2 cents |
- |
| Valuation |
Price/Earnings |
Dividend Yield |
| Grindrod |
7.4x |
3.3% |
| FTSE/JSE Industrial Transportation |
6.3x |
1.9% |
Grindrod’s core operations performed well for the six months ended 30 June 2022. The Group’s Port and Terminal division delivered earnings growth of 164% due to larger volumes handled. Maputo port volumes increased by 30% to 12.3 million tonnes year-on-year, while dry bulk terminals increased volumes handled by 52% despite challenges such as troublesome weather, frequent power outages, fire-damaged conveyor belt infrastructure in Richards Bay and a loss of vessel loading days. The Group’s coastal shipping and container depot segment performed well with earnings growth of 88%. The Banking division benefited from higher interest rates, reporting strong growth of 63% in earnings. The Group is in the process of selling its banking assets to African Bank.
Any opinions, news, research, analyses, prices or other information contained on this website is provided as general market commentary and does not constitute investment advice. ThinkMarkets will not accept liability for any loss or damage including, without limitation, to any loss of profit which may arise directly or indirectly from use of or reliance on such information.

Learn and earn more today.
Visit our Education Centre