Global Macro
Global Food Crisis Looming
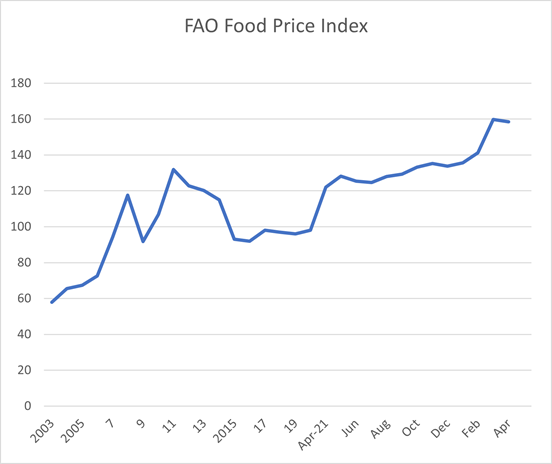
Long before Russia invaded Ukraine, food prices had begun rising almost exponentially, thanks to the impact of climate change, exacerbated by the Sars-CoV-2 pandemic. According to the Food & Agricultural Organisation (FAO) of the United Nations the FAO Food Price Index averaged 158.5 points in April 2022, down 1.2 points (0.8 percent) from the all-time high reached in March, though still 36.4 points (29.8 percent) above its value in the corresponding month in 2021. The drop in the index in April was led by a significant downturn in the vegetable oil sub-index, along with a slight decline in the cereal price sub-index. Meanwhile, sugar, meat and dairy price sub-indices sustained moderate increases.
This is bad enough and we are all feeling the effects of higher food prices at the supermarket tills. And while this situation is likely to get a lot worse before it gets better, spare a thought for those unfortunate souls at the bottom of the socio-economic ladder. Widespread global famine is about to become a reality for the first time in living memory.
Russia and Ukraine between them supply almost 30% of globally traded wheat and barley, 15% of the maize and 75% of the sunflower oil. And for poor countries, the situation is even more acute. Russia and Ukraine supply around half of the cereals imported by Lebanon and Tunisia, while for Libya and Egypt the figure is nearer two-thirds. Ukraine’s food exports provide the calories to feed 400 million people. The war is disrupting these supply chains because Ukraine has mined its waters to deter an assault, while Russia has blockaded the port of Odessa on the Black Sea coast.
It’s a well-known economic fact that poorer households spend a disproportionately larger amount on food than on virtually any other economic necessity. And the same goes for countries-poorer countries spend more as a proportion of their GDP on food then wealthier countries. According to The Economist, “households in emerging economies spend 25% of their budgets on food—and in sub-Saharan Africa as much as 40%. In Egypt bread provides 30% of all calories. In many importing countries, governments cannot afford subsidies to increase the help to the poor, especially if they also import energy—another market in turmoil.”
And time is running out. There is only a small window of opportunity to get stockpiled Ukrainian barley and corn out into global food markets before the next harvest in Ukraine begins in late June. If those stockpiled grains can’t get exported, the new harvest may rot in the fields. Because of sanctions from the European Union, Russia may not be able to source seeds and pesticides for the next harvest.
While the longer term outlook could be especially grim if neither Ukraine nor Russia manage to achieve a decent harvest this year, the short term situation could improve rapidly with goodwill on all sides. For that to happen, Ukraine needs to de-mine its waters around Odessa, Russia needs to end the naval blockade of Ukrainian shipping in the Black Sea and Turkey needs to allow ships to pass unhindered out through the Bosphorous into the Sea of Marmara. When the conflict began, Turkey imposed a ban on all military shipping through the Bosphorous.
Interestingly, it appears as though at least one Russian ship has been ferrying clandestine supplies of grain to Syria via the Bosphorous. According to the Kyiv Independent and CNN, the Matros Pozynich has made at least two trips to the Syrian port of Latakia, offloading allegedly stolen Ukrainian grain in the past month.
Local Macro
The local Eskom situation became markedly worse last week, as the electricity utility invoked a further round of rotational power cuts, known colloquially in Eskom-speak as “loadshedding.” According to City Press, Eskom has already exceeded its worst-case scenario for load shedding in South Africa, with warnings that worse is still to come.
At the group’s quarterly media briefing in March, Eskom presented three scenarios for the 365 days between 1 April 2022 and 31 March 2023. These were;
A base-case scenario of 10 000 Megawatts (MW) to 12 000MW of generating capacity being unavailable
A second scenario of 12 000MW to 13 500MW being unavailable and
The worst-case scenario of 13 500MW to 15 000MW being unavailable.
In the worst-case scenario presented by the utility, South Africa would experience 295 days of load shedding over the period. In other words, in a worst-case scenario, only 70 days out of 365 would be free of loadshedding. Having exceeded the worst-case scenario already after less than two months, the outlook is incredibly worrying.
But over the weekend, it also became a lot clearer what a couple of pivotal factors in this situation may be-sabotage on an industrial scale coupled with broken plant that may never be fixed. According to Moneyweb, three power stations-Kendal, Duvha and Tutuka-accounted for almost half of the unplanned breakdown in the Eskom fleet in the year to March 2022. Collectively, these three plants cost the utility just over 5 000MW in lost output. Tutuka was by far the worst station, with only two of its six generators working at any given point in time. This is a well-known trouble spot and Eskom has been having to contend with well-documented acts of sabotage there for some time now.
Duvha and Kendal are just broken. Duvha is in a particularly parlous position, as it permanently lost 575MW of output in a catastrophic explosion in 2014 that took out its unit 3. Unit 2 was due to be returned to service earlier this month after a six-month delay but that has not yet happened.
If even half of the lost capacity at these three units could be restored permanently, it would result in at worst a vast improvement in loadshedding and at best it could even be eradicated.
Eskom is a mission-critical state-owned enterprise. Unless and until far greater amounts of electricity can be generated from renewables and elsewhere in the private sector, Eskom needs to come right and quickly. The longer this type of acute load-shedding continues, the more likely it is that the South African economy will be straightjacketed into extremely poor GDP growth.
Highlighted Share
Afrimat
Afrimat’s full year results to end February came out recently and were very strong, as expected. Afrimat is a mid-tier open-cast mining stock that has been classified as a construction stock since it listed on the JSE. It is highly diversified, its main profit contributors being Iron ore, construction materials and industrial minerals. Over the years, it has diversified its income base and as a result has stayed well ahead of the pack in the construction space.
On a 26.7% rise in revenue to R4.7 billion, headline earnings per share (HEPS) increased by 22.9% to 542.9c and the total dividend was increased by 25.7% to 186 cents per share. Gearing is a relatively low 12%.
Although the iron ore price has declined sharply from the record levels of eighteen months ago, the moving average price that Afrimat receives is still rising.
The group remains on the lookout for further acquisitions, notably in the area of rare earth minerals which are used in renewable energy wind turbines. Additionally, their investment in the Nkomati anthracite mine should begin paying off handsomely in the current financial year and beyond.
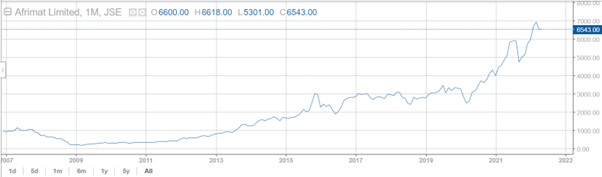
The Afrimat share price has more than doubled in the past five years, in line with the strong compound growth in earnings and dividends. While that type of growth in future appears unlikely, it should nevertheless be strong and ahead of the market generally.
 Gainers & Decliners
Gainers (%)
MHB 11.96
REB 10.53
ADR 8.89
RFG 8.36
CHP 8.33
AEE 7.69
SSK 7.55
LUX 7.31
TEX 5.56
QFH 5.54
Decliners (%)
ADW -28.13
GFI -19.79
MMP -10.52
FFB -6.75
HAR -5.33
BRT -4.86
SHFF -4.84
ASC -4.05
OMN -3.86
CFRO -3.53
Any opinions, news, research, analyses, prices or other information contained on this website is provided as general market commentary and does not constitute investment advice. ThinkMarkets will not accept liability for any loss or damage including, without limitation, to any loss of profit which may arise directly or indirectly from use of or reliance on such information.