 Download Carl's Bear Market Survival Guide e-Book:
https://www.thinkmarkets.com/au/lp/2023-bear-market-survival-guide-ebook/
Download Carl's Bear Market Survival Guide e-Book:
https://www.thinkmarkets.com/au/lp/2023-bear-market-survival-guide-ebook/
Local Macro
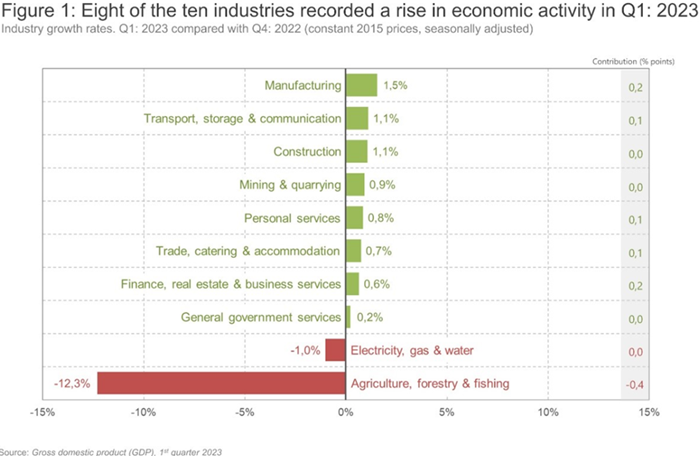
According to Statistics SA, after contracting by a revised 1.1% in the fourth quarter of 2022, real gross domestic product (GDP) edged higher in the first quarter of 2023 (January‒March), expanding by an estimated 0.4%. The manufacturing and finance industries were the major drivers of growth on the supply side of the economy. The demand side was lifted by exports, with smaller positive contributions for household, government, and investment spending.
Manufacturing and finance were the main drivers of growth. Eight of the ten industries recorded growth in the first three months of the year (Figure 1), with manufacturing and finance, real estate & business services the largest positive contributors. Manufacturing output increased by 1.5%, adding 0.2 of a percentage point to GDP growth. The production of food and beverages was the main catalyst behind the industry’s positive showing.
Amid all the gloom and doom currently pervading the South African economy, a little ray of hope has materialised with the recognition that total power generated by the private sector in 2025 will roughly equate to Eskom’s current, though erratic output. By 2025 it is estimated that the private sector in aggregate will produce 25Gw of power; add that into the 25Gw that Eskom manages to produce on a good day and loadshedding disappears. Ah, were but life that simple. The private sector power will mainly be coming from renewables-wind and solar-and unfortunately the places where these sources are generated are invariably far from transmission lines. So although it will be possible to produce and extra 25Gw of electricity on a good day in SA by 2025 from the private sector, much of that may not be able to be harvested until a few years down the track. An additional complicating factor is the intermittent nature of renewable energy; there is sometimes extensive cloud cover and often the wind doesn’t blow sufficiently strongly to turn the turbines at the optimal potential.
To account for this intermittent nature of renewables, mots energy experts onlyuse 25% of stated capacity to arrive at a realistic figure that can be relied upon all year round. Allying that percentage to the 25Gw results in an extra 6.25Gw of reliable extra energy by 2025, provided the transmission lines can cope. This would be a useful addition to Eskom’s current capacity and would come close to stopping loadshedding altogether.
Global real bond yields. As can be seen from the accompanying graph, South Africa has one of the highest real bond yields in the world. In an attempt to contain inflation, the SARB’s monetary Policy Committee is keeping interest rates high so that high yield-seeking foreigners especially will buy SA bonds. In a later chart, we show that, even with very high real yields, the number of foreign holders of SA 10 year bonds is dwindling.
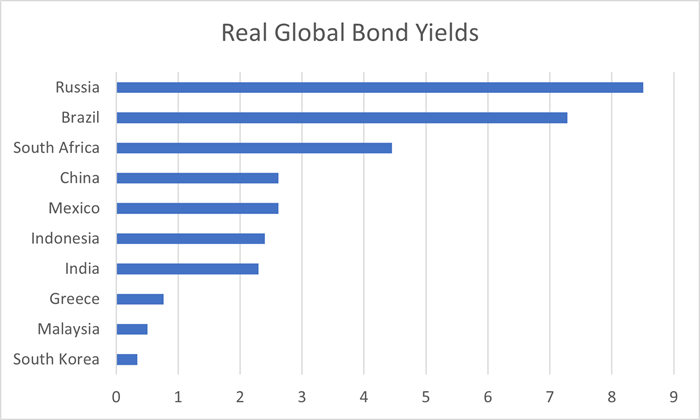 Source:Trading Economics, Gilmour Research
The SA Reserve Bank recently published its Financial Stability Review (FSR), which contained some hard-hitting references to the possible consequences of western nations not believing South Africa’s non-aligned positioning. “Since the release of the November 2022 FSR, two new risks have been added to the Risk Value Matrix (RVM), namely (i) capital outflows and declining market depth and liquidity; and (ii) secondary sanctions amid heightened geopolitical polarisation. The risk of secondary or indirect sanctions being imposed on South Africa if it(FSR)s neutral stance on the Russia-Ukraine war is perceived as unconvincing has increased since the previous FSR, prompting the inclusion of this risk on the SARB RVM. Should this risk materialise, the South African financial system will not be able to function if it is not able to make international payments in USD and it could lead to a sudden stop to capital inflows and increased outflows. In turn, this could further exacerbate declining domestic financial market depth and liquidity, and further erode investor confidence and sentiment if considered alongside the FATF greylisting and the country’s inability to arrest the growing prevalence of load-shedding. There is also a risk that South African financial institutions may be subjected to more intensive scrutiny by foreign counterparts, even in the absence of formal secondary sanctions.”
Lesetja Kganyago, the SARB governor, is widely recognised as one of the foremost central bank governors globally. When he talks, people really should listen. But unfortunately, his sage words may go unheeded by government in the same way that they sleep-walked into the FATF greylisting back in February. They had a long lead time in which to get their financial house in order to avoid greylisting but chose not to.
A more likely scenario is one in which western institutions gradually reduce their exposure to SA with portfolio flows (the only real foreign direct investment) largely drying up. If sanctions are applied, regulated funds in the US, EU and UK would be prohibited from investing in South African bonds and equities. Likewise, SA institutions would likely be prevented from investing offshore and would be directed to investing purely in the local capital markets.
Prescribed assets would return, whereby SA institutions would be required to invest a certain percentage of their investments into local bonds. There has been a lot of talk about re-introducing prescribed asses over the past few years but nothing has materialised. The application of sanctions, however, might just trigger a move into prescribeds.
If prescribed asset requirements came back, the local capital markets-both bonds and equities-would eventually strengthen in rand terms, as a hot-house environment would materialise where only inward investment was allowed. A few foreign investors would remain, but they would be either large private individuals or unregulated hedge funds.
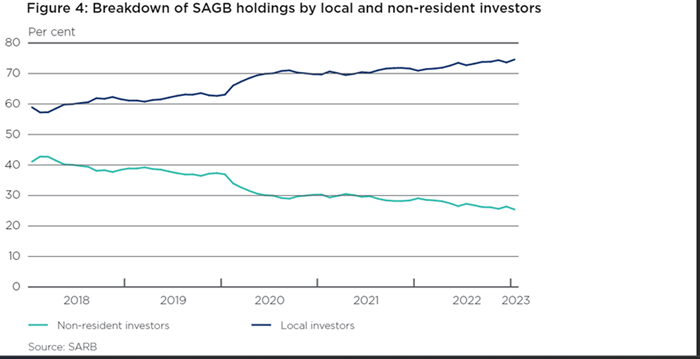
Already, the number of non-resident holders of SA Government bonds has fallen considerably;
Global Macro
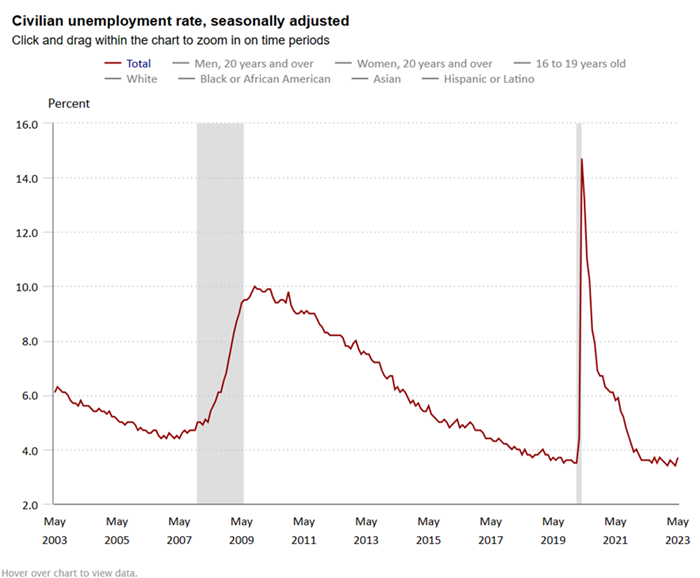
The US consumer economy continued to power ahead in May, confounding sceptics and probably doing enough to warrant the US Federal Reserve (the Fed) going for a pause at its next FOMC meeting. Total nonfarm payroll numbers were 339,000 against a consensus of approximately 190,000. The US Fed Funds rate is now 5 to 5.25% while the rate of inflation is 4.98%. Thus with the Fed Funds rate being higher than inflation, the Fed cane afford to pause hiking for a month or so. But it may yet be necessary to hike again before the year is out. This is line with the basic thesis that interest rates are destined to stay higher for longer.
At a manufacturing level, the picture isn’t so rosy. The ISM Manufacturing Index contracted again in May to 46.9% from 47.1% in April. This is the seventh month of contraction and a continuation of the downwards trend that began in June 2022.
In China, the two main manufacturing indexes diverged, with the Caixin manufacturing PMI rising above 50 and going into expansion territory while the NBS manufacturing PMI contracted to 48.8 from 49.2 in May. However, the non-manufacturing indexes remain in expansion territory, with the Caixin headline services PMI moving up to 57.1 in May from 56.4 in April. The NBS non-manufacturing PIM fell back to 54.5 in May but still remained in expansion mode.
Inflation is falling rapidly in the EU, even after stripping out food and energy, the two big factors in recent months. Eurozone CPI inflation fell to 6.1% in May from 7% in April. Notwithstanding this good news, European Central Bank (ECB) president Christine Lagarde believe that further interest rate hikes will be necessary.
The Nikkei 225 index in Japan has risen by 26.5% since the start of 2023 and is now not too far away from its all-time high of 38 957.44 established in December 1989. The main reasons for this renewed interest in Japan are structural reforms taking place in the country coupled with the low price to book valuations of stock on the index.
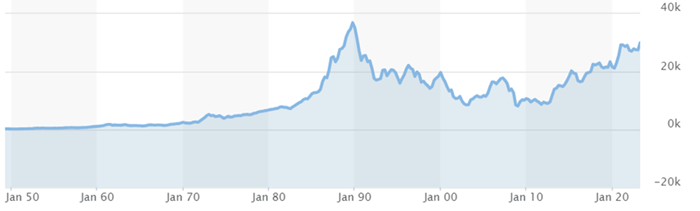 NIKKEI 225 Historical Chart Source: MarketWatch
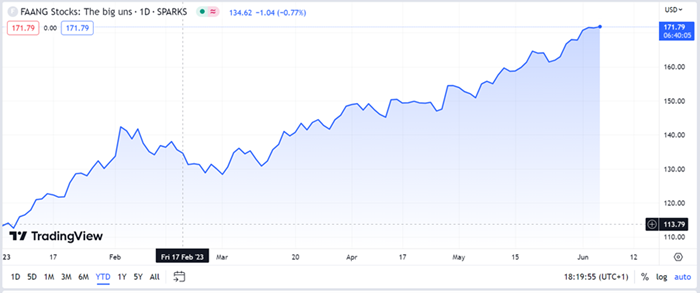
In the US, the FAANG stocks (basically the tech stocks) have done remarkably well, rising over 50% year to date. Having risen so far, so fast, the question now arises, is it time to take some profits and rotate into something else?
Featured Stock: Lewis Group
Lewis Group is an old-established furniture and appliance chain headquartered in Salt River in Cape Town. Founded by Meyer Lewis in 1934, it was acquired by Great Universal Stores (GUS) of the UK in 1947 and was delisted from the JSE. It was re-listed in 2004 and today is the only JSE-listed furniture retailer. The same Lewis family used to control The Foschini Group as well.
For the year to 31 March 2023, total revenue grew by 3.1%, with merchandise sales growing by 1.4% to R4.4 billion. Gross profit margin was almost static at 40.6% but operating profit before impairments was 8.3% lower at R703 million. The slower trading in subsidiary UFO resulted in an impairment of R91.1 million being recognised against its goodwill. An impairment of R22.9 million was recognised against the group’s right-of-use assets. Operating profit after impairments dropped from 15.2% to 13.5% and attributable earnings declined by 15.7% to R407 million. Headline earnings per share (HEPS) rose by 1% to 857c, aided by the group’s aggressive share buyback scheme. The value of shares repurchased last year was R5.5 million; the cumulative value of shares repurchased in the past five years is R31.6 million. Since Lewis was re-listed in 2004, 42% of shares in issue have been repurchased. The total dividend was maintained at 413c/share. The group has never missed paying a dividend since listing.
Credit sales grew by 18.1% while cash sales declined by 16%. This reflects the difficulties that consumers currently have in paying for large discretionary purchases with cash.
Segmentally, traditional brands increased sales by 3.5%, while UFO’s sales slumped by 12.5%. UFO is a cash-only retailer and bore the brunt of lower cash spending by customers. Additionally, 65% of UFO’s merchandise is imported and the weak rand impacted merchandise negatively. UFO made an operating loss of R123.8 million, while the traditional businesses made an operating profit of R724.4 million.
Lewis is an exceptionally tightly-managed and well-run business, as can be seen by the hgh rate of collection s and the healthy state of its debtor’s book. Nevertheless, the current financial year is going to be extremely tough and it’s difficult to see how the group will be able to maintain earnings against such a difficult ambient economy. At a share price of 3990c, the historic PE ratio is 4.7x and the dividend yield is 10.4%. This seems too good to be true and suggests the share price may be vulnerable. However, this share needs to be watched very carefully; if Lewis can maintain or improve earnings and dividends, which at this point appears unlikely, then the current rating is very cheap.
 click on image to enlarge
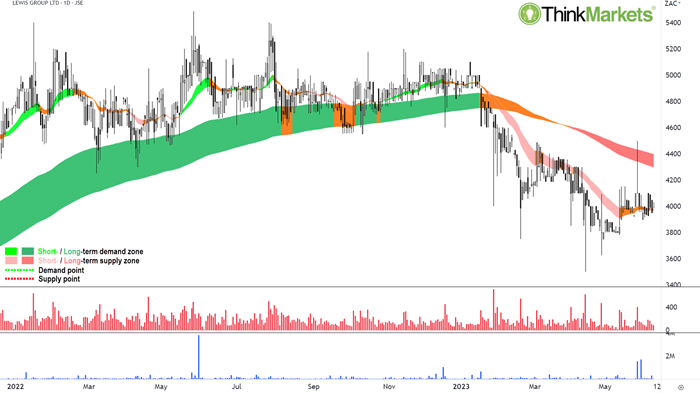
The Lewis chart shows its price is in a neutral short-term trend (orange trend ribbon) and a long-term downtrend (dark pink trend ribbon). On balance, these ribbons demonstrate investors are providing greater supply of Lewis shares into the market than they are demanding.
The long term-trend ribbon is impeding price appreciation around 4400 and this is causing compression in the price action (i.e., peaks and troughs) between 3900-4200. If the price can continue higher through 4200 again, it will confirm 13 April's 3500 low as a major swing low and would likely confirm a new short-term uptrend.
Investors are likely best served by waiting for such a move, preferably on a meaningful increase in volume to confirm supply removal between 4200-4400, before adding new positions to Lewis.
Learn More, Earn More!
Want your portfolio questions answered? Register for next week's Live Market Analysis sessions and attend live! You can ask me about any stock, index, commodity, forex pair, or cryptocurrency you're interested in.
REGISTER:
Live Market Analysis Webinars - Thursdays 1pm AEST / Wednesdays 3am GMT, Friday 12pm AEST / Thursdays 2am GMT
You can catch the replay of the last episode of Live Market Analysis here:
Best artificial intelligence stocks to buy right now NVDA, AMD, MRVL