Local Macro
The May Day public holiday meant a long weekend for most South Africans, resulting in a 4-day week last week. First quarter GDP figures will be released on Friday May 12, but all the signs so far indicate that SA may just have avoided a technical recession in Q1 of this year, albeit by a slim margin. It’s all relative, but the amount of loadshedding in March may have been slightly less than that experienced in February and thus a slight improvement in economic activity in the last month of the first quarter can be expected.
Having said this, a sobering statistic is that by 9 May, the amount of electricity that was shed by Eskom in 2023 year to date surpassed that for the whole of 2022. Clearly this situation is totally untenable and South African industrial companies and the mines are buckling under the pressure of using vast quantities of diesel just to get their operations going.
A growing consensus appears to believe that the private sector will create substantially more electrical power in 2024 and beyond, which should provide some welcome relief to the economy but until then, it’s going to be exceptionally tough, with stage 8 loadshedding likely to occur in the high demand months of June and July.
A number of commentators are talking about the possibility, however remote, of a total grid collapse in South Africa. It should be stated at the outset that, provided Eskom’s grid controllers do their jobs properly, this remains a very remote threat. However, the grid is now so decrepit that it might not take much to push it beyond the capabilities of these controllers and thus foment a total grid collapse.
Grid collapses have occurred in a number of countries around the world but none of these countries has a grid that is as integrated as SA’s In other words, these countries tend to operate on a a regional basis, with different grids in each region, so that if one grid goes down, the entire country doesn’t necessarily go down. Bringing power back up in these circumstances is relatively straightforward.
But in SA’s case, a grid collapse would affect the entire country and it would take at least two weeks to fully restore it, if not longer. A so-called “black start” might be possible provided large pumped storage facilities such as Ingula had a full reservoir at the time of the collapse. That’s because Ingula and other pumped storage plants can generate immediate power literally at the flick of a switch by allowing water to pass though their turbines. But Eskom has been running all of its plants flat out for the past couple of years, including its pumped storage facilities, so there’s no guarantees that their reservoirs will be full in the event of a major trip and ensuing collapse.
The impact of a total grid collapse is difficult to quantify but it’s safe to assume that the economy would literally grind to a complete halt. Apart from no electrical power for the mines, industry and residential areas for two weeks, water wouldn’t be pumped and neither would sewage. Neither would fuel at petrol stations be pumped. Telecommunications would cease as the lack of electrical power manifested itself. The internet would close down. Basically, modern life would cease to exist for two weeks. Crime would likely rise exponentially and martial law would have to be invoked in an attempt to retain law and order. It’s a really ugly scenario but one that may be close to the mark.
Global Macro
The US Federal Reserve (The Fed) increased its Fed Funds rate by 25 basis points last week, the third consecutive hike of such a magnitude. There were indications in the Fed’s accompanying narrative to the effect that this is a pause in the rate hiking cycle may be close. The Fed is obviously paying attention to the poorer than anticipated GDP growth figures coming out of the US, with Q1 GDP growth cooling to 0.3% in the first quarter from 2.6% in Q4 2022. Consumer spending, however, remains buoyant.
Eurozone consumer price inflation remains uncomfortably high at 7% and although the European Central Bank (ECB) only hiked rates by 25 basis points last month, there is no sign that this is the end of the hiking cycle.
Chinese manufacturing activity surprised to the downside in April thanks to weaker than expected consumer demand. The official NBS manufacturing PMI fell to 49.2 in April, where anything above 50 suggests expansion and below 50 contraction. This is he first contraction in China since Zer-Covid restrictions were lifted a few months ago. However, services in China remain stromg, with the services PMI still in expansionary mode.
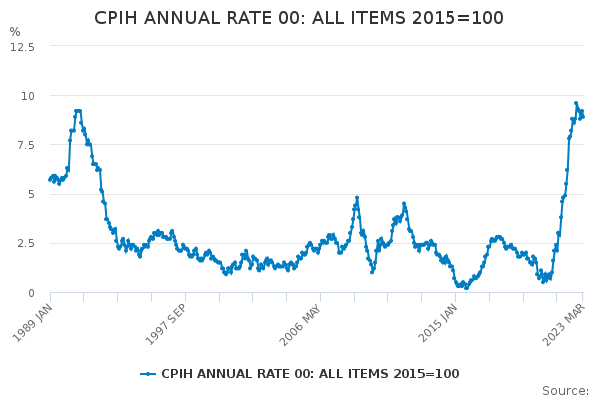
In the UK, consumer price inflation remains sticky around 10% year on year but sentiment towards the currency is changing for the better. The pound is forecast to reach 1.30 versus the USD later this year as the Bank of England keeps interest rates high to contain inflation.
 click to enlarge image
Featured Stock
Pick n Pay released its FY 2023 results on 4 May and although they had been widely telegraphed beforehand, they still came as a shock. Turnover rose by 8.9% to r106.6 billion in he year to end February 2023, while the pro-forma trading margin declined by 40 basis points, from 3.1% to 2.7%, due mainly to the impact of sustained loadshedding. Pro-forma pre-tax profit fell by 15.1% to R1 678.4 million and pr-forma HEPS declined by 16.3% to 242.37c. The total dividend for the year declined by 16.3% to 185.15cper share.
The only really bright spot in these results was the sparkling turnover growth at low-end chain Boxer, which saw sales growing by 20.2%. Boxer now accounts for 30.5% of the group’s SA sales and is growing rapidly. Boxer management intends doubling the size of its store base by 2026.
Taking into account the capital investment requirements of the Ekuseni Plan and the uncertainties brought about by the unprecedented levels of load shedding, the dividend policy has been amended from FY24. In future, the Group will change from its 1.3x cover (76% pay-out ratio) to a range of between 1.5x (67% pay-out) and 1.8x (56% pay-out).
Like its arch-rival Shoprite, Pick n Pay spent a huge amount of money (R522 millon) on diesel for its generators last year. Clearly this level of expenditure is not sustainable into the future and something has to give. Considering that loadshedding at its current intensity is likely to remain a feature of the SA economy for the foreseeable future, the only option that food retailers like Pick n Pay have is to cut costs even further.
 click to enlarge image
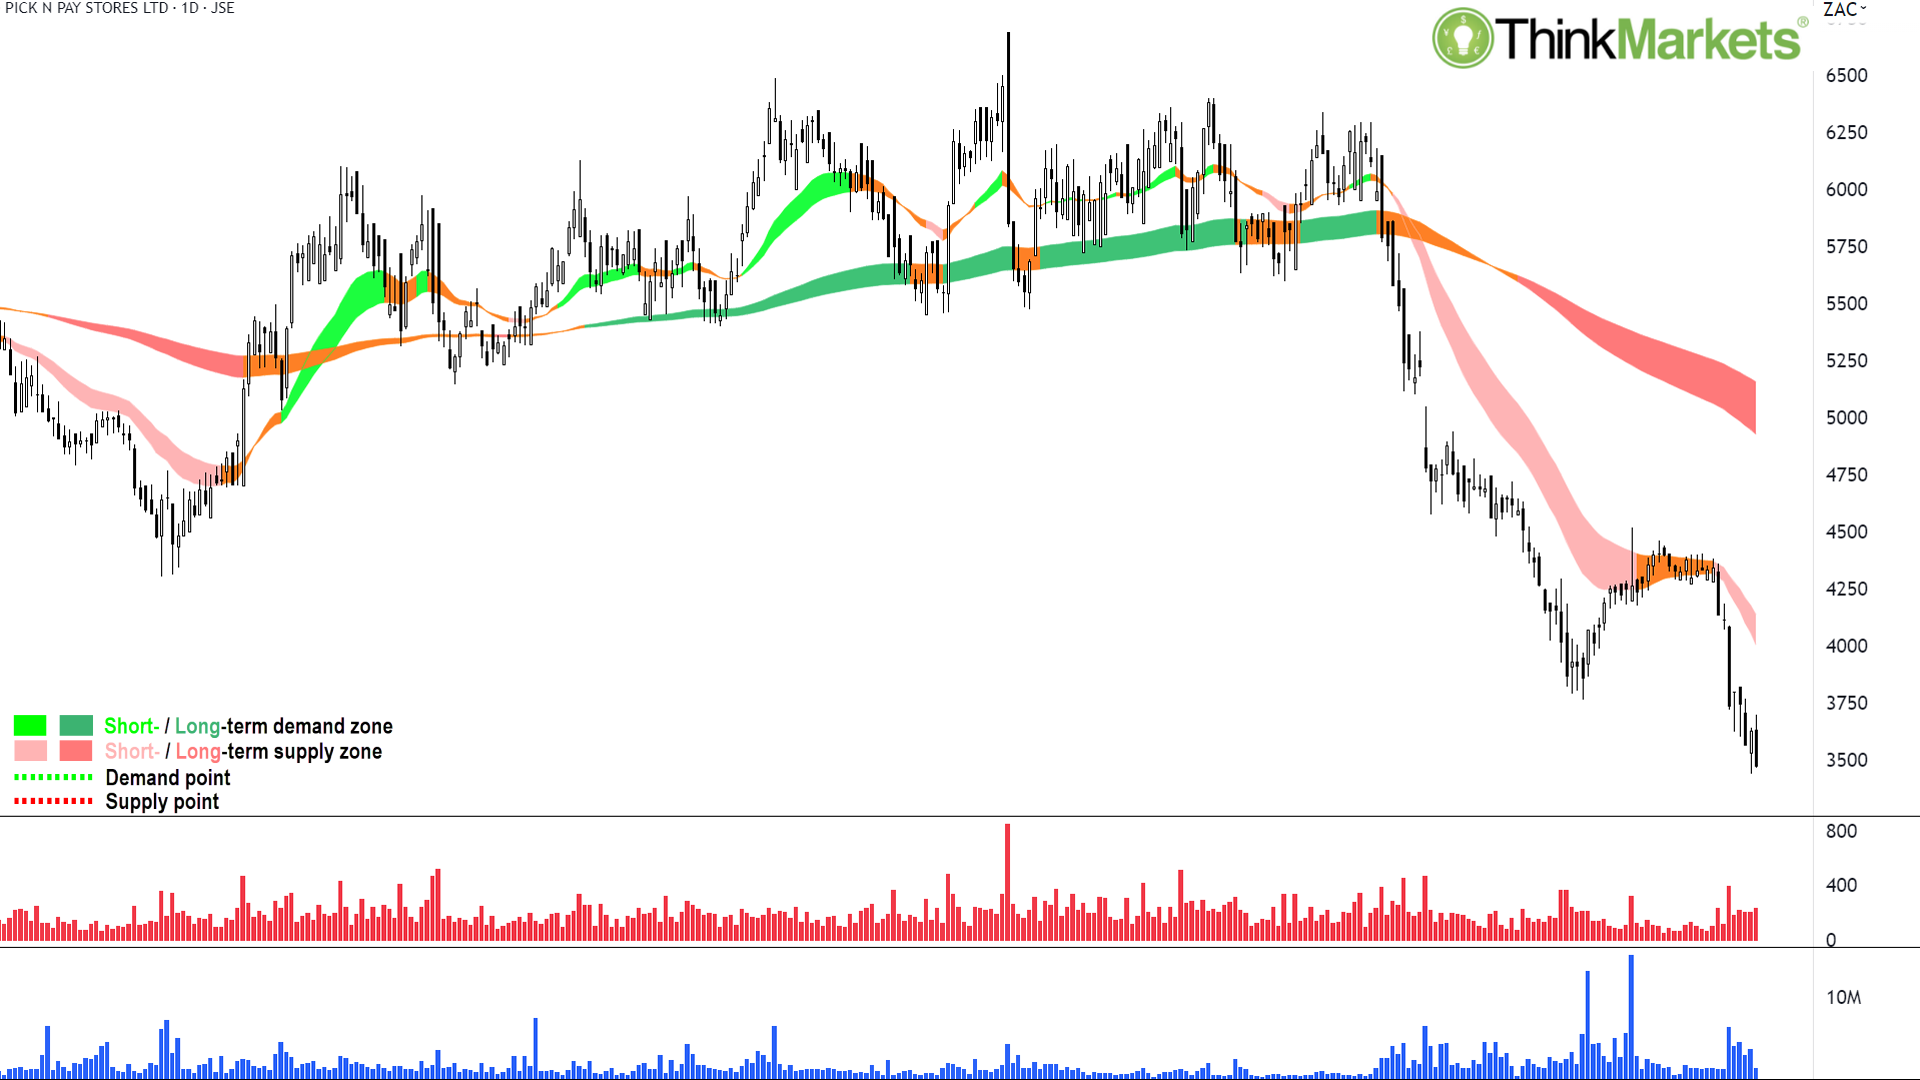
The Pick n Pay chart is in a well-defined short-term downtrend (light pink trend ribbon) and a well-defined long-term downtrend (dark green trend ribbon). Both trends appear to be accelerating to the downside as supply is clearly in excess of demand.
Other bearish factors include a break-down of the key demand point at 3764 (23 March low), and since this break, numerous black candles indicating the supply-side remains dominant. The 11 May candle in particular, with its convincing reversal of the prior 10 May demand candle indicates further price declines are likely.
Volume and volatility have increased, but have not yet spiked in correspondence with a substantial demand-side candle (i.e., long white body and/or long lower shadow) which is typical of a blow-off low. Shorts are preferred over longs until such a supply capitulation occurs.
A logical target for any potential downside move is 2500 based upon the weekly chart (not shown).

Learn More, Earn More!
Want your portfolio questions answered? Register for next week's Live Market Analysis sessions and attend live! You can ask me about any stock, index, commodity, forex pair, or cryptocurrency you're interested in.
REGISTER:
Live Market Analysis Webinars - Thursdays 1pm AEST / Wednesdays 3am GMT, Friday 12pm AEST / Thursdays 2am GMT
You can catch the replay of the last episode of Live Market Analysis here:
Lithium rebound continues as copper, base metals crumble
Any opinions, news, research, analyses, prices or other information contained on this website is provided as general market commentary and does not constitute investment advice. ThinkMarkets will not accept liability for any loss or damage including, without limitation, to any loss of profit which may arise directly or indirectly from use of or reliance on such information.

Learn and earn more today.
Visit our Education Centre