13 September 2022
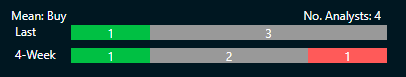
Libstar (LBR) - Reviewed Interim Results for the Six-Month Period Ended 30 June 2022
Consensus Recommendation BUY
| Highlights |
Actual |
Change |
| Revenue |
R5.2 billion |
9.6% |
| Normalised EBITDA |
R493 million |
4.6% |
| Normalised HEPS |
35.6 cents |
14.1% |
| DPS |
nil |
- |
| Valuation |
Price to Earnings |
Dividend Yield |
| Libstar |
8.6x |
4.2% |
| FTSE/JSE Food Producers |
13.0x |
5.6% |
Food and private label food producer, Libstar, delivered a resilient performance for the first six months of the new financial year. Total Group revenue growth was driven by strong revenue growth in its Retail & Wholesale (+8.1%), Food Service (+23.9%) and Industrial & Contract Manufacturing (+18.3%) divisions while slightly offset by revenue contraction of 10.9% in the Export division which was negatively impacted by supply chain issues and a volatile Rand. Revenue and normalised EBITDA for its Perishables category (54% of Group revenue) expanded by 14.6% and 28% respectively to R2.8 billion and R254 million, delivering volume growth of 6.3% driven by strong volume sales growth of pre-packed hard cheese. Revenue for its Groceries category (32%) expanded marginally by 2.2% to R1.7 billion delivering volume growth of 8.3% driven by strong volume growth of its sauces, vinegars, and other condiments, while normalised EBITDA contracted by 17.7% to R196 million. Revenue and normalised EBITDA for its Snacks & Confectionery category (5%) increased by 11.6% and 23.2% respectively, while revenue and normalised EBITDA for its Baking & Baking Aids category (9%) increased by 8.6% and -6.1% respectively. In line with company policy, no interim dividend was declared. Libstar is currently trading at a 34% discount to its peers from a price-earnings perspective.
African Rainbow Capital Investments (AIL) - Full year financial results for the twelve-month period to 30 June 2022
Consensus Recommendation N/A
| Highlights |
Actual |
Change |
| Portfolio Value |
R13.7 billion |
11.3% |
| INAV Per Share |
R10.06 |
14.7% |
| DPS |
nil |
- |
| Valuation |
Price to Earnings |
Dividend Yield |
| ARC Investments |
5.9x |
- |
| FTSE/JSE Closed End Investments |
6x |
- |
The investment holding company delivered strong performances in its underlying holdings as the intrinsic portfolio and cash in the ARC Fund, its only asset, increased by 11.3% and 179.9% respectively. The ARC Fund is invested in 52 companies spanning telecommunications, mining, construction, agriculture, financial services, and other sectors with its top 4 investments being in Rain Telecommunications, Tymebank, Kropz Group and Alexander Forbes. The Fund’s interest in Rain increased by 9.7% to R3.6 billion, as the company benefited from acquired spectrum and is doing well on the sale of its 4G and 5G products. Tymebank now has 5 million customers, 36 months after launching. It also raised $150 million during the year. One of the Fund’s mining interests, Kropz Group’s fund value increased by 7.5% to R1.03 billion. Alexander Forbes’s fund value increased by 7.1% to R963 million following a R121 investment and a fair value gain of R75 million due to the increased share price. The company announced that until it makes substantial exits, it won’t be declaring dividends. The share currently trades at a 40% discount to its intrinsic NAV per share. ARC is currently trading at a 2% discount to its peers from a price-earnings perspective.
14 September 2022
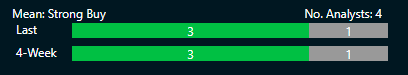
GrowthPoint (GRT) – (Audited Results for the Year Ended 30 June 2022)
Consensus Recommendation BUY
| Highlights |
Actual |
Change |
| Portfolio Assets |
R160.8 billion |
5.2% |
| DIPS |
155.6 cents |
5.1% |
| DPS |
128.4 cents |
8.4% |
| Valuation |
Price to Earnings |
Dividend Yield |
| Growthpoint |
6.1x |
10% |
| FTSE/JSE REITS |
7x |
10% |
South Africa’s largest property company is recovering strongly post the challenging period marked by the covid-19 pandemic. Although revenue contracted marginally by 0.6%, vacancies and rental discounts decreased over the period. Retail and industrial vacancies decreased to 5.5% and 5.7% respectively (FY2021: 6.2% and 9.4%), while Office vacancies expanded marginally to 20.7% (FY2021: 19.9%). Vacancies at the V&A, GOZ (Growthpoint Australia) and C&R also decreased. The cost-to-income ratio for the Group increased to 41.4% from 38.8% for FY2021. The loan-to-value ratio for the Group was 37.9% for (FY2021: 40.0%). A final dividend of 66.9 cents per share was declared. Growthpoint is trading at a 13% discount to its peers from a price-earnings perspective.
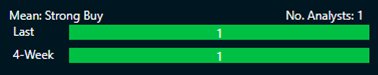
Momentum Metropolitan Operating update and summarised audited annual financial statements for the year ended 30 June 2022
Consensus Recommendation BUY
| Highlights |
Actual |
Change |
| HEPS |
260.6 cents |
732% |
| Normalised headline earnings |
R4.4 billion |
335% |
| DPS |
100 cents |
150% |
| Valuation |
Price to Earnings |
Dividend Yield |
| Momentum Metropolitan |
5.9x |
5.7 |
| FTSE/JSE Life Insurers |
8.8x |
4.5% |
Momentum Metropolitan delivered a 600% rise in profit to R3.80 billion for the full year ended June 2022, allowing the company to declare a final dividend of 65 cents, taking the total payout to 100 cents, the highest since 2017. The improvement in operating profit was driven by improved mortality results and improved investment returns. The company’s life insurance business also delivered operating profit growth, however, Momentum Insure and Momentum Metropolitan African delivered lower operating profits due to severe weather-related claims and large mortality losses. New business increased by 10% to R72.7 billion however the value of new business contracted by 14% to R626 million partly due to a shift towards lower margin products across many of its business units. The new business margin of 0.9% was lower than the prior year’s margin of 1.1%. Momentum noted the rise in emigration and a shrinking savings pool in the country as a key risk to the insurance and investment industry. Momentum is currently trading at a 33% discount to its peers from a price-earnings perspective, while its dividend yield is higher than its peers.
15 September 2022
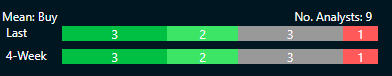
FirstRand - Audited results and ordinary and special cash dividend declaration for the year ended 30 June 2022
Consensus Recommendation BUY
| Highlights |
Actual |
Change |
| Normalised earnings |
R32.7 billion |
23% |
| Net asset value |
R164.9 billion |
9% |
| DPS |
342 cents |
30% |
| Special DPS |
125 cents |
- |
| Valuation |
Price to Earnings |
Dividend Yield |
| FirstRand |
10.9x |
5.4% |
| FTSE/JSE Banks |
9.6x |
5.5% |
FirstRand delivered strong results for the 2022 financial year, recovering fully, and surpassing pre-pandemic levels allowing it to declare its highest annual dividend ever. The increase of 23% in normalised earnings was driven by FNB (60%) which increased its normalised earnings by 22% to R19.6 billion, RMB (25%) increased by 17% to R8.2 billion, WesBank (5%) increased by 23% to R1.6 billion and its UK operations (9%) increased by 9% to R2.9 billion. FNB delivered solid non-interest revenue (NIR) growth of 8%, driven by active customer acquisition, growth in customer activity and higher transactional volumes (+14% in SA). Overall net-interest income (NII) increased by 5% driven by growth in advances and transactional deposits, capital endowment and Group Treasury activities. The Group’s cost-to-income ratio remained stable at 52.5% from 52.4%, and the credit loss ratio contracted to 0.56 from 1.10. The Group return on equity is at a solid 20.6% (FY2021: 18.4), above peer group returns (16.8% average). FirstRand is trading at a 14% premium to its peers from a price-earnings perspective and yielding slightly less which we think is justified.
Sources:
Company Financial Statements and Reports
InFront
IRess
Any opinions, news, research, analyses, prices or other information contained on this website is provided as general market commentary and does not constitute investment advice. ThinkMarkets will not accept liability for any loss or damage including, without limitation, to any loss of profit which may arise directly or indirectly from use of or reliance on such information.

Learn and earn more today.
Visit our Education Centre