Menu
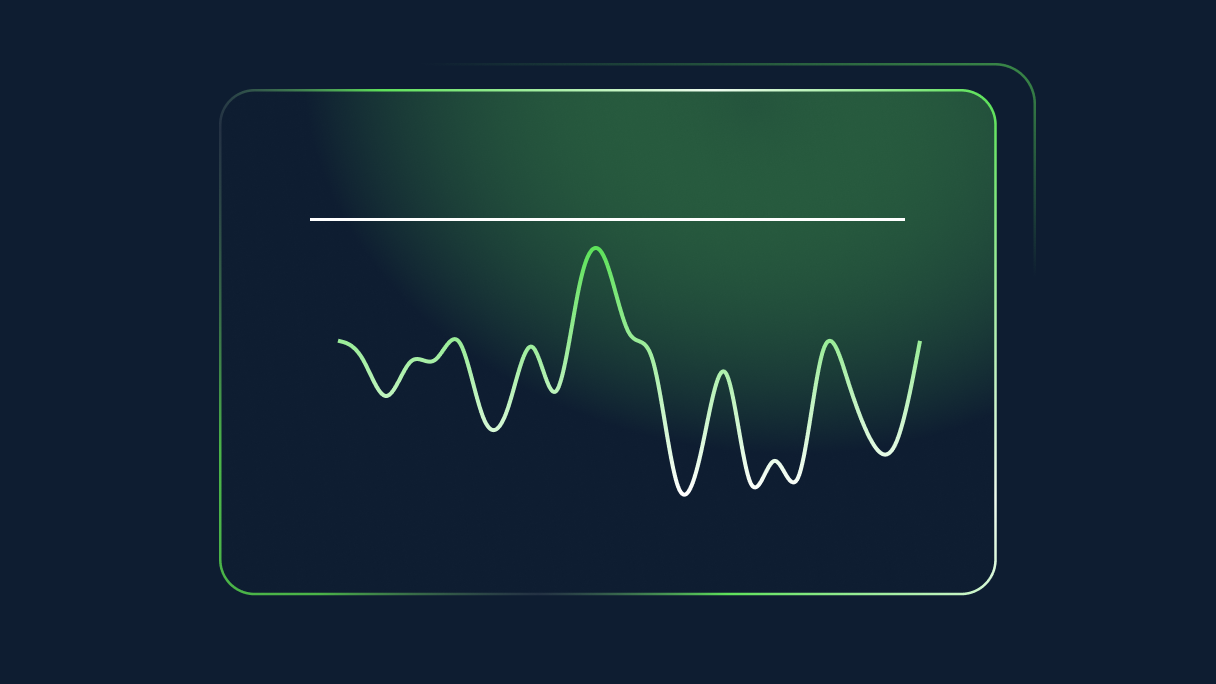
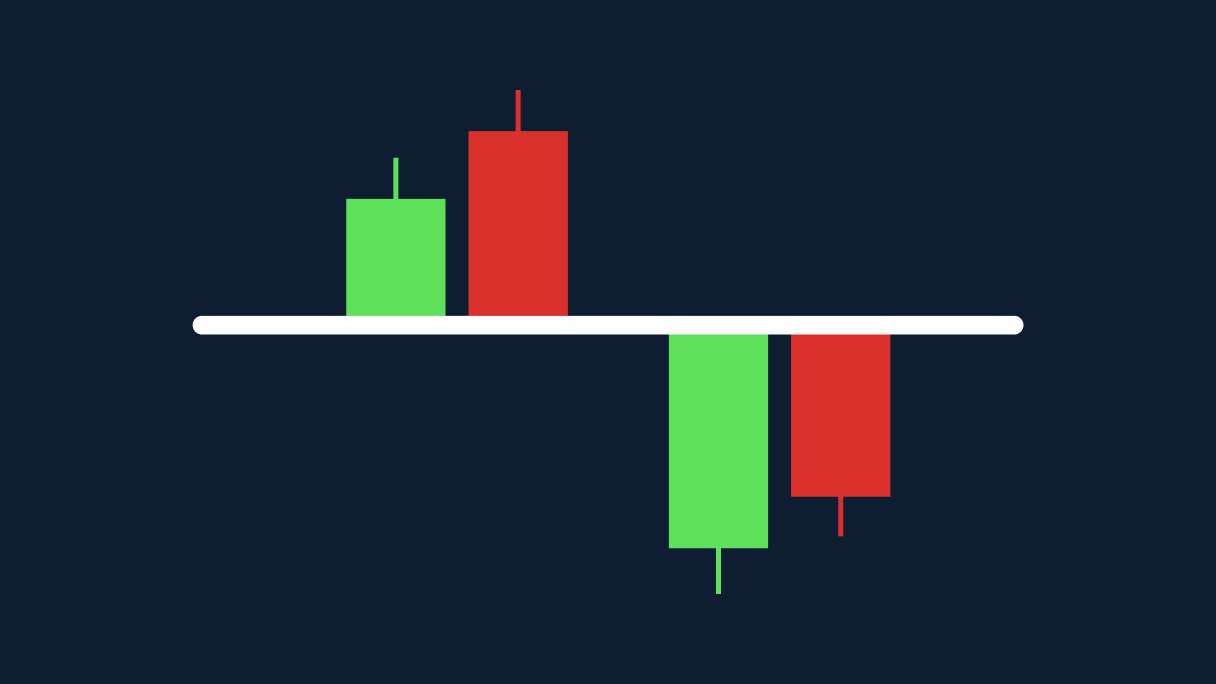
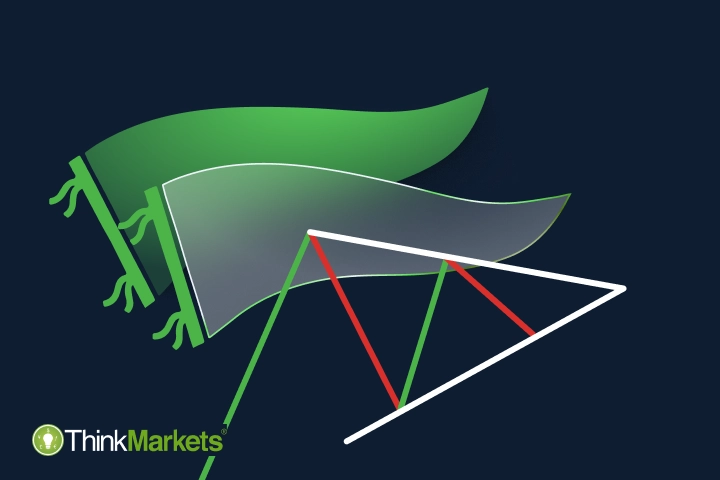
Discover how to identify potential trading opportunities by reading and analysing charts effectively.
 ZA
ZA


.png?ext=.png)