AU
AU
Menu
Markets
Platforms
Learning
Company
Support
Login
Register
Articles (18)
All
Beginners
Experienced
Indicators and patterns
Best Indicators for Swing Trading Every Trader Should Know
16 min read
All
Indicators and patterns
ADX Indicator: How it Works, Trend Strength Signals & Trading Strategies
16 min read
All
Forex
Indicators and patterns
ZigZag Indicator Signals, Strategies and Integration
16 min read
All
Indicators and patterns
What are Forex Economic Indicators and How They Impact Forex Trading
16 min read
All
Forex
Indicators and patterns
What is the Falling Wedge?
6 min read
Beginners
Forex
Indicators and patterns
How to Trade the Bull Pennant Pattern
6 min read
Beginners
Forex
Indicators and patterns
What is a Rising Wedge?
6 min read
Beginners
Forex
Indicators and patterns
A Guide to Trading the Head and Shoulders Pattern
6 min read
Beginners
Forex
Indicators and patterns
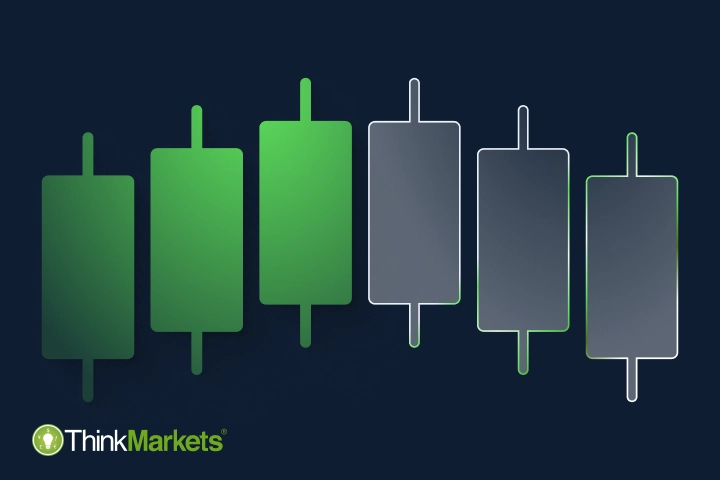
Three White Soldiers and Three Black Crows candlestick patterns
6 min read
Beginners
Forex
Indicators and patterns
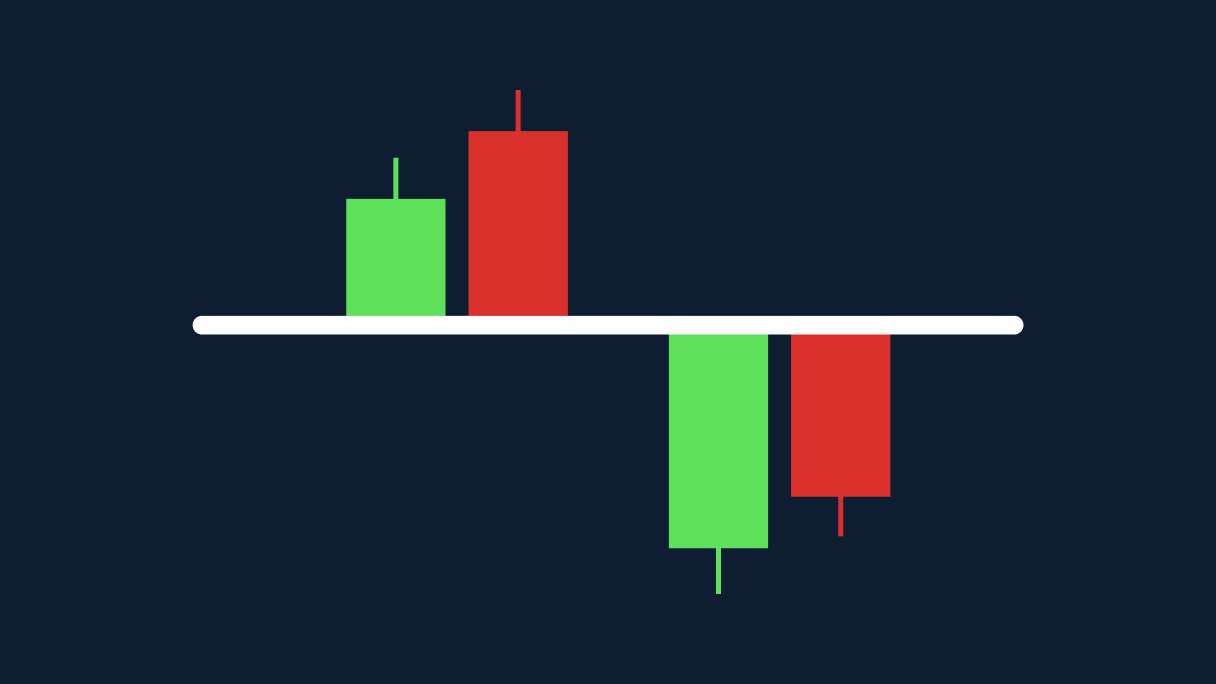
How to trade Tweezer Bottom and Tweezer Top candlestick patterns
6 min read
Beginners
Forex
Indicators and patterns
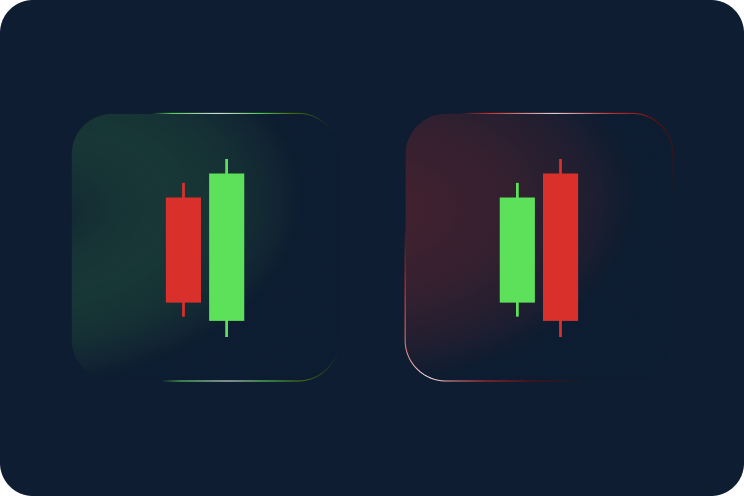
How to trade bullish and bearish Engulfing candlestick patterns
6 min read
Beginners
Forex
Indicators and patterns
What is the Marubozu candlestick pattern?
6 min read
Beginners
 AU
AU


.png?width=744&height=496&ext=.png)