Articles (98)

How to Day Trade: A Complete Forex Guide
<p>An increasing number of traders want to learn how to day trade. However, day trading demands preparation, discipline and a structured approach.</p> <p>While the forex market offers daily trading opportunities across different sessions, a lack of proper organisation and strategy can lead to losses and early burnout.</p> <p>This guide will take you through eight core elements of how to day trade, focusing on proven methods and a systematic approach to day trading forex.</p> <p>Whether you are a complete beginner or considering transitioning to forex day trading, you will learn how to develop a sound trading framework while understanding the associated risks and challenges.</p> <p><strong>What You Will Learn:</strong></p> <ul> <li>Day trading fundamentals and core trading strategies</li> <li>Must-have trading tools and skills needed to start day trading</li> <li>A structured eight-element approach to day trading forex</li> <li>The opportunities and challenges of intraday trading</li> <li>Success factors and practical tips to get you started</li> </ul> <h2>What is Day Trading in Forex Markets</h2> <p>Day trading, also known as intraday trading, involves opening and closing positions within the same day.</p> <p>Unlike traditional investors, forex day traders can capitalise on short-term price movements 250 trading days per year.</p> <p><a href="/en/trading-academy/forex/how-to-trade-forex/">Forex markets</a> operate 24/5. While requiring constant monitoring, this allows day traders to execute 3 to 15 trades across different sessions. That is far more than other markets. Nonetheless, beginner traders typically start with a few trades a week and avoid participating in active trading.</p> <p>Comparing forex day traders with stock day traders in the US, the latter face restrictions under official “pattern day trader” day trading rules and regulations. They must hold a minimum of $25,000 in their margin trading accounts to maintain buying power and place four or more day trades within a five-business-day period that exceeds 6% of their trading activity. If the account falls below this limit, the trader will be restricted from intraday trading until the balance is restored.</p> <p>On the other hand, forex day trading is a form of trading that requires minimal capital and offers greater flexibility, though it demands constant monitoring. It is not as much about how many trades per day one makes or day trading limits, but more about taking the right trade and achieving the day trader's goals.</p> <p><strong>Key Characteristics of Day Trading in Forex Markets</strong></p> <p><img alt="Characterisirtcs of Forex Day Trading (ThinkMarkets)" src="/getmedia/ea80f1c7-fb6a-4e39-8221-3aedd30218ff/Academy-Forex-Characterisirtcs-of-Forex-Day-Trading-ThinkMarkets.png" /></p> <p style="text-align: center;">Characterisirtcs of Forex Day Trading (ThinkMarkets)</p> <h2>How Does Day Trading Work in Forex</h2> <p><a href="/en/trading-academy/forex/what-is-forex-trading/">Forex trading</a> market hours are separated into three main sections: Asian (Sydney/Tokyo), European (London), and American (New York).</p> <p><img alt="Forex Sessions GMT - ThinkMarkets" src="/getmedia/48dcdf14-fac2-44b1-bfc2-8e9ee74f741b/Academy-Forex-Day-Trading-Session-Times-in-GMT.png" /></p> <p style="text-align: center;">Forex Session Times in GMT</p> <p><strong>Forex Trading Sessions (GMT)</strong></p> <ul> <li>Australian Session (21:00-06:00 GMT): Lower volatility, focus on AUD pairs</li> <li>Tokyo Session (23:00-08:00 GMT): Lower volatility, focus on JPY pairs</li> <li>London Session (07:00-16:00 GMT): Highest liquidity, major pairs</li> <li>American Session (12:00-21:00 GMT): Slower USD pairs trading</li> </ul> <p>When forex sessions overlap, they create periods of higher liquidity - an optimal time for day trading signals. The London-New York session overlap is typically the best time for day trading.</p> <p>However, liquidity can vary throughout a day’s session. This affects trade frequency among <a href="/en/trading-academy/technical-analysis/method-to-analyse/">trading styles</a> and types, which has resulted in a preference for different forex trading strategies.</p> <h2>Core Day Trading Strategies in Forex</h2> <p><a href="/en/trading-academy/forex/popular-forex-trading-strategies/">Forex day trading strategies</a> fit different trading approaches and time commitments. Consider choosing yours based on your personality, schedule and trading goals.</p> <p>There are many day trading forex strategies one can utilise. The four most popular are:</p> <ol> <li><strong>Scalping</strong> is the fastest type of day trading forex strategy. Scalpers aim to profit from small movements over very short periods. This requires precise execution and strong risk management. Successful scalpers have strong emotional control and technical analysis skills.</li> <li><strong>News trading</strong> involves capitalising on (expected) market volatility (before or) after major news releases. Successful news traders combine economic calendars and strong fundamental analysis skills with quick interpretations. While its potential is high, it comes with a higher risk. Many day traders lose money due to increased volatility associated with news trading.</li> <li><strong>Trend following</strong> is a more measured approach to catching price moves until the end of the day. It involves fewer trades and requires patience and the ability to tell genuine from false moves. Successful trend day traders are good at pattern recognition and entry and exit discipline.</li> <li><strong>Range trading</strong> allows traders to focus on structured periods of price action when prices oscillate within established support and resistance. Range traders must possess strong price action skills and the means to identify entry and exit points before breakouts.</li> </ol> <p>The best forex trading strategies are typically built by finding the right combination of risk tolerance and time.</p> <p><img alt="Most Popular Day Trading Forex Strategies (ThinkMarkets)" src="/getmedia/828e9d36-2646-47cf-a7fa-15a785681767/Academy-Forex-Most-Popular-Day-Trading-Forex-Strategies-ThinkMarkets.png" /></p> <p style="text-align: center;">Most Popular Day Trading Forex Strategies (ThinkMarkets)</p> <h3>Simple Day Trading Strategy Example</h3> <p>In the following example, a top inside bar candlestick formation is observed during the New York session on EURUSD, March 17. The momentum in the RSI peaked while volumes started to trend lower, signalling the end of day (EOD) trend and a potential consolidation between 1.0910 and 1.0930.</p> <p><img alt="EURUSD EOD Trade into Consolidation, Inside Bar Reversal" src="/getmedia/84d151ec-d45c-48b1-ba29-f1c055a1a69b/Academy-Forex-Day-Trading-EURUSD-EOD-Trade-into-Consolidation-Inside-Bar-Reversal.png" /></p> <p style="text-align: center;">EURUSD EOD Trade into Consolidation, Inside Bar Reversal</p> <p>Indeed, prices moved to the top of the range after finding support at the previous resistance (flipped support) and reverted back to the lower end of the consolidation. Following a slight drop below support, with low volumes, EURUSD shot back to the top and eventually broke higher on March 18 during the European session.</p> <p><img alt="EURUSD Range Bottom Bounce with False Break" src="/getmedia/59511d89-dc35-4a2b-bba6-2466a5ae0f87/Academy-Forex-Day-Trading-EURUSD-Range-Bottom-Bounce-with-False-Break.png" /></p> <p style="text-align: center;">EURUSD Range Bottom Bounce with False Break</p> <h2>How to Choose a Day Trading Strategy</h2> <p>Choosing a day trading strategy requires one to match various criteria to personal characteristics and preferred trading sessions. For instance, some traders do better in scalping, while others in sideways and trending markets – more structured approaches. Trading experience also plays a role in choices.</p> <p>Market factors influence strategy selection. Can you handle volatility? Do you have adequate capital for scalping costs? All of these questions play a vital role in how one selects the most successful day trading forex strategy for them.</p> <p>Some day trading forex strategies demand constant market monitoring, while others allow more flexible time management. But the best type of trading strategies are often built when one considers their daily schedule, session duration, and income goals.</p> <p><strong>Day Trading Strategy Selection Criteria</strong></p> <p><img alt="how to select a day forex strategy" src="/getmedia/df6980fe-3a05-4ef6-95f4-08c32b3a0942/Academy-Forex-Day-Trading-How-to-select-a-day-forex-strategy.png" /></p> <p style="text-align: center;">How to select a day forex strategy</p> <p>A scoring system can be formed using the most important selection criteria. Once decided, one can develop a structured approach for the selected day trading forex strategy and create a trading plan.</p> <p>But successful day traders typically spend several months learning and paper trading. If you jump into day trading as a beginner, you must develop multiple skills before getting skin in the game.</p> <h2>Must-Have Skills to Begin Day Trading Forex</h2> <p>Success in day trading forex depends on continuous learning; skill development is essential for long-term sustainability.</p> <h3>Technical Analysis</h3> <p>The main tool day traders use in forex is technical analysis, <a href="https://www.quantifiedstrategies.com/day-trading-statistics/" target="_blank">with 89% using it</a>. Day trading chart patterns, such as flags, head and shoulders, and triangles, coupled with candlestick patterns, help traders decide when to enter trades and when to exit.</p> <p>Understanding day trading <a href="/en/trading-academy/indicators-and-patterns/technical-indicators-beginners-guide/">technical indicators</a> like moving averages, RSI, and MACD can help traders identify trends and potential reversal points. The best indicators for day trading are usually the simplest ones.</p> <p>Trend and momentum trading skills allow many day traders to position themselves with the market direction. But not even the best technical indicator for day trading works well in complete isolation.</p> <p>When combining trends with volume and volatility indicators, day traders can confirm price breakouts and validate periods of institutional activity. A lack of volume typically translates to fakeouts, as indicated in the EURUSD example.</p> <p><a href="/en/trading-academy/technical-analysis/what-is-technical-analysis-in-trading/">Technical analysis</a> in day trading forex requires understanding short- and long-term price action through multiple timeframe analyses. Start with the daily charts and move down to 1-hour or 15-minute charts.</p> <h3>Fundamental Analysis</h3> <p><a href="/en/trading-academy/technical-analysis/fundamental-analysis/">Fundamental analysis</a> includes scheduled economic data and the reaction of the actual numbers on currency pairs. Understanding the post-release reaction helps traders anticipate market volatility.</p> <p>Breaking news from unexpected developments is another form of analysis. It is not technical but could impact fundamentals. Figuring out the impact of breaking news requires quick thinking and decision-making skills. Social media can influence sentiment. However, <a href="https://afajof.org/management/viewp.php?n=64120" target="_blank">a Harvard study</a> found that trades based on social media generally underperform.</p> <p>Intermarket correlations provide valuable context for trading decisions. For example, how the Australian dollar or the German DAX react to Chinese trade data provides day trading signals or helps change trading decisions.</p> <p>Geopolitical awareness is also important in day trading forex these days. Successful day traders have a broad knowledge of international relations and their potential impact.</p> <p><img alt="Trading with the Economic Calendar (ThinkMarkets)" src="/getmedia/1752e600-f0aa-45da-bd11-a4fca01e935d/Academy-Forex-Day-Trading-ThinkMarkets-Economic-Calendar.png" /></p> <p style="text-align: center;">ThinkMarkets Economic Calendar</p> <h3>Risk Management</h3> <p>Risk management is mandatory in day trading, especially when using leverage in forex. Day traders using margin accounts lose more than those who do not. In contrast, successful traders aim for capital preservation and employ strict position sizing and risk limit rules.</p> <h3>Psychological and Emotional Traits</h3> <p>The best day traders develop strong emotional traits without letting winning or losing streaks affect their decision-making. Those who manage to stay disciplined and handle stress are more likely to be profitable over 6 months.</p> <h2>Essential Tools and Resources For Day Trading</h2> <p>A professional setup requires specific day trading tools and resources to support decision-making and trading discipline.</p> <p>Here is what beginner day traders need:</p> <ul> <li><strong>A good trading platform</strong> serves as the command centre for day trading forex. MT4 is a popular platform but probably not the best day trade platform, given that it lacks advanced features.</li> <li><strong>Real-time news sources</strong> to stay up-to-date with the latest news and events affecting FX pairs.</li> <li><strong>An integrated economic calendar</strong> that helps traders plan sessions around high-impact news.</li> <li><strong>Trading strategy backtesters</strong> allow day traders to test a strategy, optimise it, or simply abandon it for testing the next one.</li> <li><strong>Educational resources</strong> to continually develop skills, including experienced-based courses and webinars.</li> </ul> <p>This approach to tools and resources creates a professional trading environment that improves one’s ability to decision-making and helps maintain trading discipline.</p> <h2>How to Day Trade Forex Appropriately</h2> <p>A structured approach to day trading removes ambiguity from trading decisions. Here are the main eight core elements that must be addressed for day trading forex:</p> <ol> <li><strong>Market Selection</strong><br /> <br /> Choose highly liquid forex pairs like EUR/USD for consistent execution and tight spreads. Major pairs offer predictable price movements and lower transaction costs compared to other pairs. Start with one or two pairs until you develop proficiency.</li> <li><strong>Trading Time</strong><br /> <br /> Select specific forex trading market hours that align with major sessions. The London-New York overlap offers optimal liquidity and day trading signals. Commit to trading the same hours daily to understand volume patterns and price action. A focused 1-2 hours session is more effective.</li> <li><strong>Pre-Market Analysis</strong><br /> <br /> Review your trading charts before your session begins and draw strong support and resistance levels on the daily or 4-hour timeframes for a broader view. Make notes of the highest-probability day trading signals, but check the calendar to know what’s moving and when before committing to trade.</li> <li><strong>Trading Setup</strong><br /> <br /> Set up your trading platform with technical indicators and open a new window for the real-time news feed. Set up alerts for potential entry points and economic calendar notifications. Organise your workspace with multiple timeframes and add the one-click trade pop-up on your selected pairs.</li> <li><strong>Entry And Exit</strong><br /> <br /> Use the simple moving average for trend direction and the RSI for validation. Enter only when multiple signals line up. Set profit targets and stop-losses based on daily levels and ranges. Close all positions by the end of the session and do not hold overnight.</li> <li><strong>Risk Management</strong><br /> <br /> Limit risk to 1-2% per trade, set strict daily loss limits, and maintain adequate capital reserves. Avoid adjusting take-profit targets or stop loss levels once in a trade. Let the trade run, but ensure you are not overexposed or overleveraged at any time.</li> <li><strong>Journaling</strong><br /> <br /> Document every trade with entry and exit points, rationale, market conditions, and anything that helped identify the opportunity. Include screenshots of setups and note emotional states during trades. Review this regularly to refine your strategy.</li> <li><strong>Continuous Learning</strong><br /> <br /> Study winning trades to repeat their success. Stay updated with new tools, resources or courses offered at your selected broker, but also consider joining trading communities to gain insights. Adapting is crucial for future success.</li> </ol> <h2>Forex Day Trading Pros and Cons</h2> <p>Forex day trading presents both significant opportunities and challenges that many aspiring traders underestimate.</p> <p>Let's examine some pros and cons of day trading for beginners to help you make an informed decision before committing time and real money:</p> <h3>Pros of Day Trading</h3> <p><strong>Profit Potential:</strong> Day trading may offer multiple daily opportunities for quick capital turnover and fast realisation of gains, especially when used with proper leverage.</p> <p><strong>Market Flexibility:</strong> The 24/5 forex market operation allows trading from anywhere with multiple currency pairs and strategies and instant execution.</p> <p><strong>Risk Control:</strong> A large percentage of successful day traders managed their positions in real-time, which allows adjustments to limit intraday risks. However, trading is inherently risky.</p> <h3>Cons of Day Trading</h3> <p><strong>Time Commitment:</strong> Day trading requires focused market participation during trading hours, good preparation, continuous learning, and real-time decision-making.</p> <p><strong>Psychological Demands:</strong> The high-stress environment of the active forex market requires emotional control to avoid decision fatigue and the pressure associated with daily performance.</p> <p><strong>Capital Requirements:</strong> It requires enough trading capital for the highest probability positions, plus costs for good trading tools or resources.</p> <h4>Day Trading Pros and Cons (Extended)</h4> <p><img alt="Day Trading Pros and Cons (ThinkMarkets)" src="/getmedia/c82ef0d2-61d0-4fd8-a729-08fe5fc2bd82/Academy-Forex-Day-Trading-Day-Trading-Pros-and-Cons-ThinkMarkets.png" /></p> <p style="text-align: center;">Day Trading Pros and Cons (ThinkMarkets)</p> <h2>Day Trading Tips</h2> <p>Successful day traders follow tested principles rather than just technical analysis or knowledge. From years of market experience and real results, the following day <a href="/en/trading-academy/technical-analysis/10-tips-to-successful-trading/">trading tips</a> might help you build a more disciplined and systematic trading routine.</p> <p><strong>Focus on High Liquidity:</strong> Trade major currency pairs with tight spreads for better execution, lower transaction costs, and smoother entries and exits.</p> <p><strong>Time Your Trades:</strong> Avoid the most volatile periods initially and consider waiting 15-20 minutes after markets open to let price action settle and avoid false breakouts.</p> <p><strong>Risk-Reward:</strong> Target at least 1:2 risk-reward on every trade, so your potential gains are twice your possible losses.</p> <p><strong>High-Probability Setups:</strong> Only enter trades when multiple technical indicators line up with your strategy, even if that means you miss a trading day. Performance is more important than labels.</p> <p><strong>Multiple Strategies and Time Frames:</strong> Adapt your approach to the market and analyse different time frames to get the full picture.</p> <p><strong>Review:</strong> Regularly review your journal to find patterns in your wins and losses. It will help refine your strategy and decision-making.</p> <p><strong>Take a Break:</strong> Step away from trading after big wins or losses to stay emotionally balanced and avoid decisions that can damage your account.</p> <p><strong>Never Trade with Money You Can’t Afford to Lose:</strong> Most traders lose money in the long run. Only trade with money you can afford to lose for day trading. Protect your financial stability.</p> <h2>Conclusion</h2> <p>Day trading forex requires market knowledge, a structured approach and the right combo of technical and fundamental skills, risk management, and emotional discipline. Throughout this guide, we have outlined the eight core elements that shape the foundation of effective day trading, from market selection to continuous learning.</p> <p>Successful traders focus on consistency through proper risk management and detailed record-keeping rather than aggressive trading. Remember that forex markets, while offering abundant opportunities, carry significant risks.</p> <p>Whether starting now or transitioning from other strategy types, focus on building a strong foundation first. Progress comes from patience, discipline, and continuous improvement. Protect your capital, maintain detailed records, and trade within your means.</p>
What is Martingale in Trading? How Martingale Strategy Works?
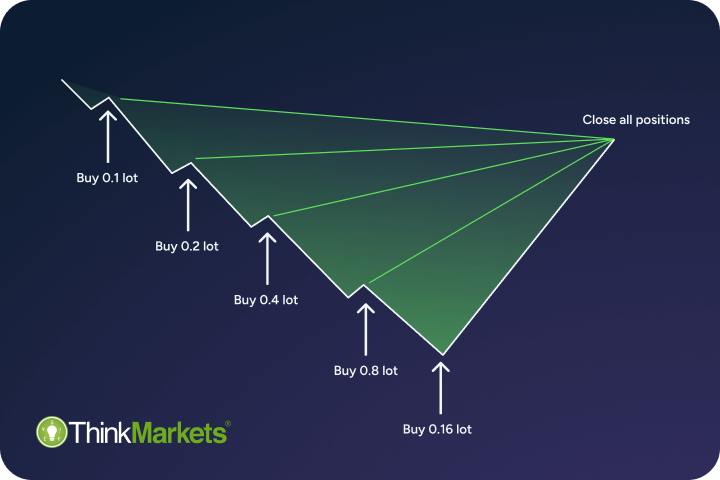
<p>Martingale in trading is a controversial strategy designed to recover several losing trades through a single winning trade.</p> <p>While it may seem appealing at first, the Martingale strategy carries significant risks that aspiring Martingale traders must consider before using it.</p> <p>This article explores how Martingale trading works, its advantages and hidden pitfalls, and some alternative ways to use Martingale in Forex trading.</p> <h2>The Classic Martingale Strategy</h2> <p>The classic Martingale strategy is a risk management technique that originated in 18th-century France as a betting system for binary outcomes, such as coin flips or casino roulette.</p> <p>The core idea of the Martingale system involves double betting after each loss to recover all previous losses and yield a profit equal to the initial stake. The approach assumes that using a doubling strategy behind each loss reduces the chance of continued loss in half every next bet, which creates an illusion of short-term recovery. However, this method falls prey to the gambler’s fallacy—the mistaken belief that past events influence future outcomes.</p> <p>Initially introduced in probability theory by French mathematician Paul Pierre Levy, the Martingale concept was later adapted as a risk management model following the extensive work on martingales and stochastic processes by American mathematician Joseph Leo Doob. Doob refuted the notion of a 100% foolproof Martingale investment strategy.</p> <p>To illustrate the Martingale theorem in practice, consider a simple 50/50 heads-or-tails game. Suppose you start with a $1 stake on heads; if you lose, you double your stake to $2, then to $4 with another loss, and so on.</p> <p><img alt="The Martingale Double-betting Strategy" src="/getmedia/46747186-0c22-4fce-ba22-0db682efa0d1/Academy-Forex-Martingale-The-Martingale-Double-betting-Strategy.png" /></p> <p style="text-align: center;">The Martingale Double-betting Strategy</p> <p>In the example, a final winning trade of $16 would cover all previous losses totalling $15 and yield a $1 profit — the same as the initial stake. However, these infrequent wins in the Martingale strategy obscure the long-term risk of ruin, creating a false parallel between asset price reversals and gambling odds, which contributed to the adoption of Martingale in trading.</p> <h2>Introduction to Martingale in Forex Trading</h2> <p>Although financial markets lack the fixed odds of a traditional betting strategy, the Martingale in Forex trading gained popularity amongst traders in the 2010s thanks to its mechanical appeal and the adoption of the FX market, including the rise of algorithmic and probability trading.</p> <p>One key factor in the prominence of Martingale trading strategies is the availability of smaller lot sizes (mini lots), which enables traders to start with relatively small position sizes and gradually scale up as needed.</p> <p>Another factor is the leverage provided by many Forex brokers. Leverage allows Martingale traders to control larger positions with less capital, making high-risk trading strategies like the Martingale strategy more appealing—though it also magnifies losses.</p> <h2>What is Martingale in Forex Trading</h2> <p>Martingale in Forex trading is essentially a dynamic position sizing strategy based on the theory of mean reversion, which suggests that asset prices tend to return to their average. Traders using a Martingale Forex strategy believe that doubling up behind each loss will facilitate a fast recovery by increasing the odds of a shorter pullback to the mean.</p> <p><img alt="Martingale in Forex - ThinkMarkets" src="/getmedia/b69372e9-1bff-4169-8260-e12d2f84c6a1/Academy-Forex-Martingale-The-Martingale-Process-in-Forex-Trading.png" /></p> <p style="text-align: center;">The Martingale Process in Forex Trading<sup><a href="#image-footnote-1">(1)</a></sup></p> <p>It is important to understand that while a Martingale Forex strategy may offer the potential for recovery through the mean reversion process, it also carries significant risks and can result in substantial losses unless favourable market conditions exist.</p> <h2>Assumptions of Martingale in Trading</h2> <p>Beyond mean reversion, Martingale trading assumes that random, extreme events, such as the February 2025 "DeepSeek" crash, will not occur.</p> <p>It also presumes that prolonged trends in the Forex market are absent since established trends significantly increase Martingale risk.</p> <p>Overall, implementing a Martingale strategy in Forex trading demands a thorough understanding of short — and long-term market trends and overall market efficiency.</p> <h2>How Does the Martingale Strategy Work in Forex</h2> <p>To demonstrate how a Martingale Forex strategy works in trading, the following table outlines the progression of five trades - including lot sizes and performance in account balance money- assuming a starting balance of $1000 with a stop loss and profit target of 50 pips.</p> <p><img alt="Martingale Strategy Forex Example" src="/getmedia/1aa3ee14-5e93-427f-ad9a-0a4598fd6e12/Academy-Forex-Martingale-Martingale-Strategy-Forex-Example.png" /></p> <p style="text-align: center;">Martingale Strategy Forex Example</p> <p>In this example, the Forex trader risks a cumulative total of $750 to secure a $50 profit—15 times the initial risk exposure—after enduring four consecutive trades with equidistant losses. This four-trade losing streak represents 75% of the starting balance, explaining why many traders deplete their accounts before achieving a win.</p> <p>In a Martingale layer strategy, if a long position encounters five consecutive adverse moves, the trader doubles the lot size after each fixed pip drop loss. For example, the lot size might double from 0.1 lots to 1.6 lots after four consecutive losses of 20 pips each.</p> <p><img alt="Martingale Trading Strategy (Martignale Layer) - ThinkMarkets" src="/getmedia/cf2a9e44-41c1-40b5-a665-a6ea9e6e6edb/Academy-Forex-Martingale-Martingale-Strategy-Example-Martingale-Layer.png" /></p> <p style="text-align: center;">Martingale Strategy Example (Martingale Layer)<sup><a href="#image-footnote-1">(2)</a></sup></p> <h2>EUR/USD Martingale Strategy Example</h2> <p>To illustrate how Martingale trading strategies work in the FX market, consider a scenario with the EUR/USD currency pair during a period of a sideways market. It is important to mention that when traders use the Martingale strategy on liquid pairs like EUR/USD, they can open and close positions smoothly during a series of losses.</p> <p>Suppose a Forex trader notices that EUR/USD has fluctuated between 1.0500 and 1.0460 (a 40-pip range) for several hours, with no clear trend emerging and a flat moving average. Believing that this range-bound behaviour will persist, the trader enters the market by buying 0.1 lots of EUR/USD at 1.0460.</p> <p>The trade is held without a set profit level in anticipation of a breakout. However, when the trade turns unfavourable below the upper band, the trader implements a Martingale layer strategy and doubles down every 40 pips (40-pip layer).</p> <p>The price slides 40 pips below entry at 1.0420, and the trader enters a long position at 0.2 lots, twice the original trade size of the first bet.</p> <p>Following the strategy, the Martingale trader doubles the position size to 0.4 lots and buys again at 1.0380 after another breakdown. Although the price continues to fall, it does not reach the next layer at 1.0340 (which would trigger a 0.8 lot position).</p> <p>Finally, when the price reverses 40 pips to 1.0420, the trader closes all positions for a profit. (For simplicity, this example assumes no commissions or spreads.)</p> <p><img alt="Martingale Strategy Chart, EUR/USD Trade" src="/getmedia/e2f298bb-b0b4-4a5d-95d3-f620bf1ab784/Academy-Forex-Martingale-Strategy-Chart-EURUSD-Trade.png" /></p> <p style="text-align: center;">Martingale Strategy Chart, EUR/USD Trade</p> <p>In this example, the trader successfully implements a Martingale Forex strategy. However, had the price fallen another 91 pips, the risk would have increased to $728, double the size of the previous loss.</p> <p><img alt="Martingale EURUSD Trade - ThinkMarkets" src="/getmedia/6c09a52a-c6af-472f-9520-1a4bff667de7/Academy-Forex-Martingale-Martingale-Positioning-Strategy-Long-EURUSD.png" /></p> <p style="text-align: center;">Martingale Positioning Strategy, Long EURUSD</p> <p>This is why the Martingale system is a system that requires carefully calibrated stop-loss and take-profit levels to manage risk.</p> <h2>Risks and Drawbacks of Using Martingale in Trading</h2> <p>Although the Martingale strategy can work in theoretical examples, several constraints exist in real-time applications. Below, we expand on the key risks and drawbacks.</p> <h3>Exponential Losses</h3> <p>The biggest risk of using Martingale in trading is the risk of ruin from exponential losses, which becomes more likely when the number of consecutive losses grows.</p> <p>Doubling down after each loss in previous trades can quickly increase the required capital to the point of no return.</p> <p>Here's an example showing how quickly losses can accumulate using the Martingale strategy.</p> <h4>Martingale Strategy Example of 10 Consecutive Losses</h4> <p>For example, consider a Martingale trade with an initial size of $100. The sequence of consecutive losses would look as follows:</p> <p><img alt="Martingale Losing Streak Risk of Ruin - ThinkMarkets" src="/getmedia/bdcc21bb-b845-410b-91b6-72d016daefb3/Academy-Forex-Martingale-Martingale-Losing-Streak-Example.png" /></p> <p style="text-align: center;">Martingale Losing Streak Example</p> <p>After 10 consecutive losing trades, the cumulative losses would amount to a staggering $102,400, with the required lot size ballooning to 102.4 or a 1000-fold over the initial capital.</p> <p>Even a $100 stake would still require $1,600 by the fifth loss, showing how quickly a string of consecutive losses can lead to a negative balance.</p> <h3>Psychological Pitfalls from Chasing Losses</h3> <p>Another drawback of using a Martingale strategy is the psychological trap of chasing losses. As traders double their position sizes after each loss, they may become emotionally attached and make irrational decisions. The psychological pressure of realised losses can lead to revenge trading, which can result in additional capital loss.</p> <h4>Trading Costs and Spreads</h4> <p>Another reality of Martingale trading is the impact of transaction costs and spreads. Even if a trader recovers losses, the additional costs from multiple trades can erode profits or exacerbate losses, especially when one trades in volatile markets.</p> <h2>Why Traders Use Martingale in Forex?</h2> <p>While Martingale trading strategies carry significant risks, many traders keep using the Martingale strategy in Forex due to its potential benefits. Here are the key advantages:</p> <h3>Ability to Recover Losses Fast</h3> <p>A primary advantage of using Martingale in trading Forex is its (therotical) ability to fully recover from successive losses on a single winning trade. Martingale Forex strategies also offer some traders a structured approach to position sizing.</p> <h3>Trader Profile and Psychology</h3> <p>The potential for a quick recovery can particularly appeal to risk-tolerant traders who prefer aggressive day trading strategies and larger trade sizes. Overconfidence and an illusion of control over market outcomes may also drive some traders to adopt Martingale in Forex trading, as they believe they can effectively manage the risks associated with the strategy.</p> <h3>Works in Certain Market Conditions</h3> <p>Martingale trading strategies can appear profitable in the short term under specific conditions. Traders may initially have a good success rate with the strategy, which may reinforce their belief in its effectiveness. Some Martingale traders also use the Martingale system in combination with technical analysis and other trading strategies, such as the Martingale Fibonacci, to mitigate risks.</p> <h2>Is Martingale Trading Right for You?</h2> <p>Deciding whether the Martingale suits your trading style requires carefully weighing the potential benefits against the significant risks involved. While Martingale trading strategies may offer a quick recovery from losses and the possibility of returns under certain market conditions, they also carry a risk of ruinous losses and account depletion.</p> <h3>Pros and Cons of Martingale Trading</h3> <p>Before implementing this strategy, traders should assess their risk tolerance, trading experience, and financial capacity to withstand potential drawdowns.</p> <p><img alt="Alt tag: Martingale Forex Trading Benefits and Risks - ThinkMarkets" src="/getmedia/622c11b2-e834-4e47-a14d-415a19a535be/Academy-Forex-Martingale-Martingale-Trading-Pros-and-Cons.png" /></p> <p style="text-align: center;">Martingale Trading Pros and Cons</p> <h2>Risk Management for Martingale Trading</h2> <p>Martingale in Forex trading poses high risks. Traders who choose to use it must adhere to strict risk management practices to mitigate potential losses and should consider risk management techniques:</p> <ul> <li>Proper Position Sizing: Start with small position sizes and set a maximum limit on the number of times you are willing to double your positions.</li> <li>Implement Strict Stop-Loss Orders: Set predetermined exit points for trades to cap potential losses and protect against ruinous drawdowns.</li> <li>Fixed Fractional Risk Management: Risk a fixed percentage of your account balance on each Martingale trade with a maximum stop loss percentage or trade loss.</li> <li>Diversify Across Assets: Spread your risk across multiple currency pairs or even different asset classes to help reduce the impact of adverse price movements.</li> <li>Hedge with Correlated Pairs: Use correlated currency markets to provide additional protection against potential losses.</li> <li>Monitor Markes: Continuously monitor market conditions and be prepared to abandon the strategy if a clear trend emerges.</li> <li>Asset Selection: Major currency pairs (EUR/USD, GBP/USD) offer perceived stability vs volatile assets.</li> </ul> <h2>Alternatives to the Martingale Forex Strategy</h2> <p>Also known as the anti-Martingale strategy, the reverse Martingale strategy involves doubling position sizes after winning trades rather than losing trades and reducing them after losing trades. This method of investing seeks to capitalise on winning streaks while limiting exposure during losing periods.</p> <h3>Reverse Martingale Strategy</h3> <p>Also widely known as the anti-Martingale strategy, the reverse Martingale strategy involves doubling up position sizes after winning trades and not after losing ones while reducing sizes after losing trades. This method of investing seeks to take advantage of winning streaks and potentially limit exposure during periods of loss.</p> <p><img alt="Martingale vs Reverse Martingale Performance" src="/getmedia/5d0a77f5-d4ce-4854-93a1-88dd7cc3563c/Academy-Forex-Martingale-Martingale-vs-Anti-Martingale-Strategy-Performance.png" /></p> <p style="text-align: center;">Martingale vs Reverse Martingale Performance<sup><a href="#image-footnote-1">(1)</a></sup></p> <h3>Pyramid Martingale</h3> <p>The Pyramid Martingale works in a similar way to the anti-Martingale trading strategy, with the fundamental difference being the addition of the initial stake to winning trades and not losing ones. This method exploits momentum, following the "let winners run" philosophy.</p> <h3>Trend Following</h3> <p>This variation of the Martingale Forex strategy focused on identifying and capitalising on established market trends by trading with the prevailing market direction, potentially reducing the frequency of losing trades. For example, traders might use Martingale long positions during pullbacks in an upward trend.</p> <h4>Strategy Comparison Mix Based on Statistics</h4> <p><img alt="Martingale Forex Strategy Types - ThinkMarkets" src="/getmedia/bd991819-babf-47cd-b238-f9c984d9e7d1/Academy-Forex-Martingale-Martingale-Trading-Strategies.png" /></p> <p style="text-align: center;">Martingale Trading Strategies</p> <h2>Conclusion</h2> <p>The use of Martingale in trading carries a high degree of risk that traders must carefully consider before use.</p> <p>While it has the potential to recover losses quickly, a Martingale Forex strategy relies on the assumption of mean reversion and favourable market conditions, which can lead to exponential losses during prolonged losing streaks or trending markets.</p> <p>Aspiring Martingale traders must also prepare psychologically. Although the Martingale approach offers a structured method for position sizing and the potential for fast recovery, it is not suitable for everyone.</p> <p>Traders considering using Martingale in trading should assess their risk tolerance, trading experience, and financial capacity to endure substantial drawdowns.</p> <p>For those who find it unsuitable, alternative strategies, such as the anti-Martingale, pyramid Martingale and trend following Martingale, may offer more sustainable long-term results.</p> <p>Ultimately, Martingale traders must balance the potential benefits of Martingale in Forex against its significant risks and adhere to strict risk management practices.</p> <br /> <br /> <p id="image-footnote-1"><sub>1. This image is a recreation that first appeared on 4xpip</sub><br /> <sub>2. This image is a recreation that first appeared on kagels trading</sub></p>
Trading Forex with the Reverse Martingale Strategy: Insights, Execution, and Risks
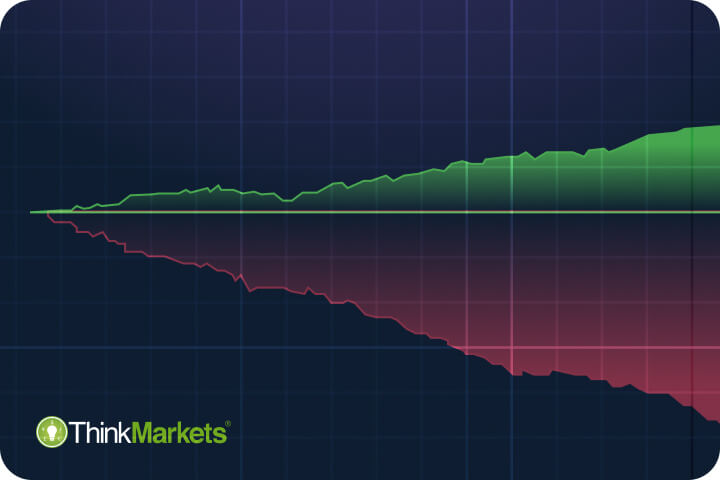
<p>The Reverse Martingale strategy, also known as the anti Martingale strategy, is a popular approach used for risk management in Forex trading. It is a position sizing strategy that leverages winning streaks and does not attempt to recover consecutive losses like the classic Martingale system.</p> <p>Its focus on wins inspires trend traders to use it during a Forex trend or momentum trading. The Reverse Martingale strategy capitalises on directional movements, effectively "riding the wave" of an established trend in Forex.</p> <p>Compared to the classic Martingale, the anti Martingale system assumes a more conservative risk management profile. While the Martingale doubles the trade size after a loss, the Reverse Martingale trading strategy resets it or at least halves it.</p> <p>In this article, we will explore the mechanics of the Reverse Martingale method, how it is used with trend following strategies, and the potential pros and cons associated with its use.</p> <h2>What is the Anti Martingale Strategy in Forex Trading</h2> <p>The anti Martingale strategy in <a href="/en/trading-academy/forex/what-is-forex-trading/">Forex trading</a> doubles up the trade size after every win and resets it to the original position size after every loss. For instance, winning a 1 lot trade three times in a row produces 8 lots, while resetting to the original position size of 1 lot after every loss.</p> <p>The anti Martingale system is employed by traders who seek to capitalise on winning trades and attempt to minimise losses during unfavorable market conditions. The net loss is always equal to the initial stake.</p> <p>At its core, the anti Martingale system often confirms a Forex trend during a winning streak, which may create a more sustainable path to account growth. However, it is more suited for trend traders with validated trend following strategies.</p> <p>The long-term returns on 1000 lots traded below simulate how suitable the Reverse Martingale is when used in conjunction with trend trading strategies or during sideways markets. However, simulations in any type of auto trading software do not guarantee future results.</p> <p><img alt="Reverse Martingale Performance in Trending Markets" src="/getmedia/6c74d45f-bf89-4ae3-83df-370c2f388d4f/Academy-Forex-Reverse-Martignale-Anti-Martingale-Strategy.png" /></p> <p style="text-align: center;">Reverse Martingale Performance in Trending Markets<sup><a href="#image-footnote-1">(1)</a></sup></p> <p>The Reverse Martingale strategy may work well during intraday trading on Forex currency pairs like EUR/USD, GBP/USD, and USD/JPY. Forex trends can be identified with ease when measured with a moving average or other trend trading indicators, such as the Moving Average Convergence Divergence (MACD) or the <a href="/en/trading-academy/indicators-and-patterns/rsi-indicator/">Relative Strength Index (RSI)</a>.</p> <h2>How Does the Reverse Martingale Strategy Work in Trading</h2> <p>The Reverse Martingale in trading works by doubling up the position size after a win to capitalise on gains and resetting it after a loss in an attempt to minimise losses. However, trading is risky, and trading with the anti Martingale system may still lead to substantial losses.</p> <p>Here is how the anti-Martingale system works when trading the Forex markets:</p> <ol> <li><strong>Initial Investment:</strong> Begin with a fixed lot size or account percentage that is comfortable to risk, as it sets the base for the position size increases.</li> <li><strong>Set Profit and Loss Targets:</strong> Establish clear profit and loss targets and how many cycles to double down for before entering a trade.</li> <li><strong>Double Down on Wins:</strong> After a win, double down on the next trade to capitalise on the gains of the previous trade.</li> <li><strong>Reset after Loss:</strong> When a trade results in a loss, revert to the initial position size, as it ensures risking only the initial stake at any time.</li> </ol> <p>Consider the intraday trading journey of a Reverse Martingale trader as an example:</p> <p><img alt="Reverse Martignale vs. Clasic Martingale" src="/getmedia/67589714-f499-4626-ba4e-62b74337c6d8/Academy-Forex-Reverse-Martignale-vs-Clasic-Martingale.png" /></p> <p>Due to the leveraged nature of currency markets, some traders increase the amount of a trade size by 20% to 50% instead of doubling it each time. However, the value of trades that win is reduced in such cases. They sometimes employ a more strict <a href="/en/trading-academy/forex/risk-management/">risk management</a>, resetting to the original stake immediately after a single loss.</p> <h3>Example of Reverse Martingale Trade during EUR/USD Trend</h3> <p>Consider starting a long position of 0.1 lots in a EUR/USD uptrend in Forex. Here is how four 100-pip winning trades would look like:</p> <p><img alt="EURUSD Reverse Martingale Trade - ThinkMarkets" src="/getmedia/edc94578-f83a-4897-9f92-818b4550865a/Academy-Forex-Reverse-Martignale-EURUSD-RM-Trade.png" /></p> <p style="text-align: center;">Anti Martingale Trade in EURUSD Uptrend</p> <h2>What Makes the Anti-Martingale Strategy Better than Martingale</h2> <p>Some Forex traders assume that the Reverse Martingale system is a system of higher superiority to the standard Martingale because it prioritises capital preservation. It is fundamentally the reverse of the traditional Martingale system, which doubles the position size after each loss.</p> <p>A simulation compared head-to-head the performance of the anti-Martingale and Martingale strategies on a single trade. On the one hand, it showed the Reverse Martingale trade gaining during a trend following strategy and flatlining during a flat market. On the other hand, the Martingale trade performed well during the flat market until a trade loss and doubling up resulted in the depletion of the account. However, simulated performance is not an indication of future results.</p> <p><img alt="Anti-Martingale Trade Performance" src="/getmedia/c3db7748-5d08-49b5-80cc-8e023b6406db/Academy-Forex-Anti-Martingale-Trade-Performance.jpg" /></p> <p style="text-align: center;">Anti-Martingale Trade Performance<sup><a href="#image-footnote-1">(1)</a></sup></p> <p>The simulation results or the assumption of superiority does not change the equal probability of winning or losing individual trades. Nonetheless, the ability to limit losses and leverage winning streaks during a trend trading strategy could lead to less severe outcomes over time.</p> <p>Here are the main reasons some traders prefer using the anti-Martingale trading system instead of the Martingale strategy.</p> <h3>Capital Preservation</h3> <p>The Martingale and anti-Martingale strategies use similar mechanics. However, the anti Martingale strategy aims to reduce exposure after losses, while the Martingale increases it. By reducing position sizes after losses, traders protect their capital from large drawdowns.</p> <h3>Capitalises on Wins</h3> <p>The Martingale system is a betting system that attempts to recover losses, while the Reverse Martingale capitalises on a hot streak. This focus on wins may create a more sustainable path to account growth, though the outcome of the next trade can never be certain.</p> <h3>Riding Momentum</h3> <p>The anti Martingale strategy involves doubling the trade size after each win, often confirming market momentum. Conversely, the classic Martingale strategy relies on the principle of mean reversion, which suggests a sideways market.</p> <h3>Psychological Edge</h3> <p>The anti Martingale strategy trade size resets prevent revenge trading and chasing losses, while scaling during a series of winning trades can boost trader confidence. The Reverse Martingale is essentially a strategy that promotes a "let profits run" approach, a strategy less prone to revenge trading.</p> <p><img alt="Reverse Martignale vs. Clasic Martingale" src="/getmedia/61a8387d-780d-4844-b8b2-e2c26f49639e/Academy-Forex-Reverse-Martignale-vs-Clasic-Martingale-table.png" /></p> <h2>When Do Traders Switch to the Anti-Martingale Strategy</h2> <p>Traders typically consider switching to the anti-Martingale strategy after a series of losing streaks while using the traditional Martingale system. This logical transition prompts them to seek a more mature approach to risk management and capital preservation.</p> <p>Specifically, traders commonly switch to Anti-Martingale when:</p> <ul> <li><strong>They experience significant losses</strong> using the traditional Martingale and have experienced a losing streak.</li> <li><strong>They appreciate capital preservation</strong> and understand the importance of protecting their trading capital.</li> <li><strong>They seek psychological comfort</strong> through a strategy that rewards wins rather than keeps doubling sizes after losses.</li> <li><strong>They develop stronger market analysis skill</strong>s, becoming confident in the use of trend <a href="/en/trading-academy/indicators-and-patterns/technical-indicators-beginners-guide/">indicators</a> and momentum strategies.</li> </ul> <p>Professional traders selectively use the anti Martingale strategy rather than as a next bet, employing it when they spot strong market momentum. In simpler terms, they count on the consistency of their intraday trading strategies and the ability to remain disciplined in their risk management rules.</p> <h2>Risks of Using the Reverse Martingale in Forex Trading</h2> <p>While it can, at times, bear fruit, the Reverse Martingale strategy does not come without its risks, even though it uses different trading criteria. Being aware of such risk can help traders make better decisions and potentially manage their exposure more effectively.</p> <p>The potential risks traders face when using the Reverse Martingale strategy in Forex trading are:</p> <ul> <li><strong>Loss of Accumulated Profits:</strong> Profits reinvested into progressively larger positions can quickly dissipate following a single losing trade.</li> <li><strong>Exposure to Market Reversals:</strong> Larger positions after wins increase the odds of reversals in a trend in Forex – particularly in volatile financial markets.</li> <li><strong>Difficulty in Size Reduction:</strong> Some traders struggle to reduce lot sizes after experiencing losses, which typically leads to poor strategy execution.</li> <li><strong>Overconfidence and Poor Risk Assessment:</strong> A series of wins can lead traders to underestimate potential risks, fail to analyse trades properly, and eventually ignore trading plans.</li> <li><strong>Dependence on Exit Timing:</strong> Difficulty timing exits can compel some traders to hold large positions for longer that they should, risking profit erosion.</li> </ul> <h2>How to Trade with the Reverse Martingale Strategy in Forex</h2> <p>Trading Forex with the Reverse Martingale strategy requires sticking to risk management rules, disciplined scaling and resetting execution, and a strong emotional acumen.</p> <p>Below are some key guidelines for trading with the Reverse Martingale strategy in Forex:</p> <ul> <li><strong>Establish a Base Position Size:</strong> Define an initial trade size based on your risk profile and account size. This base size serves as your starting point and the position you reset to after losses.</li> <li><strong>Clearly Define Position Sizing Rules:</strong> Set clear rules for increasing positions after winning trades (often doubling) and reverting to base size after losses. Stick to these rules to maintain strategy integrity.</li> <li><strong>Identify Clear Market Trends and Momentum:</strong> The Reverse Martingale strategy is best utilised in Forex trend trading. Trend traders should confirm the direction using trend indicators such as moving averages and trendlines, or confirm market momentum.</li> <li><strong>Set Strict Risk Management Parameters:</strong> Always use predefined stop-loss and take-profit levels. Consider setting a maximum position size or a cap on consecutive lot-size increases to prevent excessive exposure.</li> <li><strong>Regularly Review and Adjust the Strategy:</strong> Continuously evaluate your trading performance and market conditions, and adjust your trading style as necessary.</li> </ul> <h3>Step-by-Step Reverse Martingale Trading at ThinkMarkets</h3> <p>Implementing the Reverse Martingale strategy takes many steps, but this process is straightforward with ThinkMarkets. ThinkTrader offers a range of advanced tools to help traders automate trades and increase efficiency in trade execution.</p> <p>Next is a step-by-step EURUSD trade on how to use the Reverse Martingale strategy at ThinkMarkets.</p> <h4>Step 1: Establish Your Base Position Size</h4> <p>Consider trading the pair on ThinkTrader. First, calculate your position size. With a $10,000 account, a conservative approach might be a 0.1 lot position (approximately $100 risk per trade). Enter this value in the ThinkTrader order window.</p> <p><img alt="EURUSD Anti Martingale Trade - ThinkMarkets" src="/getmedia/bdfa5163-0a8e-4510-9710-cf6cbf77e3a4/Academy-Forex-Reverse-Martingale-EURUSD-RM-Order.png" /></p> <p style="text-align: center;">EURUSD Anti Martingale Order</p> <h4>Step 2: Define Your Position Sizing Rules</h4> <p>Using the ThinkTrader notes feature or a journal, document your specific Reverse Martingale progression rules. For example:</p> <ul> <li>After a winning trade: Double position size (0.1 → 0.2 → 0.4 lots)</li> <li>After a losing trade: Return to base position size (0.1 lots)</li> <li>Set a maximum position size: 0.8 lots (or use the number of consecutive wins)</li> <li>Create a journal in your trading plan to record notes during trading sessions</li> </ul> <h4>Step 3: Identify Favorable Market Conditions</h4> <p>ThinkMarkets' advanced charting package helps identify strong trends in your chosen FX pair. For example, you can validate the strength of a breakout during a EUR USD trend with increasing volume and the use of trend indicators. The <a href="/en/trading-academy/indicators-and-patterns/atr-indicator/">Average True Range (ATR)</a> can confirm a downtrend or uptrend in Forex before entry.</p> <h4>Step 4: Execute Your Initial Trade</h4> <p>Using ThinkMarkets' trading platform, ThinkTrader:</p> <ul> <li>Select EUR/USD from the currency pair list</li> <li>Set your order type to "Market" or "Limit", depending on your entry strategy</li> <li>Enter your base position size (0.1 lots)</li> <li>Set your stop-loss 50 pips below entry (for buy orders)</li> <li>Set your take-profit 100 pips above entry (2 to 1 risk to reward ratio)</li> <li>Utilise the platform's "Long Position" order feature to link these orders automatically</li> </ul> <p><img alt="Buy EURUSD Reverse Martingale Trade - ThinkMarkets" src="/getmedia/c7469f74-318b-423e-92b7-6023ec0fea1b/Academy-Forex-EURUSD-RM-Long-Position.png" /></p> <p style="text-align: center;">EURUSD Long Position, First Reverse Martingale Order</p> <h4>Step 5: Apply Your Position Sizing Strategy After Results</h4> <p>When your trade concludes:</p> <ul> <li>If profitable: Open ThinkMarkets' order ticket and double your position size to 0.2 lots for the next trade</li> <li>If loss occurs: Reset to your base 0.1 lot position size in the order ticket</li> <li>Use ThinkMarkets' position size calculator to verify that your risk percentage remains within acceptable limits</li> </ul> <h4>Step 6: Utilise ThinkMarkets' Automated Trade Management</h4> <p>As you progress through winning trades and larger positions:</p> <ul> <li>Implement ThinkTraders' partial close feature to secure profits on half your position when price moves 50% toward your target</li> <li>Apply trailing stops using the platform's automated trailing stop function</li> <li>Set price alerts to notify you of potential entry and exit points</li> </ul> <h4>Step 7: Optimise Using ThinkMarkets' Advanced Features</h4> <p>Fine-tune your Reverse Martingale implementation by:</p> <ul> <li>Backtesting your specific parameters using ThinkMarkets' Traders Gym</li> <li>Analysing performance metrics in the platform's trading analytics dashboard</li> <li>Setting up custom indicators that align with your Reverse Martingale entry criteria</li> </ul> <p><img alt="EURUSD Simulation, Reverse Martingale - ThinkMarkets Traders Gym" src="/getmedia/f190efcf-19ba-4c78-9497-b2cd1b93e590/Academy-Forex-Reverse-Martingale-EURUSD-Simulation.png" /></p> <p style="text-align: center;">EURUSD Reverse Martingale Simulation Panel</p> <h2>Conclusion</h2> <p>The Reverse Martingale strategy offers a trading approach to risk management, capitalising on winning streaks rather than trying to recover all previous losses with one trade. It is the opposite of the Martingale and may be more effective in trending following strategies. However, it carries even odds of losing hard-earned profits and increased exposure to market reversals, and traders have difficulties reducing positions after losses.</p> <p>Successful implementation requires discipline, emotional control, and a solid understanding of market dynamics. Traders must be vigilant against overconfidence and maintain strict compliance with predefined rules. While the strategy may offer potential for significant profits, it could lead to substantial losses, as a series of losses can quickly eradicate an account.</p> <p>Continuous education, practice, and adaptation to changing market conditions are essential for long-term success using the Reverse Martingale approach, despite it being assumed a less damaging investment strategy than Martingale.</p> <br /> <br /> <p id="image-footnote-1"><sub>1. This image is a recreation that first appeared on forexop</sub></p>
How to use the Ichimoku Cloud
<p>An increasing number of beginner traders wonder how to use the Ichimoku Cloud, drawn by the distinctive visuals and all-in-one nature of the technical indicator.</p> <p>The comprehensive Ichimoku Kinko Hyo Cloud integrates several components and requires a nuanced understanding to interpret correctly.</p> <p>Although it can be intimidating at first, understanding how the Ichimoku lines work together can help traders make trading decisions more easily and achieve greater consistency.</p> <p>This article is here to help traders gain a nuanced understanding of <a href="/en/trading-academy/technical-analysis/how-to-trade-markets/">how to use the Ichimoku Cloud to trade</a> forex pairs and other markets.</p> <p>Those with a burning desire to improve their trading strategies or quit juggling various indicators may consider the Ichimoku Cloud becoming a powerful technical trading tool in their arsenal.</p> <p>By the end, aspiring Ichimoku traders should be able to add the indicator to their MT4 or <a href="/en/trading-academy/tradingview/how-to-use-tradingview-charts/">TradingView price charts</a> and identify potential trading opportunities more easily than before.</p> <h2>What is the Ichimoku indicator?</h2> <p>The Ichimoku Cloud is a powerful <a href="/en/trading-academy/indicators-and-patterns/technical-indicators-beginners-guide/">technical indicator</a> originating from Japan that is used in forex trading and other financial markets.</p> <p>Developed and refined over decades before its release, it is renowned for its ability to encapsulate at a single glance multiple aspects of market dynamics, such as trends and support and resistance, into a visually intuitive chart.</p> <p>The Ichimoku Cloud translates to "one glance equilibrium chart" in Japanese.</p> <p>The all-in-one indicator forms a distinctive 'Cloud' shape, also known as Kumo Cloud, formed by the Senkou Span A-B area. The Cloud trading system incorporates five moving average variants for a holistic view of the market:</p> <ul> <li>Conversion Line (Tenkan Sen)</li> <li>Base Line (Kijun Sen)</li> <li>Leading Span A (Senkou Span A)</li> <li>Lagging Span B (Senkou Span B)</li> <li>Lagging Span (Chikou Span)</li> </ul> <p><img alt="Ichimoku Cloud ThinkMarkets" src="/getmedia/7e0b16b0-c9e5-4d54-9676-02ed3e781f4c/Academy-Tech-analysis-Ichimoku-Cloud.png" /></p> <p style="text-align: center;">The Ichimoku Cloud</p> <p>As a dynamic indicator consisting of multiple parts, trading Ichimoku can help traders identify sell or buy signals for both short-term and long-term trades. While it is popular for its effectiveness in trending markets, it has earned its reputation as a reliable tool for novice and experienced traders alike in various market conditions.</p> <h2>History of the Ichimoku Kinko Hyo Cloud</h2> <p><a href="/en/trading-academy/indicators-and-patterns/ichimoku-kinko-hyo-cloud-trading-indicator/">The Ichimoku indicator</a> was developed before World War II by Japanese journalist Goichi Hosoda. Dissatisfied with the limitations of traditional Japanese charts, Hosoda sought to create a trading system that could better help analyse market trends by incorporating multiple time frames and equilibrium points.</p> <p>After spending nearly 30 years refining the Ichimoku Cloud strategy, he introduced the Ichimoku Kinko Hyo original book to the world in 1968. The book quickly gained popularity in Japan and became a standard tool in many trading rooms.</p> <p>The Ichimoku kinko hyo system began to attract attention in the West in the 1990s, with key figures like Hidenobu Sasaki and David Linton helping to popularise it through books and teachings.</p> <p>Following its incorporation into trading software and platforms like MT4 and TradingView, the Ichimoku Cloud indicator remains a cornerstone of technical analysis today, particularly in <a href="/en/trading-academy/forex/what-is-forex-trading/">forex trading</a>.</p> <h2>How does Ichimoku Cloud work?</h2> <p>The Ichimoku indicator works by combining multiple moving average variants into a single, easy-to-read chart. Rather than focusing on just one or two averages for crossovers, it uses five lines that provide information on momentum, equilibrium, and even projected support and resistance. This offers any trader a view of past, present, and potential future price action.</p> <p>When these five lines are viewed together, they can reveal whether the price is in an uptrend or downtrend, where key support and resistance may lie, and even the balance of supply and demand.</p> <p>The Ichimoku Cloud settings are known as 9 26 52 26, where the Tenkan Sen is 9 periods, the Kijun Sen is 26 periods, the Senkou Span A is 26 periods, the Senkou Span B is 52 periods, and the Chikou Span is 26 periods (seen in the below TradingView chart - top to bottom).</p> <p><img alt="Ichimikou cloud default settings ThinkMarkets" src="/getmedia/734a8f72-20b3-47fe-a7c1-94b2adde191a/Academy-Tech-analysis-Ichimoku-Cloud-default-settings-TradingView.png" /></p> <p style="text-align: center;">Ichimoku Cloud default settings, TradingView</p> <p>Although originally derived from the Japanese trading calendar, the majority of Ichimoku strategies continue to utilise these settings to date because they have been rigorously tested over decades. Some traders may adjust them to suit different markets or trading styles. However, doing so may reduce the Ichimoku win rate due to widely accepted interpretations.</p> <h2>How to interpret Ichimoku Cloud</h2> <p>Designed to capture markets' equilibrium from three distinct time periods, the fast-acting line (the Tenkan-Sen) has a role in capturing near‐term momentum.</p> <p>As the Ichimoku components work together, a slower, more stable line (the Kijun-Sen) outlines the medium-term trend and acts as a dynamic benchmark for support or resistance.</p> <p>Two forward‐projected lines (Senkou Span A and Senkou Span B) form the Kumo Cloud, which forecasts future price movement and provides a picture of the trend’s duration.</p> <p>Complementing these, a backwards-looking line (the Chikou Span) traces the current price into the past, providing retrospective confirmation of trend strength.</p> <p>The table below summarises each component’s period, trend duration focus, and primary role.</p> <p><img alt="How to interpret Ichimoku Cloud" src="/getmedia/28e99a34-7eef-4ccc-b8ac-d962fefea6c4/Academy-Ichimoku-cloud-Reverse-Martignale-vs-Clasic-Martingale-table.png" /></p> <h2>Ichimoku Cloud explained</h2> <h3>Tenkan-Sen: The Conversion Line</h3> <p>The Conversion Line, or Tenkan-Sen, is a short-term moving average that represents the midpoint of the highest high and lowest low over the past 9 periods to help identify short-term trends and potential reversal points. This construction gives it a dual role: it reacts quickly to short‐term price extremes while also identifying early signs of momentum shifts.</p> <p>When the price is above the Tenkan-Sen, it indicates a potential bullish trend, while a cross below suggests a bearish trend. The steeper the angle, the stronger the momentum. On the other hand, a flat Tenkan-Sen indicates a trendless condition over the last 9 periods.</p> <h3>Kijun-Sen: The Base Line</h3> <p>The Base Line, or Kijun-Sen, is a longer-term moving average that provides a broader view of market trends as it is calculated by averaging the highest high and lowest low over the past 26 periods. It is more reliable for medium-term price equilibrium due to the longer time period than the Tenkan-Sen and can be used to confirm shorter-term trends identified by the shorter-term line.</p> <p>When the price crosses above the Kijun-Sen, it indicates a potential bullish trend, while a cross below suggests a bearish trend. However, the price will often oscillate around the Kijun-Sen, with rebounds towards it underscoring its role as a gravitational “anchor.”</p> <h3>Senkou Span A: Leading Span A</h3> <p>Leading Span A, or Senkou Span A, is calculated by averaging the Kijun-Sen and Tenkan-Sen and plotting it 26 periods into the future. This forward shift represents potential future support and resistance levels ahead of current price action at a dynamic level, forming the upper cloud boundary of Kumo.</p> <p>Senkou Span A is useful for identifying areas where the trend may continue or a potential trend reversal may occur. When the price is above the Senkou Span A line, it implies a bullish trend, while a price below indicates a bearish trend. When it is combined with Senkou Span B, it helps reveal a forward-looking equilibrium.</p> <h3>Senkou Span B: Leading Span B</h3> <p>Leading Span B, or Senkou Span B, is calculated using the average of the highest high and lowest low of the past 52 periods and producing the line 26 periods into the future. Because it reflects a much longer historical range, Senkou Span B tends to move more slowly. This Ichimoku component provides a broader view of near-term market extremes at a dynamic level, forming the lower Cloud border.</p> <p>Span B is useful for identifying areas where the trend may continue or reverse. When the price is above Leading Span B, it indicates a bullish trend, while a price below suggests a bearish trend.</p> <h3>Chikou Span: The Lagging Span</h3> <p>The Lagging Span, or Chikou Span, represents the current price at the bar close plotted 26 periods behind, effectively offering a confirmation of current market sentiment. This line helps confirm price action, potential bearish and bullish trend reversal points and trend direction and strength.</p> <p>The Chikou Span is a unique component of the Ichimoku Cloud, providing a historical perspective on the current price action and allowing traders to see whether current price moves are in line with the longer-term trend. It sits at the left, backwards-looking side of the Ichimoku Kinko Hyo chart.</p> <p>When the Chikou Span rests above the past price action, it reinforces bullish momentum, while a lag below historical prices confirms bearish conditions.</p> <h3>Kumo Cloud</h3> <p>The Ichimoku Kumo Cloud is the area between Senkou Span A and B. It provides a multidimensional view of dynamic support and resistance levels and helps identify trend direction.</p> <p>In a generic interpretation, when the price is above the Kumo Cloud, it indicates a bullish trend, while a price below suggests a bearish trend. However, when the two leading spans change their relative positions (one crosses the other), it signals potential shifts in market sentiment and trend reversals. This event is known as the Kumo Twist.</p> <p>The thickness of the cloud and even its colour (often changed automatically based on which Span is on top, from green cloud to red cloud and vice versa) can help measure the strength of the reverting or prevailing trend.</p> <p>For context, after a Kumo Twist, the Cloud is usually thin because it is in the early stages of forming a new dynamic support and resistance region. This suggests a weak or consolidating trend that may still be predisposed to reversals or breakouts. On the other hand, a thick, or thickening, ongoing Kumo tends to act as a strong activation barrier, making cloud breakouts more difficult.</p> <p><img alt="Ichimoku Cloud Uptrend Downtrend ThinkMarkes" src="/getmedia/551a18b9-8c7d-4a68-a989-23b5b3f2b23a/Academy-Tech-analysis-Ichimoku-Cloud-bullish-trend-and-bearish-trend.png" /></p> <p style="text-align: center;">Ichimoku Cloud bullish trend and bearish trend</p> <h2>Ichimoku Cloud trading signals</h2> <p>The Ichimoku Cloud is a technical tool that provides several trading signals derived from its several components, as explained above. Each plays a part in generating potential buy or sell signals.</p> <p><img alt="Ichimoku Cloud trading signals" src="/getmedia/4d011018-d708-400e-9496-8e05b78aa8ae/Academy-Ichimoku-cloud-Reverse-Martignale-vs-Clasic-Martingale-table2.png" /></p> <h2>How to use the Ichimoku indicator for advanced traders</h2> <p>The primary uses of the Ichimoku components are to provide a snapshot of how strong a trend is and to flag potential reversals through its multi‐component interplay. However, since the entire system depends on how price moves, affecting each line, advanced Ichimoku traders can use the trading indicator in other ways to gain additional insights.</p> <h3>Identifying false signals with Ichimoku</h3> <p>While the Ichimoku Cloud is a powerful tool, it can also generate false signals. To identify false signals, traders may look for:</p> <ul> <li><strong>Momentum:</strong> A valid bullish signal typically shows a price close well above the Kumo Cloud and a bearish signal well below it. The bullish signal may be false if the Ichimoku setup is upward, but the price flatlines near the cloud.</li> <li><strong>Precedence:</strong> A strong trend usually sees the fast Tenkan‐Sen above the slower Kijun‐Sen for bullish markets or the opposite for bearish. A simple yet effective Chikou Span strategy is to confirm the trend sits on the “correct” side of historical price action.</li> <li><strong>Consistency:</strong> A valid trading signal on a shorter timeframe (e.g., a 1‑hour chart) should be supported by the overall direction seen on a higher timeframe (e.g., a 4-hour or daily chart). Discrepancies suggest a short‐term fluctuation, not a new trend.</li> </ul> <p>False signals are a common challenge in trading Ichimoku, and using complementary <a href="/en/trading-academy/technical-analysis/what-is-technical-analysis-in-trading/">technical analysis</a> tools can help traders distinguish between genuine trading signals and market noise. After all, a truly valid signal is accompanied by harmony among its components and others'.</p> <h3>Trading Ichimoku Cloud with other indicators</h3> <p>Incorporating indicators like RSI, MACD, and Bollinger Bands in an Ichimoku Cloud trading strategy can help improve accuracy and reliability. Trading the Ichimoku Cloud with other indicators can provide additional layers of confirmation and may improve overall trading performance.</p> <p>Below are three popular combinations for Ichimoku Cloud trading.</p> <h4>How to use the Ichimoku Cloud with RSI</h4> <p>The Ichimoku RSI strategy can help confirm the strength of trends indicated when trading the Ichimoku Cloud. When the price is trading well above the Cloud, and key Ichimoku lines Tenkan Sen and Kijun Sen are supportive, an RSI cross above the 50 key level signals a stronger indication of entering a long position.</p> <p><img alt="Ichimoku RSI Strategy ThinkMarkets" src="/getmedia/b38e6844-faa4-42c1-8531-e8dd72fd1f9e/Academy-Tech-analysis-Ichimoku-Cloud-with-RSI.png" /></p> <p style="text-align: center;">Ichimoku Cloud with RSI</p> <h4>How to use Ichimoku Cloud and MACD</h4> <p>The Ichimoku and MACD strategy can help confirm the continuation of trends and potential reversal points when the MACD starts to diverge from the Ichimoku signals. Pairing Ichimoku with the MACD reinforces a bullish trend when the MACD line crosses above its signal line at or just before a confirmed bullish Ichimoku setup.</p> <h4>How does Ichimoku Cloud work with Bollinger Bands</h4> <p>The Ichimoku Bollinger Bands strategy can be used to gauge market volatility and identify potential breakouts when the price is above the Cloud or below. For example, when the price breaks above the upper Bollinger Band while trading above the Cloud, it indicates a breakout less likely to fail. However, incorporating the Bands onto the same chart could clutter the trader's view, with many traders choosing separate sub-charts.</p> <h3>Determining entry and exit points with Ichimoku Cloud</h3> <p>The Ichimoku Cloud can help determine optimal entry and exit points for both crossover and breakout signals. Breakout entries are particularly powerful when a period of consolidation ends, often signalled by a wider Kumo Cloud.</p> <h4>How to use the Ichimoku Cloud for entries</h4> <p>For bullish trades, one of the Ichimoku strategies is to enter a long position when the price crosses above the Tenkan Kijun lines, ideally in conjunction with a bullish crossover and a breakout above the Cloud.</p> <p>For bearish trades, a sell signal is reinforced when the price falls below both lines. The Tenkan-Sen crosses below the Kijun-Sen line, and the price is below the Cloud.</p> <p>The Tenkan Sen Kijun Sen strategy is the easiest and <a href="/en/trading-academy/forex/popular-forex-trading-strategies/">most popular</a> to comprehend, mirroring moving average crossovers.</p> <h4>Ichimoku Strategy for exiting positions</h4> <p>For exits, the Cloud acts as a dynamic support or resistance depending on the direction of the trade.</p> <p>In a long position, if the price starts to pull back towards the lower edge of the cloud or a bearish crossover occurs, it may signal a weakness in price momentum, prompting an exit.</p> <p>Similarly, in a short position, as the price approaches the upper boundary of the Cloud or a bullish crossover develops, calls for an exit.</p> <h3>Managing Cloud trading risk with Ichimoku</h3> <p>Trading Ichimoku Kinko Hyo Cloud requires managing risk, and many Ichimoku strategies are used to help <a href="/en/trading-academy/forex/position-sizing-guide/">calibrate stop-losses and profit-take targets</a>.</p> <p>For example, a stop-loss for a bullish trade could be placed below the lower boundary of the Cloud, while a take-profit would be set at the Senkou Span A or B, assuming these lines have historically acted as a level of resistance.</p> <p>Many Ichimoku strategies involve the Cloud. A thick cloud plays a key role here as a well-established support or resistance area is less likely to be penetrated, providing traders with more confidence to remain in the market. Conversely, a thin cloud suggests weakness, calling for more conservative positioning, a tighter stop-loss and a shorter profit-take target. Given the reduced risk-reward ratio, narrow clouds are best left without a trade unless using a consolidation trading strategy.</p> <p>To refine risk management, one can also use an average crossover strategy of Ichimoku lines as confirmation signals. For example, a bullish Tenkan-Sen and Kijun-Sen crossover when prices are well above a thick Kumo Cloud supports a strong uptrend and may justify moving the protective stop-loss closer to the entry to secure a profit. On the other hand, a crossover when the two cloud boundaries are thin may signal a faltering trend, suggesting tighter risk parameters and an early exit.</p> <h2>How to use Ichimoku Cloud for day trading with volumes</h2> <p>Day trading with the Ichimoku Cloud involves identifying short-term trends and potential entry and exit points within a single trading day to capture intraday volatility.</p> <p>By combining volume and Ichimoku Cloud analysis, day traders can leverage the Ichimoku Cloud for trend identification and potential breakout zones, as volume confirms the strength and validity of the Ichimoku signals.</p> <p>Here's a step-by-step example of a day trading breakout strategy based on the Ichimoku and volumes on the 1H chart:</p> <ul> <li><strong>Analyse the main trend:</strong> Start by analysing the overall trend on the 4-hour and daily charts. The Ichimoku indicates a trend above or below the Cloud while increasing volumes support it. All timeframes must point in the same direction.</li> <li><strong>Identify the 1-hour trend:</strong> Look for the price to be above the Kumo Cloud and the Tenkan-Sen line to be above the Kijun-Sen for a bullish trend or below the Cloud for a bearish trend.</li> <li><strong>Confirm the 1-hour trend:</strong> Ensure the Chikou Span is above the Cloud for additional confirmation of bullish momentum or below the price for a bearish trend.</li> <li><strong>Confirm breakout with volume:</strong> Look for significant volume spikes during price breakouts above or below the Kumo Cloud to validate the signal. Price closes above or below the Cloud with high volumes indicate a strong up- or downward trend.</li> <li><strong>Consider a position:</strong> Consider entering a long position when the price crosses above the Cloud with high volume. The Tenkan-Sen is also above the Kijun-Sen line, and the Chikou Span is above the Cloud. The opposite setup is valid for shorts in a bearish breakout scenario.</li> <li><strong>Set stop-loss and take-profit:</strong> Consider placing a stop-loss below the Kumo Cloud and a take-profit when prices revert below or above the Kijun-Sen or within the Cloud. Fully exit the trade if the price crosses Kumo in the opposite direction or if volume starts to decline and then increases in the opposite direction. Trades also combine Ichimoku with Fibonacci to evaluate take-profit levels.</li> </ul> <p><img alt="Ichimoku Cloud Day Strategy ThinkMarkets" src="/getmedia/c5651444-8d72-4853-a89c-4a8d86e78e71/Academy-Tech-analysis-Ichimoku-and-volumes-day-trading-strategy.png" /></p> <p style="text-align: center;">Ichimoku and volumes day trading strategy</p> <h2>Ichimoku tips</h2> <p>Ichimoku isn’t just a set of lines; it’s a complete set or Ichimoku components featuring an integrated equilibrium chart that offers a clear view of trend, support and resistance “at a glance.” Learning is all about understanding the bigger picture.</p> <p>Here are some tips and tricks to understanding the Ichimoku:</p> <ul> <li>Familiarise with its five lines at the time-tested standard 9 26 52 settings</li> <li>Pay attention to how the price relates to the Kumo cloud; does it confirm or invalidate the prevailing trend?</li> <li>Anticipate Tenkan-Singou crossovers as they can indicate early entries or warning signs, especially when confirmed by the position of the Chikou Span.</li> <li>Observe the cloud’s thickness; thinner clouds suggest impending breakouts.</li> <li>Embrace multiple time frame analyses, back-testing and other indicators for improved cloud trading strategies.</li> </ul> <p>In short, keep it simple, practice regularly, and let the visual clarity of Ichimoku guide you to informed trading decisions.</p> <h2>Conclusion</h2> <p>The Ichimoku Cloud is a comprehensive indicator and technical analysis tool that provides valuable insights into market trends, support and resistance levels, and potential entry and exit points. By understanding how to use the Ichimoku Cloud components or how to combine them effectively, traders can make more informed decisions and optimise their trading strategies. The Ichimoku Cloud is a technical analysis indicator valuable to the trading arsenal of both a beginner and intermediate trader.</p>

Aroon Indicator: Basics, Formula, Settings, Usage, Strategy & Comparison
<p>The Aroon indicator is a tool in technical analysis that helps traders identify the strength and potential reversal of a market trend. Developed by Tushar Chande in 1995, the indicator consists of two separate lines, Aroon Up and Aroon Down. The two lines represent the number of periods since the highest and lowest prices occurred during a specific timeframe.</p> <p>The indicator can help traders identify if a trend is beginning, gaining momentum, or ending. You can use the Aroon indicator to make better-informed decisions about when you will enter or exit your trades.</p> <p>In this article, you will learn the Aroon indicator, its formula, its settings, how to use it, and how to apply it in different timeframes. You will also learn about various Aroon indicator trading strategies. We’ll compare the Aroon indicator to the ADX and delve into the indicator’s pros and cons.</p> <h2>What is the Aroon indicator?</h2> <p>The Aroon indicator aids traders in identifying if a market is trending and gauging the strength of the trend. Analysing the two lines of the indicator can offer insights into whether the price will continue its current trajectory or if a shift is imminent.</p> <h4>Definition and basic concept</h4> <p>The Aroon indicator evaluates time rather than price. It computes the days since the price reached its lowest and highest points within a specific timeframe, typically 14 days. When the Aroon Up line is close to 100, it indicates that the price has recently hit a new 14-day high, suggesting that a strong uptrend is in place.</p> <p>When the Aroon Down line is close to 100, it indicates that the price has recently hit a new 14-day low, suggesting that a strong downtrend is in place. When both lines converge towards the middle of the range, it indicates that the market is trading sideways.</p> <p><img alt="The Aroon indicator on a price chart" src="/getmedia/6330ffe3-78c1-4673-bcfe-650e4fb8db0e/Academy-Forex-The-Aroon-indicator-on-a-price-chart.png" /></p> <h4>Historical development and usage developed by Tushar Chande</h4> <p>Tushar Chande created the Aroon indicator in 1995. "Aroon" is a Sanskrit word interpreted as "dawn's early light," which describes the indicator's primary goal of highlighting a new trend's beginning. Traders have applied the Aroon indicator to identify early signs of a market's direction and strength. The indicator is popular among stock traders but can be used in other markets, such as commodities and forex trading, to identify trends.</p> <h3>Aroon indicator formula</h3> <p>The Aroon indicators utilise two formulas, one for each line: the Aroon Up and Aroon Down lines.</p> <ul> <li><strong>Aroon Up =</strong> [(Number of periods - Number of periods since the highest high) / Number of periods] x 100</li> <li><strong>Aroon Down =</strong> [(Number of periods - Number of periods since the lowest low) / Number of periods] x 100</li> </ul> <h4>Detailed breakdown of the formula</h4> <ul> <li><strong>Number of periods:</strong> This is the total number of days or periods being considered, usually 14-days/periods.</li> <li><strong>Number of periods since the highest high:</strong> This shows the days elapsed since the market achieved its peak price during the chosen timeframe.</li> <li><strong>Number of periods since the lowest low:</strong> It indicates the total days elapsed since the market reached its lowest point during the specified timeframe.</li> <li><strong>Divide by the number of periods and multiply by 100:</strong> This step converts the calculation into a percentage, making it easier to compare.</li> </ul> <h4>Explanation of components</h4> <p><strong>Aroon Up:</strong> This line tracks how long it has taken since the price reached its highest level, known as the Aroon up value. A robust uptrend could be ongoing if the line has a high value near 100.</p> <p><strong>Aroon Down:</strong> This line records the time since the price reached its lowest low. A robust downtrend could be underway if the line has a high value near 100.</p> <p><strong>Crossovers:</strong> When the Aroon up line moves above the Aroon down line, it could signal that a possible upward trend is starting. When the Aroon down line crosses above the Aroon up line, it indicates that a downward trend could be beginning.</p> <p><img alt="Aroon indicator crossovers" src="/getmedia/bce73cd9-c26b-4007-9661-89088671e5e6/Academy-Forex-Aroon-indicator-crossovers.png" /></p> <h3>Aroon indicator settings</h3> <p>The Aroon indicator settings are crucial since they control how sensitive the indicator will be to price movements. The primary setting is the "lookback period," which refers to the number of periods or days the indicator uses to identify when the price was at its lowest or highest.</p> <h4>Standard settings for the Aroon indicator</h4> <p>The default setting for the Aroon indicator is the 14-period lookback, which traders most frequently use. This lookback period implies that the indicator will count the days since the lowest and highest prices were reached in the last 14 periods. This setting is popular among traders since it offers a balance between sensitivity to new trends while avoiding reacting to every slight fluctuation in the market.</p> <p><img alt="Aroon Up and Down lines" src="/getmedia/cc2ad013-bf57-4d03-a68c-907b6a81a6ef/Academy-Forex-Aroon-Up-and-Down-lines.png" /></p> <h3>Best settings for Aroon indicator on MT4</h3> <p>Your trading timeframe will determine the best Aroon indicator settings on the <a href="/en/metatrader4/">MetaTrader 4 (MT4)</a> platform. You could use shorter periods, such as 7 if you are scalping or day trading, to ensure the indicator is highly responsive to market prices. If you are trading the longer timeframes like you would in swing and position trading, you could lengthen the lookback period to 25 to eliminate minor price fluctuations.</p> <p><img alt="The Aroon indicator on an MT4 price chart" src="/getmedia/32e8f7d6-b32d-4c2b-bc2b-74ad43006347/Academy-Forex-The-Aroon-indicator-on-an-MT4-price-chart.png" /></p> <h4>Case studies and examples</h4> <p><strong>Example 1: Short-term trading</strong></p> <p>Picture a day trader utilising the Aroon indicator with a 7-day (period) timeframe on a 15-minute chart. If the Aroon down crosses over the Aroon up and remains below 70, it could suggest a significant downward trend, making the trader consider selling. Setting a tight stop-loss to manage risk is essential with shorter timeframes, as the number of false signals could increase.</p> <p><img alt="Aroon indicator trade signal on USDJPY 15-minute chart" src="/getmedia/287f59aa-d24f-4f73-8730-6f22cc8b68b0/Academy-Forex-Aroon-indicator-trade-signal-on-USDJPY-15-minute-chart.png" /></p> <p><strong>Example 2: Long-term trading</strong></p> <p>A swing trader utilising the 25-period timeframe on a daily chart observes the Aroon up being overtaken by the Aroon down, which then hits the 90 level. This indicates that a robust downward trend is underway. The trader could sell or short-sell, placing a wider stop-loss to account for market fluctuations and targeting a long-term profit goal.</p> <p><img alt="Aroon indicator trade signal on EURUSD daily chart with extended period" src="/getmedia/c6578aa0-51d9-4ab3-810a-4d682ec23b2a/Academy-Forex-Aroon-indicator-trade-signal-on-EURUSD-daily-chart-with-extended-period.png" /></p> <p>By adjusting the settings based on your trading goals and market conditions, you can make the Aroon indicator a more effective tool in your trading toolkit.</p> <h2>Master trading with the Aroon indicator</h2> <p>You can master trading with the Aroon indicator by <a href="/en/account-types/">opening a trading account with ThinkMarkets</a>. You will get access to over 4,000 assets including over 45 currency pairs and over 3,000 global stocks and indices. You will also have access to three cutting-edge trading platforms: <a href="/en/metatrader4/">MetaTrader 4</a>, <a href="/en/metatrader5/">MetaTrader 5</a>, and <a href="/en/thinktrader/">ThinkTrader</a>.</p> <h2>How to use the Aroon oscillator</h2> <p>The Aroon oscillator, a separate trend-following indicator derived from Aroon Up and Down, assesses the strength of current trends and potential reversals. It generates trade signals through its relationship with the Aroon up and Aroon down lines, highlighting specific conditions for identifying uptrends and downtrends.</p> <h3>Step-by-step guide on applying the Aroon indicator</h3> <p><strong>Add the Aroon indicator to your chart:</strong> The Aroon indicator is built into many trading platforms, such as MetaTrader 4, and can be found under the indicator’s list. You can find it there and add it to the chart.</p> <p><img alt="Aroon indicator setup on an MT4 chart" src="/getmedia/6ce137a1-164f-4a3b-9a73-5e8bc591a4be/Academy-Forex-Aroon-indicator-setup-on-an-MT4-chart.png" /></p> <p><strong>Set the period:</strong> While the default setting is 14 periods, you can change it based on your trading style. However, beginner traders should go with the standard settings.</p> <p><strong>Monitor the Aroon indicator line:</strong> The Aroon up line suggests that a robust bullish trend is underway if it is above 70, while the Aroon down line indicates a strong downtrend above 70. The Aroon indicator line helps determine trend stages and price movements, signalling potential trend changes and market consolidation phases.</p> <p><strong>Look for crossovers:</strong> If the Aroon up indicator line moves above the Aroon down indicator line, it signals that an uptrend might begin. If the Aroon down line crosses above the Aroon up line, it suggests that a downtrend could be starting.</p> <h3>Practical tips for beginners and advanced traders</h3> <p><strong>Beginners:</strong> As a beginner, you should use the indicator with the default 14-period setting and apply it on a daily chart. This will help you understand how the indicator works. You can also combine it with other indicators, such as the relative strength index (RSI), to confirm the trade signals.</p> <p><strong>Advanced traders:</strong> Based on your trading strategy, you can test the indicator on multiple periods and timeframes, such as the 5-minute or 1-hour chart. You can apply the Aroon indicator with other technical analysis tools, such as trend lines and support and resistance levels, to make your market analysis more accurate.</p> <h3>Practical application in market analysis</h3> <p>You can use the Aroon indicator to verify the current trend’s strength or to pinpoint possible trend reversals. For instance, if the Aroon up and down lines are both near 50, this could signal the lack of a trend as the price moves sideways.</p> <p>By analysing a price chart, traders can use the Aroon indicator to interpret various price movements and trend signals. For example, examining the XAUUSD or Brent oil price charts can help traders understand how the Aroon indicator reflects market trends.</p> <p><img alt="Analysing the Aroon indicator on a price chart" src="/getmedia/de155e63-7271-491f-bbc0-4cb30281127b/Academy-Forex-Analysing-the-Aroon-indicator-on-a-price-chart-1.png" /></p> <p>You should constantly monitor the two Aroon lines for crossovers, which tend to signal a change in the trend direction.</p> <h3>Specifics of the 14-period Aroon indicator</h3> <p>The 14 period Aroon offers a well-rounded setting that balances sensitivity and dependability effectively. It indicates how recently the market reached a peak or a bottom in the last 14 periods (days, hours, etc.). This setting is well-liked as it identifies medium-range patterns without being too reactive to market fluctuations.</p> <h3>Adjustments for the 5-minute Aroon indicator in short-term trading.</h3> <p>To engage in short-term trading on a 5-minute chart, lower the Aroon period to either 7 or 10. This increases the indicator's responsiveness to rapid market fluctuations. Nevertheless, remember that shorter time frames may result in increased false signals. Therefore, combining the Aroon indicator with additional tools like momentum indicators or volume analysis to validate trends is advisable.</p> <p><img alt="The Aroon indicator working on a 5-minute chart with a 7 period" src="/getmedia/6d1ebb41-30d9-43c2-8cf0-94afb9e4800e/Academy-Forex-The-Aroon-indicator-working-on-a-5-minute-chart-with-a-7-period.png" /></p> <h2>Aroon indicator strategy</h2> <p>The Aroon indicator is a powerful trading tool that can be used to develop trading strategies, especially by identifying trends and possible reversals.</p> <h3>Developing trading strategies with the Aroon indicator</h3> <p><strong>Trend confirmation:</strong> You can utilise the Aroon indicator to verify a trend's direction. If the Aroon up line is greater than 70, it implies a robust upward trend; similarly, a reading above 70 for the Aroon down line signifies a powerful downward trend.</p> <p><strong>Trade entry and exit points</strong>: You can identify trade entry and exit points by observing crossovers where the Aroon up line crosses the Aroon down line or vice versa. These intersections can act as possible signals for entering or exiting trades.</p> <p><strong>Ranging markets:</strong> If both lines converge towards the centre and fluctuate within that range, it could signal the absence of a distinct trend. This may indicate a good opportunity to avoid the markets or implement range-bound strategies.</p> <h3>Integration with other technical analysis tools</h3> <p>To enhance the Aroon indicator's accuracy, you can combine it with other technical indicators, such as moving averages, the relative strength index (RSI) and the average directional index (ADX). For instance, utilising the Aroon combined with the RSI can help verify whether a trend will continue or reverse.</p> <h2>Aroon indicator and RSI above 70</h2> <p>An RSI above 70 suggests an asset could be overbought because its price has increased excessively and rapidly. This frequently indicates a possible pullback or change in direction. If the Aroon up is elevated and the RSI surpasses 70, it may signal a robust uptrend, yet a correction might be looming.</p> <h3>Interpretation of Aroon with RSI values above 70</h3> <p>When both the Aroon up and RSI are above 70, it could suggest a robust upward trend that might be stretched too far. Traders may want to prepare for a potential change in direction or wait for a signal, like a crossover on the Aroon or a decrease in the RSI, before taking trades.</p> <p><img alt="The Aroon indicator and the RSI on a price chart" src="/getmedia/43ba2303-d91e-4454-b0b0-c019c47b5910/Academy-Forex-The-Aroon-indicator-and-the-RSI-on-a-price-chart.png" /></p> <h3>Strategic implications and warnings</h3> <p><strong>Implications:</strong> Exercise caution when the Aroon and RSI indicate overbought or oversold conditions before entering new positions in the current trend. Search for indications of a change in direction.</p> <p><strong>Warnings:</strong> Avoid depending only on one signal. Market conditions may rapidly shift. So, using various indicators or price action signals to validate your strategy is best.</p> <h2>Aroon indicator vs. ADX</h2> <p>The Aroon indicator and average directional index (ADX) both assist in determining trend strength, although they have distinct characteristics.</p> <h3>Comparative analysis with average directional index (ADX)</h3> <p><strong>Aroon indicator:</strong> Evaluates the recency of high or low points over a predefined timeframe, offering information on trend strength and direction. The stages that indicate the emergence of a new trend are identified using the Aroon indicator system, mainly through the crossing signals between the Aroon up and Aroon down lines, demonstrating a greater frequency of new highs compared to new lows.</p> <p><strong>ADX:</strong> It only evaluates the intensity of a trend, not its direction. A high ADX value indicates a robust trend, regardless of whether it’s moving up or down, while a low ADX value suggests a weak or sideways trend.</p> <p><img alt="The Aroon and ADX indicators on a price chart" src="/getmedia/685b91ea-d955-4374-aa7a-74c09c8eaefe/Academy-Forex-The-Aroon-and-ADX-indicators-on-a-price-chart.png" /></p> <h3>When to use Aroon over ADX and vice versa</h3> <p><strong>Use Aroon when:</strong> you need to determine the trend's direction and intensity. The Aroon indicator effectively identifies changes in trends at an early stage.</p> <p><strong>Use ADX when:</strong> in situations where you need to gauge the strength of a prevailing trend, regardless of its direction. The ADX measures the strength of a trend, regardless of whether it is upward or downward.</p> <h2>Pros and cons of the Aroon indicator</h2> <p><strong>Pros of the Aroon indicator</strong></p> <ul> <li>Easy to interpret, especially for spotting trends and potential reversals.</li> <li>Can identify both trend direction and strength.</li> <li>Effective in trending markets.</li> </ul> <p><strong>Cons of the Aroon indicator</strong></p> <ul> <li>It can produce false signals in choppy or sideways markets.</li> <li>It may need to be combined with other indicators for better accuracy.</li> <li>Less effective in very volatile or fast-moving markets.</li> </ul> <h2>Conclusion</h2> <p>The Aroon indicator is like a compass for traders, helping you confidently navigate the market's ups and downs. Understanding how this tool works lets you spot new trends early, know when they might end, and make better-informed trading decisions. Whether you're just starting or have some experience, the Aroon indicator offers a straightforward way to analyse price movements and strengthen your strategy. Remember, it's most effective when used alongside other tools, so keep experimenting, learning, and fine-tuning your approach to find what works best for you.</p>
What affects forex exchange rates?
<p>Financial markets' moves are difficult to predict. However, your chances of success are much higher when you understand how the markets work and what exactly affects the prices of financial instruments. Understanding these details can help you plan your trades strategically instead of randomly guessing your next step and hoping for good luck.<br /> <br /> When it comes to predicting currency exchange rates, it's important to understand that forex, like all financial markets, is heavily influenced by supply and demand. A decreasing supply paired with an increasing demand usually leads to rising prices. Similarly, an increased supply with decreased demand drives the prices down.<br /> <br /> Factors affecting supply and demand and, therefore, the exchange rate movements of every currency pair can vary depending on the main pillars of each country's economy. For example, Australian and Canadian economies rely on natural resources export, which affects the exchange rate of the Australian and Canadian dollar (AUD and CAD) against other currencies. On the other hand, the United Kingdom and the pound (GBP) are more sensitive to political developments and interest rate movements.<br /> <br /> Despite these differences, trading experts have identified the common factors affecting supply and demand on forex.<br /> <br /> <img alt="" src="/getmedia/f3d6d0f9-9b0d-468f-8431-0d3ee0757d1d/article-forex-what-affects-forex-rates.webp" /></p> <h2>Main factors affecting foreign exchange rates</h2> <h3>International trade</h3> <p>Trading activities between different countries directly affect the value of their currencies. When a country exports some goods, in many cases, a buyer pays for the products in the exporter's local currency. If a country's exports are higher than its imports, it creates a high demand for its currency and, as a result, increases its value.<br /> <br /> The amount of exports and imports of every country, in turn, depends on the country's needs and production structure. For example, the US and Brazil are long-term trading partners. Let's assume the US has been importing coffee from Brazil for USD 2 per kg, but suddenly Colombia offered a price of USD 1 per kg. If the US, one of the largest coffee importers, were to go for Colombian coffee instead of Brazilian because of more attractive import prices, it would decrease Brazilian exports significantly. As a result, the demand for the Brazilian real (BRL) and its exchange rate against a foreign currency, USD in this case, would also decline. At the same time, favourable export prices would increase demand for the Colombian peso (COP), strengthening it against USD.<br /> <br /> Some specific countries, like Australia and New Zealand depend strongly on exports, and there is a high correlation between the price of what they export and their currency. However, for most other large economies, the state of their trade balance has minimal impact on the currency exchange rate. This was not the case 30 or 40 years ago when capital restrictions limited capital flow. </p> <h3>Inflation</h3> <p paraeid="{94c33f92-f774-48ac-9997-dda5c9bbd5a4}{50}" paraid="2063613172">Inflation means a rise in prices of goods over time that leads to the decreasing purchasing power of a country's currency. For example. if inflation in the UK increases by 10% over a year, that means that the British Pound has dropped 10% in value compared to the year earlier. In terms of exchange rates, if inflation is at 2% in the USA, then the GBP/USD exchange rate should depreciate by 8% in favour of the US Dollar to compensate for the difference in inflation between the two countries. </p> <p paraeid="{94c33f92-f774-48ac-9997-dda5c9bbd5a4}{138}" paraid="1186889332">To track inflation rate changes, traders usually keep an eye on the Consumer Price Index (CPI) reports. Most countries release these reports monthly, except in Australia and New Zealand, which publish them quarterly. CPI is a widely considered measure of inflation because it tracks the percentage change in the price of a basket of goods commonly purchased by consumers. </p> <h3>Interest rates</h3> <p>High interest rates attract foreign capital to a country, promising foreign investors higher returns on their capital. With more investors entering the country's local market, the demand for its currency increases, driving its value higher. On the flip side, low interest rates make a country less attractive for foreign investment.<br /> <br /> Interest rates and inflation are directly correlated – growing inflation is usually followed by increasing interest rates as governments are trying to battle currency depreciation. This, in turn, strengthens the currency and affects exchange rates.<br /> <br /> In 2022 trading world witnessed a clear example of this process when the US Federal Reserve announced the sharpest interest rate hike since the 1980s, which resulted in the almost immediate US dollar strengthening while other currencies traded against it crashed.<br /> <br /> Experienced traders usually keep an eye on central banks’ interest rate decisions to find trading opportunities.</p> <h3>Economic indicators and political stability</h3> <p>Besides inflation and interest rates, it's worth watching Gross Domestic Product (GDP), which provides a snapshot of the economic conditions of a country, the balance of payments, government debt, the unemployment rate and other factors. All of them influence the country's currency value in one way or another. Traders are able to see a schedule of these releases in the economic calendar, which is a very popular tool for identifying potential trading opportunities.<br /> <br /> The number of different reports to check can get a little overwhelming for a new trader, but the good news is you don't have to check them all at once. Beginners tend to stick to the most important and self-explanatory ones. For example, GDP is the ultimate indicator of the economic health of any country. Fast GDP growth usually implies a strong economy and high demand for its currency, which in turn drives its price up.<br /> <br /> The political environment of a country also has a significant influence on its currency exchange rate. Similar to the low interest rates, political turmoil makes a country less appealing for foreign capital, resulting in a declining exchange rate of its currency.<br /> <br /> Both economic figures and political updates are usually heavily covered in the news, making news trading the most attractive trading strategy for beginners.<br /> <br /> Once you get more comfortable with the basic figures we discussed above, you can move on to an in-depth analysis of multiple numbers suggesting changes in exchange rates. Keep in mind that any of the factors mentioned above can rarely influence price movements on their own. A comprehensive approach requires comparing a few numbers and drawing a general conclusion based on your findings.</p> <h3>Market sentiment</h3> <p>In anticipation of a currency's rise or fall, many traders start buying or selling a currency before it changes its value. This, in turn, increases its demand or supply, resulting in price swings triggered solely by traders' activity. This factor is usually hard to predict as it depends only on the human factor and traders' perception of the upcoming events.<br /> <br /> This is where technical analysis with chart patterns and indicators come into play, which we will discuss in detail in our <a href="/en/trading-academy/what-is-technical-analysis-in-trading">Technical analysis in trading</a> blog.<br /> <br /> Before you dive deeper into analysing forex, it may be a good idea to practice your newly obtained knowledge on a <a href="/en/demo-account">risk-free demo account</a>. Our proprietary, award-winning trading platform ThinkTrader, for example, offers dozens of forex pairs and USD 10,000 of virtual money.</p>

How Monetary Policies Affect the Forex Market
<div class="article__content"> <style type="text/css">.didyouknow { display: block; background: #5ee15a5e; padding: 5px 20px 20px 20px; border-radius: 10px; margin-top: 20px; } </style> <p>Monetary policies significantly impact currency trading. Indeed, they tend to determine the overall strength of most currencies. Investors usually pay attention to the monetary policies of a country’s central bank since they directly affect currency performance.</p> <p>These monetary policies can be either expansionary or contractionary. Expansionary monetary policies usually boost a country's economic growth by increasing the amount of money that circulates. Alternatively, contractionary monetary policies reduce the amount of money in circulation and stop inflation from rising.</p> <p>Since expansionary policies stimulate economic growth as asset prices increase, monetary policies are pivotal in the financial markets. However, the purchasing power of a country's currency usually weakens during expansionary monetary policy cycles. The opposite is true of contractionary policies, which tend to slow down economic growth and boost the value of a currency as they stop inflation.</p> <p>In this article, we shall cover monetary policy and its role in <a href="/en/trading-academy/forex/fundamental-analysis/">fundamental analysis</a>, its effect on forex markets, inflation, and exchange rates, and the trading strategies it influences. We will also discuss a global perspective on monetary policy and the challenges and considerations involved in interpreting it.</p> <h2>What is monetary policy?</h2> <p>Monetary policy refers to the specific tools central banks use to control how much money circulates within an economy, fostering economic growth. It aims to achieve goals like controlling inflation, fueling economic development, and stabilising employment figures.</p> <h3>Essential tools of monetary policy</h3> <p>Some primary tools central bankers use when implementing monetary policies are:</p> <p><u><strong>Altering interest rates</strong></u></p> <p>Falling interest rates tend to weaken currencies, while rising interest rates tend to strengthen them.</p> <p><u><strong>Increasing or decreasing commercial banks’ reserve requirements</strong></u></p> <p>Increasing commercial banks’ reserve requirements usually decreases the amount of money in circulation, while lowering the reserve requirements increases the amount of money available in an economy.</p> <p><u><strong>Conducting open market operations</strong></u></p> <p>The central bank also engages in open market operations to buy government bonds.</p> <p><img alt="Essential tools of monetary policy." src="/getmedia/c25a13bc-088e-4fea-96cd-14b6ebec6514/Academy-Forex-Monetary-policy-Essential-tools-of-monetary-policy.png" /></p> <h3>How central banks determine monetary policy</h3> <p>Central banks are the only organisations that set and enforce monetary policies. On a global scale, the US Federal Reserve sets the tone and pace of rate hikes and cuts for other central banks. As the world's reserve currency, the US dollar's performance affects other currencies significantly.</p> <p>For instance, a rising US dollar is likely to cause other currencies to decline when compared to it. Central banks also have additional tools, such as quantitative easing, which they can use to directly increase the amount of money circulating within an economy. However, significant easing frequently leads to periods of record-high inflation, prompting rate increases as central banks scramble to control the high inflation.</p> <h2>Monetary policy and its effects on the forex market</h2> <p>Monetary policy tends to impact the foreign exchange market significantly, as investors react sharply to central bank decisions regarding interest rates and other monetary policies. Below, we discuss the impact of monetary policy on the forex market.</p> <h3>How interest rate decisions affect currency strength</h3> <p>Interest rates significantly impact a currency's strength because they determine the returns investors earn on investments denominated in the currency. Countries with high interest rates tend to have much stronger currencies than those with lower rates. Looking at the interest rates a central bank sets, allows us to predict its currency’s future strength.</p> <p>However, high interest rates do not always lead to a stronger currency. In some rare cases, high interest rates cannot stop a currency from falling due to other fundamental reasons. One example would be a lack of confidence in the government and its economy. This scenario has been seen in countries such as Zimbabwe and Argentina as they battle hyperinflation due to systemic economic issues.</p> <p><img alt="How interest rates affect currency strength." src="/getmedia/7f9ed405-73a5-4e41-b6e2-75eeb50b42d1/Academy-Forex-Monetary-policy-How-interest-rates-affect-currency-strength.png" /></p> <h3>The impact of quantitative easing or tightening on currency markets</h3> <p>Quantitative easing (QE) is how central banks buy assets from the open market to increase the money in circulation and lower interest rates. QE increases most banks' reserves, providing them with extra liquidity. This can lead to increased investment and lending. However, the increased money supply typically leads to an oversupply, weakening the currency.</p> <p>Quantitative tightening (QT) is the opposite of QE. Its main goal is to reduce the central bank's balance sheet by selling government bonds or by letting them mature and then eliminating them. QT removes liquidity from the financial markets by increasing how many bonds are available to investors in the secondary bond markets. This often raises interest rates, uplifting a country's currency value.</p> <h3>Currency appreciation and depreciation through monetary policy</h3> <p>A currency tends to appreciate when the central bank, like the Federal Reserve, implements tightening or contractionary monetary policies that reduce the currency's supply. One way for a currency pair to appreciate is through interest rate hikes. These hikes lessen the amount businesses and individuals borrow, thereby reducing the money in circulation. Another way a currency can appreciate through monetary policy is quantitative tightening when the central bank increases the supply of bonds in the market.</p> <p>Currency depreciation usually occurs when a central bank increases the currency supply by buying bonds (quantitative easing), thus increasing the money in circulation. The central bank can also slash its base lending rates, allowing borrowers to get credit at lower interest rates so they can stimulate the economy through increased lending. The increased money supply typically leads to a currency's depreciation.</p> <h3>Case studies of monetary policies and their effects on currency values</h3> <p>Here are two case studies about two central banks' different monetary policy paths to fulfil their mandate of stabilising prices and maintaining stable inflation.</p> <h4>Case study 1: Japan's negative interest rates and quantitative easing</h4> <p>Japan kicked off a massive asset-buying programme in March 2001 under the guidance of the Bank of Japan’s (BoJ) former Governor, Masaru Hayami, to stimulate the economy and push inflation higher towards its target. When the quantitative easing programme failed to trigger higher inflation, the BoJ implemented negative interest rates on the excess funds held by banks in 2016.</p> <p>The Bank of Japan (BoJ) held on to its negative interest rates and QE measures even as other global banks moved from expansionary to contractionary policies in 2022 to combat record-high inflation. Inflation in Japan did not skyrocket as high as in other countries due to structural factorslike its ageing population and low birth rates. However, inflation has steadily exceeded the BoJ's target of 2%, and the bank has finally signalled that it may be ready to shift out of negative interest rates and end its yield curve control (YCC) measures.</p> <p>The BoJ's quantitative easing monetary policy strategy has made the Japanese yen one of the weakest major currencies in the world. However, this could change if the central bank abandons its QE measures and negative interest rates.</p> <h4>Case Study 2: The Fed's recent consecutive rate hikes</h4> <p>Another case study is the 11 consecutive rate hikes by the US Federal Reserve that began in March 2022, as the central bank moved to forcefully combat inflation, which was at a 40-year high of 8.5%. The US inflation rate reached a record high of 9.1% in June 2022. The Fed initially hiked interest rates by 0.25% or 25 basis points, but it had to implement three 0.75% (75 basis points) rate hikes to lower inflation.</p> <p>The rate-hiking cycle was unprecedented, as many did not expect the Federal Reserve to hike rates up from 0.25% to 5.50%, which it did in July 2023 before eventually pausing the rate hikes. Luckily, the Fed's massive intervention worked, and US inflation fell to an annualised level of 3.1% in January 2024. Investors are looking forward to Fed-rate cuts soon if inflation keeps falling.</p> <p>The US Dollar Index, which rose from a low of 89.65 in May 2021 to a high of 114.73 in September 2022, also showed that the rate increases strengthened the US dollar.</p> <h2>Monetary policy, inflation, and exchange rates</h2> <p>Monetary policy, inflation, and exchange rates all correlate in the larger scheme of currency valuations. The three factors are intricately connected and play a crucial role in a currency's performance against its peers.</p> <h3>How monetary policy, inflation rates, and currency exchange rates relate</h3> <p>A close relationship exists between monetary policy, inflation and currency exchange rates. Currency exchange rates rely to a high degree on the monetary policies set by a country's central bank. The higher a central bank sets the interest rates as part of its monetary policy, the higher its country’s currency will be. On the other hand, a country's inflation rate is vital in determining interest rates set by a central bank. In most situations, the central bank will hike interest rates in response to higher inflation figures and then lower interest rates as inflation falls back to its target. Many central banks may also implement foreign exchange interventions to stabilise their currency.</p> <p>Lastly, a currency's exchange rate depends on the interest rates its central bank sets. The higher the interest rates, the higher the currency's value. A low interest rate will likely lead to a weaker exchange rate. Sometimes, a central bank may set a fixed exchange rate against another currency instead of depending on floating rates to provide stability and prevent excessive fluctuations in the value of its currency</p> <p><img alt="The relationship between monetary policy, inflation, and currency exchange rates." src="/getmedia/efe1ca19-de80-491f-9ca6-2f2009b19f1c/Academy-Forex-Monetary-policy-The-relationship-between-monetary-policy-inflation-and-currency-exchange-rates.png" /></p> <h3>The influence of monetary policy on purchasing power parity</h3> <p>Purchasing power parity (PPP) is an economic theory that claims exchange rates between two equal currencies can purchase identical goods and services in the two countries when converted to a common currency. This means that a basket of goods and services should cost the same in the two countries when converted into the same currency.</p> <p>Monetary policies significantly impact purchasing power parity (PPP) since when a central bank raises interest rates, it strengthens the local currency, making it appreciate against other currencies. The stronger currency makes purchasing foreign goods cheaper, increasing domestic purchasing power compared to other currencies and moving away from PPP.</p> <p>Conversely, if a central bank reduces interest rates, it may result in the currency's depreciation. Consequently, imports become more expensive, diminishing the domestic currency's buying power compared to foreign currencies. This, in turn, causes the currency to deviate from purchasing power parity (PPP).</p> <p>Additionally, using monetary policies to control inflation can help align prices in one country with prices in other countries, supporting the PPP theory. However, increasing the money supply via monetary policy could lead to currency depreciation due to inflation, diverging from PPP.</p> <h3>The impact of real vs nominal interest rates on currency values</h3> <p>The term "nominal interest rates" refers to the advertised value of a bank’s interest charges on loans or savings. Nominal interest rates overlook the impact of inflation, which is why they differ from actual (real) rates adjusted for inflation.</p> <p><img alt="The impact of real vs nominal interest rates on currency values" src="/getmedia/cab4ffd4-9420-45d0-b4b7-e306ebeff828/Academy-Forex-Monetary-policy-The-impact-of-real-vs-nominal-interest-rates-on-currency-values.png" /></p> <p>Actual interest rates are nominal rates adjusted to eliminate the effects of inflation. Hence, they provide a more accurate view of the true cost of borrowing and the actual yield on your savings. When factoring in inflation, real rates accurately depict the purchasing power of the money you will pay or receive in the future.</p> <p>Higher real interest rates can appreciate a currency's value by making investments in it more attractive to investors. Higher demand for the currency could increase its purchasing power when compared to other currencies. Lower real interest rates tend to decrease demand for a currency among investors, leading to a weaker currency with lower purchasing power against other currencies.</p> <div class="didyouknow"> <h2>Did you know?</h2> <p>You can enhance your forex trading strategy by utilising the detailed economic calendar provided by ThinkMarkets. The economic calendar helps you stay informed about the central bank's announcements and react swiftly to monetary policy decisions. With ThinkMarkets, you can trade a wide range of currency pairs, each heavily influenced by their respective countries’ monetary policies. <a href="/en/account-types/">Open a live account</a> and start trading the forex market with us today.</p> </div> <h2>Trading strategies influenced by monetary policy</h2> <p>Forecasting and reacting to central bank decisions regarding inflation control, interest rates and liquidity measures are typical components of foreign exchange trading strategies that heavily rely on monetary policy.</p> <h3>How traders use monetary policies to make informed decisions</h3> <p>Traders use monetary policy announcements to guide their trading decisions, impacting how they buy or sell stocks, bonds, and currencies. Here's a simplified breakdown of how they do it:</p> <ul> <li><strong>Interest rate decisions:</strong> if rates go up, the country's currency might strengthen, but stocks and bonds could drop. If rates go down, the opposite might happen.</li> <li><strong>Forward guidance:</strong> central banks might give hints about future policies. Traders use these hints to predict market trends and plan their trades.</li> <li><strong>Quantitative easing (QE)</strong>: more QE usually means more money in the economy, lifting stock markets and possibly weakening the currency. Traders adjust their investments accordingly.</li> <li><strong>Inflation reports:</strong> high inflation might lead to higher interest rates, affecting currency value and commodity prices. Traders watch these reports closely and react accordingly.</li> <li><strong>Economic Outlook:</strong> optimistic economic forecasts might boost markets, while negative ones could cause a downturn. This helps traders decide where to invest.</li> </ul> <h3>Long-term vs short-term trading strategies affected by monetary policy</h3> <p>Changes in monetary policy strategies, including quantitative easing programmes, interest rate adjustments, or the forward guidance issued by central banks, can significantly impact short-term and long-term trading strategies. Here is how the two categories of strategies usually react to such changes:</p> <p><img alt="Impact of monetary policy on trading strategies." src="/getmedia/2bf9a624-0bdf-4865-8bc8-61363c99fd84/Academy-Forex-Monetary-policy-Impact-of-monetary-policy-on-trading-strategies.png" /></p> <h4>Long-term strategies</h4> <p><strong>Impact of monetary policy:</strong></p> <ul> <li><strong>Interest rates:</strong> long-term investors tend to monitor interest rate trends closely. Rising rates could signal a robust economy but could also trigger a decline in bond prices, negatively affecting stock valuations. Lower rates could bolster bond and stock prices but also signal economic concerns.</li> <li><strong>Quantitative easing (QE):</strong> expansionary monetary policies such as QE could lower the attractiveness of bonds due to lower yields, causing investors to shift to buying real estate or stocks as they pursue higher returns.</li> </ul> <p><strong>Adaptation:</strong></p> <ul> <li><strong>Diversification:</strong> long-term investors could diversify their portfolios across multiple asset classes to manage the risks associated with monetary policy changes.</li> <li><strong>Quality investments:</strong> buying high-quality assets, such as stocks with solid fundamentals and high-grade bonds, will ensure that your investments can better weather economic changes.</li> <li><strong>Yield curve analysis:</strong> monitoring the yield curve for signs of changing economic expectations and interest rate changes can help you better adjust your bond strategies.</li> </ul> <h4>Short-term trading strategies</h4> <p><strong>Impact of monetary policy:</strong></p> <ul> <li><strong>Volatility:</strong> short-term traders usually thrive during periods of market volatility created by monetary policy news, as they use the news to try and benefit from rapid price movements.</li> <li><strong>Market sentiment:</strong> immediate reactions to monetary policy changes or news may result in transient market trends that short-term traders can exploit.</li> </ul> <p><strong>Adaptation:</strong></p> <ul> <li><strong>Technical analysis:</strong> short-term traders tend to base their trading decisions on technical analysis, which they can use to gauge market sentiment and predict future price moves around policy news.</li> <li><strong>Event-driven trading:</strong> traders might participate in event-driven trading strategies where they enter and exit positions based on scheduled policy announcements and economic data releases.</li> <li><strong>Risk management:</strong> Implementing stringent risk management tactics like stop-loss orders can protect you against unpredictable market reactions to policy changes.</li> </ul> <h4>Risk management techniques in response to anticipated and unanticipated policy shifts</h4> <p>Risk management is pivotal in the trading and investing industry. It helps traders minimise their risk exposure when faced with shifts in monetary policy. Central banks' decisions can significantly influence the foreign exchange markets, and traders must utilise risk mitigation strategies. Here are some risk management strategies for monetary policy changes.</p> <h5>Risk management in the face of anticipated monetary policy shifts:</h5> <ul> <li><strong>Hedging:</strong> you can use derivatives such as futures and options to protect against potential losses. For instance, if you anticipate an increase in rates will negatively affect your bond portfolio, you could acquire interest rate futures that increase in value amid rate hikes, offsetting your bond losses.</li> <li><strong>Diversification:</strong> It is prudent to spread your investments across multiple asset classes, such as commodities, bonds, stocks, and various sectors, to lower your exposure to a single policy decision or economic event.</li> <li><strong>Position sizing:</strong> you should constantly adjust the size of your positions based on the implied risk level of a planned policy announcement, reducing the size of any positions vulnerable to the news or event.</li> <li><strong>Stop-loss orders:</strong> you can set stop-loss orders to automatically close positions once they reach a predefined price level, limiting your possible losses on the trade if it moves against your predicted direction.</li> </ul> <h5>Risk management in the face of unanticipated monetary policy shifts:</h5> <ul> <li><strong>Real-time monitoring and quick response:</strong> Closely monitor market news and central bank decisions. Being able to react quickly and close or tweak your positions could be crucial to responding to surprise announcements.</li> <li><strong>Contingency planning:</strong> develop "if-then" scenarios for unexpected policy shifts. Having a plan of action for all scenarios can help you make quick decisions whenever you're stressed.</li> <li><strong>Liquidity management:</strong> you should maintain a percentage of your portfolio in liquid assets to react to market changes or cover margin calls without closing your positions at a loss.</li> <li><strong>Volatility-based stop-loss orders:</strong> instead of a fixed stop-loss, you can use a volatility-adjusted stop-loss order that factors in the market's current volatility. This can shield you from significant losses while also shielding you from normal price fluctuations.</li> </ul> <h2>Global perspective on monetary policy</h2> <h3>Comparative analysis of different central banks’ approaches to monetary policy</h3> <p>Central banks, like the European Central Bank (ECB), the Federal Reserve (Fed) in the U.S., and the Bank of Japan (BoJ), have unique ways of handling monetary policy to control inflation, encourage job growth, and ensure economic stability.</p> <ul> <li><strong>Federal Reserve:</strong> The Fed often adjusts interest rates and uses open market operations as its primary tool. It aims for moderate long-term interest rates, maximum employment, and stable prices. The Fed has a dual role in managing inflation and maximising employment.</li> <li><strong>European Central Bank:</strong> The ECB's primary goal is to control inflation and ensure price stability in the eurozone. General economic policies in the EU are secondary considerations. The ECB impacts the economy through asset purchase programmes, interest rate adjustments, and loans to commercial banks.</li> <li><strong>Bank of Japan:</strong> The BoJ has been combating deflation, so it has adopted aggressive monetary easing policies, including setting negative interest rates and a large-scale asset purchasing programme. It aims to achieve a stable inflation rate of 2% over the medium term.</li> </ul> <p>Each central bank's approach is tailored to its specific economic environment and challenges.</p> <h3>The effect of coordinated vs. uncoordinated monetary policies on currency markets</h3> <p>Coordinated monetary policies occur when leading central banks work together, aligning their actions to deal with global economic issues such as a worldwide financial crisis. Their coordinated efforts can stabilise global markets through their unified approach to tackling big problems, making investors and traders feel more secure.</p> <p>Uncoordinated monetary policies happen when central banks act separately, focusing entirely on their local economic conditions without considering the global impact. Such actions can lead to uncertainty and volatility in the global currency markets. For example, if one country raises interest rates while another is reducing them, sharp moves in their currencies could develop, disrupting international trade patterns.</p> <p>Ultimately, coordinated policies tend to calm and stabilise global markets, while uncoordinated policies can trigger uncertainty and turbulence, impacting international trade and currency values.</p> <p><img alt="Coordinated vs. uncoordinated monetary policies affect currency markets." src="/getmedia/7b41ff78-9050-4473-824b-41fdb2068259/Academy-Forex-Monetary-policy-Coordinated-vs-uncoordinated-monetary-policies-affect-currency-markets.png" /></p> <h2>Challenges and considerations in interpreting monetary policy</h2> <p>Investors, analysts, and traders face significant challenges when interpreting the possible impact of monetary policy changes on specific currencies. It is hard to predict what the central bank will do and even harder to predict the market's reaction.</p> <h3>The difficulty in predicting central bank actions and market reactions</h3> <p>Predicting central bank actions and how the markets will react to them is challenging due to the complex indicators and interpreting comments made by central bank policymakers. The central bankers examine numerous economic data points, like prices, jobs and economic growth, before deciding whether to keep the economy stable or boost it. However, they never clarify what they plan to do next, and even when giving clues, they tend to be quite vague.</p> <p>Furthermore, even when you correctly guess what the central bank plans to do, you still must predict how investors and traders will react, which is another challenge. Investors may barely react to a big announcement, while in contrast, their reactions to a slight change could be strong due to their mood, current events, or general expectations.</p> <p>Therefore, it is like trying to predict the outcome of a game with murky rules that frequently change, with players who react unpredictably. This unpredictable nature makes it challenging for anyone trying to make informed decisions in the financial markets.</p> <h3>Consideration of geopolitical events and their interplay with monetary policy</h3> <p><a href="/en/trading-academy/forex/geopolitics-impact/">Geopolitical events</a> such as wars, elections or trade agreements can transform a country's political and economic stability. Such events can affect central banks' monetary policies to control the amount of money circulating in a country and its interest rates. Here's a brief analysis of how the interplay between monetary policies and geopolitical events can affect the economy:</p> <p><strong>Influence on the economy:</strong> Geopolitical events can affect a nation's inflation, economic growth, and trade balance. For instance, a conflict might interfere with oil supplies, leading to high prices and inflation. Central banks monitor these changes critically.</p> <p><strong>Central bank reactions:</strong> In response to geopolitical events, central banks can change their monetary policies to stabilise the economy. If an event triggers high inflation, the central bank might hike interest rates to slow down the economy. If an event hurts the economy, the central bank could lower rates to stimulate investment and spending.</p> <p><strong>Interplay complexity:</strong> The primary challenge is that geopolitical events can have an unpredictable impact on the economy, which also impacts monetary policy. Additionally, the effects of these events can be immediate, or they can unfold over time, making it harder for the central bank to maintain economic stability.</p> <p>In summary, geopolitical events can trigger economic waves that the central bank tries to manage by implementing monetary policy changes. However, the unpredictable nature of these events makes it a challenging task.</p> <h3>Why stay updated with central bank news and economic indicators?</h3> <p>Staying updated with central bank announcements and economic indicators is crucial because it's like having a roadmap that shows where the economy and markets might be heading. Central bank announcements give insights into interest rates and monetary policy, which can affect the economy’s overall economic health as well as how much it costs to borrow money.</p> <p>Economic indicators, like unemployment rates or inflation, show how the economy performs. They help predict whether it is speeding up, slowing down, or staying steady. This information is critical for investors, traders, and businesses, helping them decide where to invest, when to save, and how to plan.</p> <p>Simply put, it's about being prepared and making smart moves based on what happens in the economy.</p> <h2>Conclusion</h2> <p>In summary, monetary policies play a critical role in currency trading as they impact the values of currencies in the financial markets. The interest rate decisions implemented by central banks affect their currency values; hiking interest rates can make a currency more attractive and increase its value, while the opposite is true of interest rate cuts. Monetary policy, currency exchange rates and interest rates are all interconnected.</p> <p>Monetary policies can also impact trading strategies, especially after central bank announcements. Interpreting these policies and their potential impact on currencies can also be quite challenging. As a trader, you should continuously learn about the markets, keeping abreast of the dynamic nature of monetary policy and trading.</p> </div>

Forex Market Sentiment: Fundamentals, Types, Analysis, Indicators, Tools & Strategy
<p>Forex market sentiment is the combined or collective attitude of investors, traders, and other market participants within the financial markets. It usually refers to the outlook that an entire market has towards the future direction of the prices of various financial assets. Bullish market sentiment is generally recorded when prices rise, while bearish market sentiment is typically associated with falling prices.</p> <p>Forex market sentiment is crucial in identifying the overall mood towards a specific asset or market. Market sentiment differs from fundamental analysis and is more of a psychological view of the market. It can be compared to crowd mentality, where people are influenced and act based on the prevailing trend rather than their own opinions.</p> <p>This article will analyse market sentiment, a crucial aspect of <a href="/en/trading-academy/forex/fundamental-analysis/">fundamental analysis</a>. We'll delve into the different types of market sentiment, key indicators, and tools for analysing it. Additionally, we will guide you through developing a strategy based on market sentiment.</p> <h2>Understanding market sentiment</h2> <p>Market sentiment is critical in influencing currency movements since it tells the market's overall mood toward an asset. For instance, when the <a href="/en/eur-usd/">EUR/USD</a> currency pair is rising, and the number of buy orders far exceeds the number of sell orders, we can confidently say that the market sentiment towards the EUR/USD is bullish.</p> <p>The market mood affects currency movements because when more people want to buy a currency pair, its price rises due to the increased demand. When many want to sell a currency pair, its value drops due to the increased supply.</p> <p><img alt="How market participants influence market sentiment." src="/getmedia/887893ed-e794-47d2-8853-ffbcc2d0916d/Academy-Forex-Market-Sentiment-how-market-participants-influence-market-sentiment.png" /></p> <h3>How do different market participants contribute to the overall sentiment</h3> <p>Let's imagine that the forex market is a big ocean and that the three types of market participants are retail investors, institutional investors, and central banks.</p> <p><strong>Retail investors:</strong> can be described as small fish who make small trades on an individual basis that cannot impact overall sentiment. However, if millions of traders open trades in the same direction, they can significantly affect market sentiment.</p> <p><strong>Institutional traders:</strong> are the big fish. They include banks, hedge funds, and pension funds that trade massive amounts of currency. They have significant cash reserves, and their trades tend to impact specific currency pairs.</p> <p><strong>Central banks:</strong> are whales. They are not ordinary players since they have the power to change the entire direction of a currency through actions such as setting interest rates and conducting open market operations. Due to their effect on the affected currency, central bank moves can have a massive impact on market sentiment.</p> <p>Each type of participant contributes to the overall market sentiment through their actions and reactions to economic events, news, and each other's behaviours.</p> <h3>The difference between rational and irrational market sentiment</h3> <p>Rational and irrational market sentiment are not the same since they are based on different factors, as outlined in the table below:</p> <table> <tbody> <tr> <th>Aspect</th> <th>Rational Sentiment</th> <th>Irrational Sentiment</th> </tr> <tr> <th>Basis</th> <td>Logic and reason</td> <td>Emotion and bias</td> </tr> <tr> <th>Decision Making</th> <td>Decisions based on facts, data, and objective analysis</td> <td>Decisions influenced by feelings, personal experiences, or prejudices</td> </tr> <tr> <th>Outcome Predictability</th> <td>Outcomes are more predictable as they are based on systematic analysis</td> <td>Outcomes are less predictable due to the influence of emotions and personal biases</td> </tr> <tr> <th>Behavior</th> <td>Consistent and can be explained logically</td> <td>Inconsistent, often swayed by mood or current circumstances</td> </tr> <tr> <th>Response to Information</th> <td>Analytical: evaluates new information based on its merit and relevance</td> <td>Reactive: may reject or accept information based on how it aligns with existing beliefs</td> </tr> <tr> <th>Application in Finance</th> <td>Investment decisions based on market analysis, company performance, and fundamentals</td> <td>Investment decisions based on market sentiment, rumours, or trends without a solid foundation</td> </tr> <tr> <th>Role in Group Dynamics</th> <td>Promotes structured debate and consensus-building based on evidence</td> <td>This can lead to groupthink or polarisation based on shared emotions or unfounded beliefs</td> </tr> </tbody> </table> <p>This table summarises how rational sentiment is grounded in reality and facts, leading to more predictable and logical market movements. In contrast, irrational sentiment is fueled by emotions and can lead to erratic market behaviour that doesn't always reflect the economy's or financial markets' actual state.</p> <h2>Types of market sentiment</h2> <p>Multiple types of market sentiment exist based on the overall market mood now and the different reactions of investors and traders to it.</p> <h3>Bullish sentiment: confidence in the rise of a currency's value</h3> <p>Bullish sentiment typically occurs when investors and traders are confident that a currency's value will keep rising; hence, they can ride the trend higher. The best action during periods of bullish sentiment is to buy the affected currency to profit from the move higher.</p> <h3>Bearish sentiment: fear or expectation of a currency's value declining</h3> <p>Bearish sentiment is the opposite of bullish sentiment in that it indicates that investors fear the prospects of a currency as they expect it to fall. Bearish sentiment occurs whenever factors, such as news releases and central bank decisions, paint a negative picture of the affected currency.</p> <h3>Neutral sentiment: uncertainty or lack of direction in the market</h3> <p>A neutral market sentiment arises when there is a lack of fundamental drivers behind a currency that could either push the currency higher or lower. The lack of factors to trigger a move in either direction tends to result in a sideways trading trend where the currency is neither falling nor rising.</p> <h3>Risk-on sentiment: willingness to take on more risk in the market</h3> <p>Risk-on sentiment occurs when investors and traders are willing to take on more market risks, especially regarding riskier assets such as stocks. In such an environment, investors typically seek higher returns from riskier assets and are not keen on preserving their capital.</p> <h3>Risk-off sentiment: preference for safer assets due to increased risk aversion</h3> <p>Risk-off sentiment occurs when market participants are keen to preserve their capital. Hence, they prefer to own safe-haven assets such as gold and government bonds. They could also buy the US dollar, Japanese yen, and Swiss franc, regarded as safe-haven currencies. Investors also tend to sell their riskier assets as they buy safe-haven assets.</p> <p><img alt="Types of market sentiment." src="/getmedia/3a3dc0b7-a27f-4fca-a3ad-aa3ebb0fe056/Academy-Forex-Market-Sentiment-types-of-market-sentiment.png" /></p> <h2>Analysing market sentiment</h2> <p>There are different ways to determine the market's mood, including what investors and traders think about buying and selling in the currency and stock markets.</p> <h3>Technical analysis</h3> <p>Analysing market sentiment through technical analysis involves reading the market's mood through charts and graphs. You look at how prices have moved in the past, how many people are buying or selling (volume), and any patterns that might repeat.</p> <h4>Advantages:</h4> <ul> <li>Technical analysis is all about the numbers and charts, so it feels less like guesswork.</li> <li>Technical patterns show up repeatedly, giving clues about future price moves.</li> </ul> <h4>Limitations:</h4> <ul> <li>Technical analysis ignores what's happening worldwide that could affect prices.</li> <li>Sometimes, what looks like a pattern is just market noise, leading to false signals.</li> </ul> <h3>News & media analysis</h3> <p>News and media analysis involves monitoring the news, social media, and experts' statements. It's about understanding the market's mood from stories and tweets.</p> <h4>Advantages:</h4> <ul> <li>News and media analysis can give immediate insight into why the market is moving.</li> <li>This type of analysis covers a lot of factors, from politics to natural disasters.</li> </ul> <h4>Limitations:</h4> <ul> <li>The news and social media can be biased or overly dramatic.</li> <li>With so much information, it's hard to understand and identify what matters.</li> </ul> <h3>Surveys & reports</h3> <p>Analysing market sentiment through surveys and reports means looking at surveys from investors and reports from banks to get a sense of optimism or pessimism.</p> <h4>Advantages:</h4> <ul> <li>Surveys and reports allow you to hear directly from investors about their feelings.</li> <li>This method also helps compare current sentiment to past trends.</li> </ul> <h4>Limitations:</h4> <ul> <li>Surveys can lag, such that the market might have moved on by the time they are published.</li> <li>They can also be subjective since people's feelings can be fickle and not always based on logic.</li> </ul> <p><img alt="Analysing market sentiment." src="/getmedia/40213117-011c-4ae6-b293-b7bf80bf0ef4/Academy-Forex-Market-Sentiment-analysing-market-sentiment.png" /></p> <h3>Forex retail sentiment</h3> <p>Forex retail sentiment looks explicitly at how individual traders (not the big institutional ones) are positioned in the forex market. Are most people betting that a currency will go up or down? It's like gauging the crowd's bet.</p> <h4>How it helps traders:</h4> <ul> <li>It can be a great contrarian indicator; if most retail traders lean one way, the market might go the other way. Many use it to bet against the crowd.</li> <li>It can also be a solid mood gauge, showing smaller traders' overall bullishness or bearishness.</li> </ul> <h4>Advantages:</h4> <ul> <li>Forex retail sentiment is easy to understand, as you can either follow the crowd or bet against it.</li> <li>It is highly accessible since many brokers provide this information for free.</li> </ul> <h4>Limitations:</h4> <ul> <li>It is not always right, as the crowd can be correct sometimes, leading contrarian traders astray.</li> <li>It is prone to market manipulation, as big players might sway the market, leaving retail sentiment in the dust.</li> </ul> <p>Each method has its toolkit for understanding and predicting market movements. By combining these tools wisely, traders and investors can better understand where the market might be heading next.</p> <h2>Key market sentiment indicators</h2> <p>Here is an explanation of the specific indicators that help gauge market sentiment in the financial markets:</p> <h3>The commitment of traders (COT) reports:</h3> <ul> <li>The COT reports show the net buy or sell positions of different types of traders (like large speculators and hedge funds) in various futures markets, including currencies.</li> <li>Seeing if the big players are betting on going up or down prices can give you a sense of the market's overall mood. For example, if hedge funds are heavily betting on the euro's rise, it suggests they're optimistic about it.</li> </ul> <h3>Volatility indexes (VIX):</h3> <ul> <li>Often called the "fear index," the VIX measures the volatility traders expect in the stock market over the next 30 days. Although initially designed for the stock market, the VIX can reflect broader financial market sentiment.</li> <li>A high VIX suggests that traders are nervous and expect big price swings, indicating fear. A low VIX suggests calm and confidence among traders.</li> </ul> <h3>Currency carry trade:</h3> <ul> <li>The carry currency trade involves borrowing a currency with low interest rates and buying acurrency with higher rates, hoping to profit from the difference.</li> <li>When confident, investors are more likely to engage in carry trades, seeking profit from these differences. A lot of carry trade activity can indicate that investors feel bullish (positive). Conversely, unwinding these trades can signal fear or pessimism.</li> </ul> <h3>Social media sentiment analysis:</h3> <ul> <li>Social media sentiment analysis involves using tools to analyse the mood of discussions on platforms like Twitter (X), Reddit, or specialised financial forums.</li> <li>If there's a lot of positive chatter about a currency, it suggests bullish sentiment. A surge in negative comments might indicate a bearish sentiment. This method offers a real-time pulse on what traders and investors are thinking.</li> </ul> <p><img alt="Key sentiment indicators." src="/getmedia/ca493780-b02d-45cb-bc90-da652f94f09f/Academy-Forex-Market-Sentiment-key-sentiment-indicator.png" /></p> <p>Each indicator gives a different piece of the puzzle for understanding market sentiment. The COT reports provide insight into the actions of big players; the VIX offers a measure of fear or complacency, carry trades reveal risk appetite, and social media analysis captures the mood of the broader trading community. When used together, they can provide a comprehensive view of market sentiment.</p> <h2>Tools for analysing market sentiment</h2> <p>Here are some of the tools used to analyse market sentiment accurately:</p> <h3>News aggregators:</h3> <ul> <li>News aggregators gather and organise news from different sources, such as financial news websites and social media platforms. Many use algorithms to gauge the sentiment of the collected content, categorising it as positive, neutral, or negative.</li> <li>They provide a quick snapshot of the current mood surrounding financial markets, economies, or specific assets. By watching these, you can stay ahead of trends and understand how news might influence market movements.</li> </ul> <h3>Technical analysis platforms:</h3> <ul> <li>Technical analysis platforms offer charts and many technical indicators, including those that can reflect market sentiment, like the relative strength index (RSI) and moving averages (MAs). Some may also include specific sentiment indicators, such as the number of stocks hitting new highs versus new lows.</li> <li>The analysis allows traders to visualise market trends and sentiment through price movements and trading volumes. This can help you accurately predict future market directions based on historical data.</li> </ul> <h3>Sentiment analysis software:</h3> <ul> <li>Sentiment analysis software analyses text from social media posts and other online sources to determine sentiment toward specific topics or assets. It applies natural language processing (NLP) to grasp the context and classify sentiment.</li> <li>It offers insights into the collective mood of market participants. Quantifying people's feelings about a particular currency, stock, or market can help predict potential market moves based on public sentiment.</li> </ul> <p>Each tool provides a unique lens through which to view market sentiment. News aggregators keep you updated on the latest events and their perceived impact, technical analysis platforms help you spot sentiment trends through market data, and sentiment analysis software dives into the vast world of online chatter to gauge the public mood. They offer a comprehensive view of market sentiment, assisting traders and investors in making more informed decisions.</p> <h2>Developing a market sentiment trading strategy</h2> <p>Making market sentiment analysis a part of your trading strategy can aid you in navigating the markets more effectively.<br /> Here's how to do it:</p> <h3>Identifying opportunities:</h3> <ul> <li>Combine sentiment analysis with other methods, like technical or fundamental analysis, to find trading opportunities. For example, if technical analysis suggests a stock is about to rise, positive news or social media sentiment can confirm this signal.</li> <li>Using sentiment as a confirmation tool adds an extra layer of validation to your trading signals, making your strategy more robust.</li> </ul> <h3>Risk management:</h3> <ul> <li>You can monitor sentiment indicators to detect shifts in market mood. If sentiment turns negative for an asset you hold, consider reducing your position or setting tighter stop-losses to protect your investment.</li> <li>Adjusting your positions based on sentiment changes helps manage risk more dynamically. It means you're not just reacting to price movements but also to underlying changes in market psychology.</li> </ul> <h3>Avoiding herd mentality:</h3> <ul> <li>Always be aware of extreme sentiment readings. Extreme positive sentiment can signal overheated markets (potential sell signals), while extreme negativity might indicate oversold conditions (potential buy signals). Use these insights to explore contrarian opportunities, going against the crowd when it seems irrational.</li> <li>Awareness of herd mentality can help avoid getting caught in market bubbles or panics. By being sceptical of the herd and considering contrarian views, you may find opportunities that others overlook and protect yourself from sudden reversals.</li> </ul> <p>In summary, integrating market sentiment into your trading strategy involves using sentiment data to confirm your analysis, adjusting your risk management tactics based on sentiment shifts, and maintaining a critical perspective to avoid following the crowd mindlessly. This approach can make your strategy more adaptive and potentially more profitable.</p> <h2>Conclusion</h2> <p>Market sentiment analysis is crucial in <a href="/en/forex-trading/">forex trading</a> since it offers insights into currency market trends. Traders should blend sentiment with other analyses, use diverse indicators like COT reports and VIX, and employ real-time tools like news aggregators. Adapting strategies to sentiment shifts helps manage risk while avoiding herd mentality, and considering contrarian opportunities can enhance trading outcomes. This approach helps traders make better informed decisions in the forex market.</p>

Currency Volatility: Types, Characteristics and Strategy
<div class="article__content"> <style type="text/css">.didyouknow { display: block; background: #5ee15a5e; padding: 5px 20px 20px 20px; border-radius: 10px; margin-top: 20px; } </style> <p>Currency volatility illustrates how frequently and significantly a currency’s value fluctuates compared to other currencies. During periods of high volatility, a currency’s value can experience significant changes over a short period of time.</p> <p>Annualised volatility measures the level of uncertainty or risk related to the size of changes in a security's value over a specific period. It can be reported daily, weekly, monthly, or annually. Low volatility means that the currency’s value is stable, and any changes are predictable.</p> <p>This concept is pivotal for traders and investors, as it influences their potential profits and the level of risk associated with currency investments. Volatility is critical to a trader’s risk management and overall trading strategies.</p> <p>This article will analyse the different types of currency volatility, characteristics of high- and low-volatility currencies, tools to measure volatility, trading strategies for different volatility levels, and risk management strategies for both types.</p> <p><img alt="Forex Volatility" src="/getmedia/f290bead-52a8-42a3-a9b9-c4096c5076b3/Academy-Forex-Currency-Volatility-forex-volatility.png" /></p> <h2>Types of currency volatility</h2> <p>There are two main types of currency volatility: historical volatility and implied volatility. Historical volatility refers to the impact of past price fluctuations on your trading decisions, while implied volatility refers to predicting future volatility using market indicators.</p> <h3>Historical volatility</h3> <p>Historical volatility is a concept that examines the frequency and size of price changes for a financial instrument or currency pair based on past data. Historical volatility is typically annualised to provide a standardised measure of past price fluctuations, making it useful to think of volatility as the annualised standard deviation. It measures previous market behaviour and offers traders crucial insights that could impact their trading and risk management strategies. Historical volatility differs from implied volatility, which predicts future price trends by providing a robust foundation for an asset’s past performance.</p> <h4>How past price fluctuations inform trading decisions.</h4> <p>Past price fluctuations are a crucial aspect of technical analysis in forex trading since they inform trading decisions in multiple ways:</p> <ul> <li><strong>Trend analysis:</strong> Traders can spot trends by looking at past price movements. Uptrends indicate the potential for buying opportunities, whereas downtrends suggest the likelihood of selling or shorting opportunities. The direction and momentum of these trends can guide traders in making informed trading decisions.</li> <li><strong>Support and resistance levels:</strong> These are historical price levels at which a currency pair has experienced challenges moving past. Support levels are specific price levels at which a currency pair tends to hit a floor, while resistance levels are prices at which a currency pair tends to hit a ceiling. Traders use these levels as points at which they can enter and exit trades.</li> <li><strong>Price patterns:</strong> These are specific patterns on price charts, such as flags, heads and shoulders, or triangles, that could indicate the likelihood of future price movements in a particular direction. Traders frequently use these chart patterns, which they have derived from historical price movements, to forecast both the direction and size of potential price moves.</li> <li><strong>Momentum indicators:</strong> These indicators, such as the relative strength index (RSI) and moving average convergence divergence (MACD), are derived from past prices. They help traders determine the speed and change in price movements. Such indicators can signal the likelihood of reversals or confirm the momentum of a trend.</li> <li><strong>Volume analysis:</strong> Apart from price, the volume of trades can provide insights as to a currency's future direction. High trading volumes could indicate the strength of a price move, while low volumes might confirm a lack of conviction or a likely reversal.</li> <li><strong>Risk management:</strong> Historical price data can help traders set stop-loss and take-profit levels correctly, thus allowing them to manage risk effectively. By assessing past extreme prices, traders can set their stop-loss and take-profit orders at historical significance levels.</li> </ul> <p>It's crucial to note that while historical price analysis is critical in a trader's toolkit, it's not faultless. Market conditions can sometimes change, and past performance does not always indicate future results. Furthermore, combining technical analysis with fundamental analysis and constantly monitoring current events can give you a more rounded approach to forex trading.</p> <h3>What is Implied volatility?</h3> <p>Implied volatility alludes to the market’s prediction of how volatile a financial instrument, including stocks and FX pairs, could be. It is calculated using the prevailing price of the option contracts for that specific asset. So, implied volatility looks ahead at how much prices could fluctuate in the future, while historical volatility assesses actual past price changes. Implied volatility figures signal what level of future uncertainty and price swings traders and investors have priced into options. Both historical and implied volatility can be reported as annualised volatility, providing a standardised measure for comparison.</p> <h4>Forecasting future volatility using market indicators.</h4> <p>Predicting future forex volatility requires you to assess multiple market indicators that can enable you to gain awareness of how volatile the market could be. Below are some crucial indicators used to forecast implied volatility:</p> <ul> <li><strong>Volatility indices:</strong> The most famous example is the CBOE Volatility Index (VIX), commonly known as the "fear index." It measures the market's expected 30-day volatility based on the price of S&P 500 index options. A relatively high VIX value indicates high stock market volatility, while a low VIX suggests low expected volatility.</li> <li><strong>Average true range (ATR):</strong> The ATR is a tool used in technical analysis to calculate market volatility by breaking down a financial asset's entire market price range over a specific period. A higher ATR value indicates increased market volatility.</li> <li><strong>Interest rates and central bank policies:</strong> Monetary policy decisions executed by a central bank, such as the U.S. Federal Reserve, could impact interest rates and market volatility. Lower interest rates encourage investment in stocks, whereas higher rates lead to reduced market activity.</li> <li><strong>Geopolitical events:</strong> International conflicts, political instability, or other geopolitical events could trigger uncertainty, causing increased market volatility. Investors closely monitor geopolitical events due to their significant impact on global markets.</li> <li><strong>Market sentiment indicators:</strong> These include the put/call ratio, the bull/bear ratio, and the advance/decline line. They provide details about investor psychology and can predict market moves.</li> </ul> <p>Predicting market volatility requires a multi-pronged approach considering various political, economic, and technical factors. It's crucial to remember that these indicators can generate valuable insights but are not infallible in predicting future market behaviour. Using advanced models and a deep understanding of current events is vital to this complex task.</p> <h2>Characteristics of high- and low-volatility currencies</h2> <p>There are two types of currencies in the forex markets: high-volatility and low-volatility. These two types of currencies have different characteristics and must be traded using strategies tailored to their volatility levels.</p> <h3>High-volatility currencies</h3> <p>Currencies with high volatility experience substantial and rapid changes in their exchange rates within short timeframes. These currencies tend to move a lot daily, creating multiple trading opportunities for traders who focus on them. However, their volatility makes trading them high-risk due to the sudden price movements. Below is a list of the most volatile currency pairs.</p> <h4>The top 10 highly volatile currencies</h4> <p>Here is a list of the top 10 highly volatile currencies, but this list is not set in stone. Some of these currencies can trade in a less volatile manner for extended periods, which you should always consider.</p> <p><img alt="Top 10 highly volatile currencies." src="/getmedia/070ebf05-6766-42f1-bd39-919eebe9c0ea/Academy-Forex-Currency-Volatility-top-10-highly-volatile-currencies.png" /></p> <ul> <li><strong>South African Rand (ZAR):</strong> The rand is known for its fluctuations, which are due to both domestic and international factors.</li> <li><strong>Turkish Lira (TRY):</strong> Political and economic instability in Turkey have significantly contributed to the lira's volatility.</li> <li><strong>Brazilian Real (BRL):</strong> Economic and political difficulties in Brazil have historically led to volatility in the real's value.</li> <li><strong>Russian Ruble (RUB):</strong> Economic sanctions and geopolitical tensions have always affected the ruble's stability.</li> <li><strong>Nigerian Naira (NGN):</strong> Domestic challenges and fluctuations in oil prices contribute to the naira's volatility.</li> <li><strong>Mexican Peso (MXN):</strong> The peso's volatility results from economic policies and its link to global trade dynamics.</li> <li><strong>Indonesian Rupiah (IDR):</strong> Being an emerging market, the rupiah often experiences significant fluctuations.</li> <li><strong>Argentine Peso (ARS):</strong> Argentina's political and economic struggles have historically caused significant fluctuations in its currency's value.</li> <li><strong>Venezuelan Bolívar (VEF):</strong> With hyperinflation and economic challenges, the Venezuelan Bolívar has always experienced extreme volatility.</li> <li><strong>Iranian Rial (IRR):</strong> The Iranian Rial has been highly volatile due to the impact of international sanctions and domestic economic issues.</li> </ul> <p><img alt="USDMXN as a volatile currency pair" src="/getmedia/7273f897-7e51-4e00-b404-6d4eac2b885d/Academy-Forex-Currency-Volatility-usdmxn-as-a-volatile-currency-pair.png" /></p> <h4>Advantages of trading highly volatile currency pairs</h4> <p>Here are some advantages of trading highly volatile currencies that move in significant price swings daily. These advantages are crucial to your long-term success as a forex trader.</p> <ul> <li><strong>Higher profit potential:</strong> In currency markets, high volatility can lead to significant price movements, giving traders an opportunity to achieve substantial profits in a relatively short period.</li> <li><strong>Attractive for short-term traders:</strong> Short-term traders, like day traders or scalpers, can benefit from quick price shifts because these frequent price changes provide many opportunities to enter profitably and exit trades.</li> <li><strong>Diversification:</strong> Incorporating high-volatility currencies into a portfolio offers diversification, specifically for traders who usually engage in less volatile markets.</li> <li><strong>Opportunities in market fluctuations:</strong> Numerous trading opportunities arise from high volatility and more significant and frequent fluctuations in currency values.</li> <li><strong>Benefit from economic events:</strong> Traders get the opportunity to leverage significant economic news and events, which can cause high volatility in some currency pairs.</li> </ul> <h4>Disadvantages of trading highly volatile pairs</h4> <p>Here are some of the top disadvantages of trading highly volatile currency pairs that are affected by multiple factors, such as geopolitical events that lead to sudden price swings:</p> <ul> <li><strong>Psychological stress:</strong> Trading during highly volatile conditions can induce stress, even for experienced traders. The rapid-paced environment and large swings in loss and profit can be emotionally draining and lead to traders making impulsive decisions driven by emotions instead of rational analysis.</li> <li><strong>Increased risk of loss:</strong> High fx volatility is characterised by more significant and unpredictable price movements. Such unpredictability can increase the potential for substantial losses if the price goes in a different direction.</li> <li><strong>Overtrading:</strong> The temptation of quick profits in volatile markets leads to overtrading. Traders increase the likelihood of potential losses when they engage in more trades than their risk management plans allow.</li> <li><strong>Impact of external factors:</strong> Highly volatile pairs tend to be more susceptible to external factors like central bank decisions and political events. Forecasting these events and their effects on the market can be difficult.</li> <li><strong>Difficulty in applying traditional technical analysis:</strong> High-volatile markets do not comply with the standard rules of trading, making it challenging to adhere to any of the strategies that work well in a typical market setting.</li> </ul> <h3>Low-volatility currencies</h3> <p>Low-volatility currencies are those with lower levels of market uncertainty and stable economies. Most of these currencies have lower price movements than highly volatile currencies. Despite their low volatility, these currencies can trigger excellent trading opportunities from long-term trends. Most low-volatility currencies are usually major currencies.</p> <h4>Characteristics of low-volatility currencies</h4> <p>These are the characteristics of low-volatility currency pairs with much lower price movements than high-volatility currencies. Here are some of their characteristics:</p> <ul> <li><strong>Lower interest rate fluctuations:</strong> Central banks in these nations tend to have consistent monetary policies, resulting in fewer unexpected interest rate shifts.</li> <li><strong>Market liquidity:</strong> These currencies are typically highly liquid, meaning they can be purchased or sold in large quantities without significantly impacting their prices.</li> <li><strong>Lower sensitivity to global market events:</strong> Although global events have the potential to influence all currencies, low-volatility currencies are barely impacted compared to currencies from emerging markets.</li> <li><strong>Stable economies:</strong> Countries with well-established financial policies, stable political environments, and solid financial policies tend to have less volatile currencies.</li> <li><strong>Spreads:</strong> Low-volatility currencies tend to have narrower spreads whenever they are part of currency pairs.</li> </ul> <p>The annualised volatility of low-volatility currencies is typically lower, indicating more stable and predictable price movements.</p> <h4>The top 10 low-volatility currencies</h4> <p>Here are the top 10 low-volatility currencies that can be traded in the forex markets. However, these currencies may not always be less volatile.</p> <p><img alt="The top 10 low-volatility currencies." src="/getmedia/92d0c44e-2611-4897-8645-b85e75e93ead/Academy-Forex-Currency-Volatility-the-top-10-low-volatility-currencies.png" /></p> <ul> <li><strong>Euro (EUR):</strong> The euro is the main currency of the Eurozone, and it usually exhibits stability due to the combined economic strength of its member nations.</li> <li><strong>Swiss Franc (CHF):</strong> The strength of Switzerland's economy and the stability of its political framework contribute to making the Swiss franc a low-volatility currency.</li> <li><strong>U.S. Dollar (USD):</strong> As the world's primary reserve currency, the USD is frequently considered a safe option during global financial uncertainty.</li> <li><strong>Japanese Yen (JPY):</strong> Japan's economic prowess and widely known stability make the yen a popular safe haven.</li> <li><strong>Canadian Dollar (CAD):</strong> While it mostly moves in tandem with commodity prices, particularly oil, the Canadian Dollar maintains a relatively low volatility profile.</li> <li><strong>Singapore Dollar (SGD):</strong> Singapore's solid financial system and strong economy make its currency a low-volatility choice due to its stability.</li> <li><strong>British Pound Sterling (GBP):</strong> Despite occasional volatility, the pound is considered chiefly stable, supported by the United Kingdom's significant economy.</li> <li><strong>Australian Dollar (AUD):</strong> The AUD upholds relative stability, though it is subject to fluctuations caused by trade dynamics and commodity prices, particularly those involving China.</li> <li><strong>New Zealand Dollar (NZD):</strong> The NZD generally exhibits stability, although, just like the Australian Dollar, it remains susceptible to the influences of global commodity market fluctuations.</li> <li><strong>Norwegian Krone (NOK):</strong> Norway's strong economy, based on its rich natural resources like oil, supports the stability of its currency.</li> </ul> <p><img alt="EURUSD is a low volatility currency pair with Bollinger bands, RSI and RVI." src="/getmedia/18358419-c3f7-44e8-aac6-3c43e03d7080/Academy-Forex-Currency-Volatility-eurusd-is-a-low-volatility-currency-pair-with-bollinger-bands.png" /></p> <h4>Advantages of trading low-volatility currencies</h4> <p>There are many advantages to trading low-volatility currencies, and here we have listed some of these advantages that should appeal to traders who prefer low-risk trades:</p> <ul> <li><strong>Suitability for technical analysis:</strong> Because low-volatility currencies move more steadily, they fit technical analysis and chart patterns better, which could make these types of analyses more effective. You can also measure the annualised volatility of such currencies.</li> <li><strong>Enhanced risk management:</strong> Managing risk is generally more accessible with low-volatility currencies because of their predictable behaviour, facilitating a more accurate setting of take-profit and stop-loss levels.</li> <li><strong>Stability in earnings:</strong> While the profits from each trade may be smaller, they tend to be more consistent, favouring traders seeking a steady income stream over high-reward or high-risk scenarios.</li> <li><strong>Reduced risk:</strong> The smaller price movements associated with these currencies reduce the likelihood of abrupt and massive losses, which is beneficial for cautious and inexperienced traders.</li> <li><strong>Tighter spreads:</strong> Typically, low-volatility currency pairs come with tighter spreads as they are less risky for brokers to offer. This can reduce traders' trading costs.</li> <li><strong>Better for learning:</strong> Beginners in forex trading might find it easier to start with low-volatile currencies, as they offer a more lenient environment to learn and test strategies.</li> <li><strong>More suitable for beginners:</strong> Low-volatility currencies offer an ideal starting point for newcomers to forex trading, providing a more lenient environment to experiment with trading strategies and learn.</li> <li><strong>Lower capital requirement:</strong> The lower risk associated with low-volatility currencies makes it possible for traders not to need as much capital buffer as they would when trading highly volatile currencies.</li> </ul> <h4>Disadvantages of trading low-volatility currencies</h4> <p>As a forex trader, you should always understand the disadvantages associated with the assets you are trading. Here are some of the disadvantages of trading low-volatility currencies as listed below:</p> <ul> <li><strong>Limited profit potential:</strong> Low volatility generally means smaller price movements, which often translates to lower profit potential per trade, resulting in limited profit potential on individual trades. This can be a significant disadvantage for traders seeking quick, substantial gains.</li> <li><strong>Risk of excessive trading:</strong> In pursuit of more profits in low-volatility markets, traders may overtrade, initiating more positions than recommended to compensate for smaller profit margins, thus increasing their risk exposure.</li> <li><strong>False breakouts:</strong> In low-volatility markets, apparent breakout movements can frequently be a false signal, resulting in trades that don't pan out as expected.</li> <li><strong>Longer wait for returns:</strong> Because the price movements are smaller, achieving significant profits can take longer. This requires patience and a longer-term perspective, which may not align with the goals of all traders.</li> <li><strong>Extended period for profit realisation:</strong> Because the price movements are smaller, it often takes more time to accumulate decent profits. This requires patience and a long-term approach, which may not correspond with most traders' trading styles.</li> <li><strong>Complacency risk:</strong> The perceived safety of trading low-volatility currencies can lead to complacency, making traders overlook critical risk management practices.</li> <li><strong>Increased reaction to market news:</strong> Low-volatility currencies sometimes react disproportionately to significant geopolitical developments or economic announcements, increasing volatility.</li> <li><strong>Diminished effectiveness of specific strategies:</strong> Any trading style that relies on significant price movements does not work well for low-volatility currencies, as there are rarely any price movements.</li> </ul> <div class="didyouknow"> <h2>Did you know?</h2> <p>ThinkMarkets offers traders over 45 currency pairs to trade. Among these forex pairs are low-volatility and high-volatility currencies to trade based on your preferences. We also provide you with multiple tools for measuring volatility, which are incorporated into our <a href="/en/metatrader4/">MetaTrader 4</a> and <a href="/en/metatrader5/">MetaTrader 5</a> platforms and our ThinkTrader platform.</p> <p>You can access volatility tools such as the Bollinger bands, the average true range (ATR), the relative strength index (RSI), and the parabolic SAR. <a href="/en/account-types/">Open a live trading account with us</a> to trade volatile and non-volatile currencies using our volatility measurement tools.</p> </div> <h2>Tools to measure volatility</h2> <p>Volatility indicators, such as Bollinger bands, the average true range (ATR), the CBOE volatility index (VIX), the parabolic SAR, and the relative volatility index (RVI), are mainly used to measure volatility.</p> <p>Volatility indicators in trading measure the pace of price movements, irrespective of their direction. They are crucial tools for evaluating market conditions, enabling you to understand the level of risk and make better-informed decisions.</p> <p>Here are some of the leading volatility indicators used in financial markets:</p> <h3>Bollinger bands:</h3> <p>John Bollinger was the inventor of Bollinger bands. These bands consist of a middle <a href="/en/trading-academy/forex/simple-moving-averages/">SMA (simple moving average)</a> and two lines of standard deviation placed below and above the SMA. Narrow bands indicate lower volatility, while wider bands indicate greater volatility.</p> <p><img alt="EURUSD currency pair with Bollinger bands." src="/getmedia/36dffc66-60da-49ab-8951-556a3aa527e8/Academy-Forex-Currency-Volatility-eurusd-currency-pair-with-bollinger-bands.png" /></p> <h4>What makes Bollinger bands effective?</h4> <p>Bollinger bands are highly effective volatility indicators since they measure the price changes in an asset based on a simple moving average and the standard deviation. Here is why the indicator is so effective:</p> <ul> <li><strong>Adaptability to market conditions:</strong> Bollinger Bands impulsively widen when measured volatility increases and shrink when volatility decreases. The dynamic adjustment allows them to be significantly adaptable to varying market conditions.</li> <li><strong>Simple yet powerful:</strong> The bands are easy to use and understand, making them accessible to experienced and novice traders. Despite their simplicity, Bollinger bands provide powerful awareness of market behaviour.</li> <li><strong>Can identify overbought and oversold conditions:</strong> When an asset's price touches or crosses the upper Bollinger band, it is generally regarded as overbought, and when it crosses or touches the lower band, it is typically considered oversold. Touching the bands can signal potential reversal points.</li> <li><strong>Trend analysis:</strong> You can use the direction and width of the bands to help identify the momentum and direction of the trend. For example, prices usually hover around the lower or upper band during robust trends.</li> <li><strong>Price targets and stop losses:</strong> The bands can be used to set specific price targets and stop-loss orders. For example, a trader might enter a buy order near the lower band and a stop-loss order below it.</li> </ul> <h3>Average true range (ATR)</h3> <p>This indicator assesses market volatility by calculating the average distance between the low and high prices over a selected number of periods. A lower ATR indicates low volatility, while a higher ATR indicates high volatility.</p> <p><img alt="The ATR indicator on the GBPUSD currency pair." src="/getmedia/be884dbc-1fc9-4b39-b44d-7bb19e1b6dcf/Academy-Forex-Currency-Volatility-the-atr-indicator-on-the-gbpusd-currency-pair.png" /></p> <h4>What makes the average true range (ATR) effective?</h4> <p>The average true range (ATR) is an effective volatility indicator that measures the price distance an asset travels over a specific period. Here is why the indicator is so effective:</p> <ul> <li><strong>Volatility measurement:</strong> The ATR is primarily used to determine volatility. Unlike many other indicators, it does not provide a directional bias or trend predictions but is solely focused on the range of price movement.</li> <li><strong>Setting stop losses:</strong> You can use the ATR to set stop-loss orders. A popular strategy is to place stop-loss orders a specific number of ATRs away from the trade entry point. This strategy adapts to the current market volatility and prevents stops from being too close in volatile markets or too far in calm markets.</li> <li><strong>Position sizing:</strong> The ATR helps determine the appropriate position sizes. By assessing a market's volatility, traders can modify their position sizes to maintain a consistent level of risk across different trades.</li> <li><strong>Time frame flexibility:</strong> The ATR can be calculated using any time frame, making it suitable for long-term and short-term traders. Therefore, it can measure both monthly volatility and hourly volatility.</li> <li><strong>Clearer risk assessment:</strong> By measuring the current volatility, the ATR allows traders to make more informed decisions regarding the risks involved in a trade.</li> </ul> <h3>CBOE volatility index (VIX)</h3> <p>Commonly known as the markets’ "fear index," the VIX evaluates the stock market's expectation of volatility, deriving data from S&P 500 market index options. It's a key indicator for gauging market sentiment and volatility expectations. High VIX values indicate high volatility and low VIX values signal low market volatility. The VIX is commonly used as a contrarian indicator since periods of high volatility are usually followed by periods of low volatility. Mean reversion traders mainly use it.</p> <p><img alt="the CBOE Volatility Index (VIX)" src="/getmedia/5a29ef6a-5787-464b-b9ca-cd9ed6deed85/Academy-Forex-Currency-Volatility-the-cboe-volatility-index-vix.png" /></p> <h4>What makes the CBOE volatility index effective?</h4> <p>The CBOE volatility index (VIX) is a crucial volatility indicator derived from the option prices of a specific market and can be used to gauge investor fear. Here is why this indicator is so valuable:</p> <ul> <li><strong>Market sentiment gauge:</strong> the VIX is often called the market's "fear gauge" or "fear index" since it measures the expected volatility over the next 30 days. Traders regard a high VIX reading as an indicator of increased uncertainty or fear among investors, while a low VIX indicates complacency or confidence.</li> <li><strong>Forward-looking indicator:</strong> The VIX is forward-looking, unlike many other market indicators that rely on historical data. It is calculated based on option prices and reflects market expectations about volatility in the near future. Hedging tool: The VIX is extensively used for hedging purposes. During periods of market stress or when traders expect high volatility, you can use VIX-related instruments to hedge your portfolio against possible losses.</li> <li><strong>Diversification:</strong> Instruments that rely on the VIX, such as futures and options, allow traders and investors to diversify their investment portfolios since volatility can act differently than traditional fixed-income or equity assets.</li> <li><strong>Indicator of market extremes:</strong> The most extreme readings on the VIX could signal market tops or bottoms. An extremely high VIX may indicate a potential market bottom or panic selling, while a very low VIX could signal complacency and a possible market top.</li> </ul> <h3>Parabolic SAR (stop and reverse)</h3> <p>This indicator is primarily used to identify the direction of price movement but can also provide insight into volatility levels. The SAR points are close in a low-volatility market, but in a high-volatility market, they tend to be widely spread.</p> <h4>What makes parabolic SAR effective?</h4> <p>The Parabolic Stop and Reverse (SAR) is a highly effective tool in technical analysis due to multiple reasons, especially in trending markets:</p> <ul> <li><strong>Trend identification:</strong> Parabolic SAR is an excellent tool for identifying the current trend's direction. The indicator's dots are placed strategically below the price in an uptrend and above the current price in a downtrend, making it visually easy to determine the prevailing trend.</li> <li><strong>Precise entry and exit points:</strong> The Parabolic SAR indicator provides direct signals for entry and exit points. When the position of the dots switches (from above to below the price or vice versa), this could indicate a potential reversal, informing traders to enter or exit a trade.</li> <li><strong>Stop-loss placement: </strong>The Parabolic SAR can help you place trailing stop-loss orders. Once the price moves in your preferred direction, the SAR dots also tend to move, creating new stop-loss levels that go along with the price while protecting profits.</li> <li><strong>Works well in strong trends:</strong> The indicator works well in markets undergoing robust trends since it closely follows the price movements during such periods.</li> <li><strong>Ease of use:</strong> The Parabolic SAR is easy to interpret and apply, making it accessible to new and experienced traders.</li> </ul> <h3>Historical volatility (HV)</h3> <p>This metric measures the fluctuation of past market prices over a specified period. The typically annualised metric is obtained from the actual price movements over a specific past period. It gives forex traders an idea of how recently volatile a currency pair has been.</p> <h4>What makes historical volatility effective?</h4> <p>Historical volatility (HV) is an effective trading tool in financial markets for multiple reasons. Here are some reasons why traders and investors value it:</p> <ul> <li><strong>Measure of past price fluctuations:</strong> Historical volatility measures the standard deviation of previous market prices over a particular period. It offers a lucid picture of how much an asset's price has fluctuated in the past, which is crucial in understanding market dynamics.</li> <li><strong>Risk assessment:</strong> By determining how much an asset's price has moved in the past, HV helps us assess the risk associated with the asset. Typically, a higher HV signals a higher risk and possibly higher returns, while a lower HV indicates a lower risk and possibly lower returns.</li> <li><strong>Portfolio diversification:</strong> Investors can use HV to buy assets with different levels of volatility to diversify their investment portfolios, aiming for a balanced risk and return.</li> <li><strong>Option pricing:</strong> HV is critical in options trading. It is used in multiple-option pricing models to approximate the fair value of options. Based on historical price movements, traders use HV to calculate whether options are overvalued or undervalued.</li> <li><strong>Comparative analysis:</strong> HV enables traders to contrast the volatility of different or the same asset over varying periods, which helps make investment decisions.</li> </ul> <h3>Relative volatility index (RVI)</h3> <p>Resemblant to the Relative Strength Index (RSI), the RVI calculates the direction of volatility. It equates the standard deviation of lower closing prices with the standard deviation of higher closing prices over a selected period. The RVI is expressed as a value between 0 and 100. A high RVI value (above 50) signals that the recent price volatility is upward, suggesting bullish sentiment. Moreover, a low RVI value (below 50) suggests bearish sentiment, signalling that the recent price volatility is downward.</p> <h4>What makes the relative volatility index (RVI) effective?</h4> <p>The Relative Volatility Index (RVI) is an effective tool in technical analysis for several reasons, particularly in evaluating the direction of volatility. Here's why traders find it valuable:</p> <ul> <li><strong>Focus on volatility's direction:</strong> The RVI is unique in that unlike many volatility indicators, which measure the degree of volatility, the RVI mainly focuses on the direction of volatility. It helps traders understand whether the ongoing market volatility favours an upward or downward price movement.</li> <li><strong>Complement to other indicators:</strong> The RVI is used in collaboration with other indicators, particularly momentum indicators such as the Relative Strength Index (RSI). While the RSI focuses on price momentum, the RVI focuses primarily on volatility and provides a more detailed view.</li> <li><strong>Identification of overbought or oversold conditions:</strong> Like the RSI, the RVI can signal overbought or oversold conditions, focusing on volatility. A high RVI value may indicate overbought conditions (possibly bearish), and a low RVI value might signal oversold conditions (perhaps bullish).</li> <li><strong>Signal confirmation:</strong> Traders typically use the RVI to confirm the validity of signals generated by other indicators. For example, if the RVI and a momentum indicator issue a bullish signal, it might confirm a solid buying opportunity.</li> <li><strong>Smoothed volatility assessment:</strong> The RVI uses a smoothing process (usually 10 days) to filter out the short-term noise in volatility readings, which gives a clearer picture of the actual volatility trend.</li> </ul> <h3>News</h3> <p>News headlines and events can significantly affect the affected currency, with negative news having a negative impact and positive news having a positive effect. However, not all negative news hurts currencies. Sometimes, currency pairs might have the opposite reaction to news stories.</p> <h4>How economic and geopolitical news impact volatility.</h4> <p>Economic and geopolitical news can massively impact market volatility and influence the financial markets in multiple ways. High-impact economic and geopolitical news tends to impact the affected currency pair significantly and can trigger new trading opportunities.</p> <h4>Impact of economic news on market volatility</h4> <ul> <li><strong>Interest rate decisions:</strong> Central bank decisions about interest rates can trigger immediate and substantial market movements. An unexpected interest rate hike or cut could cause higher volatility, especially in the forex and stock markets.</li> <li><strong>Economic indicators:</strong> Economic releases such as GDP reports, inflation rates, employment figures, consumer confidence, and retail sales can have a significant impact on market sentiment and volatility. Stronger or weaker than estimated data can trigger rapid market responses.</li> <li><strong>Monetary policy announcements:</strong> Reports from central banks about monetary policy (like tapering or quantitative easing) can impact investor confidence and cause volatility.</li> <li><strong>Fiscal policy and regulations:</strong> Governments usually implement decisions regarding tax changes, fiscal policies, or new financial regulations, which can also affect market volatility as they could reshape the economic landscape and affect corporate profits.</li> </ul> <h4>Impact of geopolitical news on market volatility</h4> <ul> <li><strong>Political instability:</strong> Political events such as referendums, elections, political scandals, or changes in government can cause uncertainty, leading to higher volatility, especially in the affected country's currency and stock markets.</li> <li><strong>Trade negotiations and wars:</strong> News regarding trade relations, such as trade agreements, the imposition of tariffs, or trade wars, can impact global economic sentiment and fuel volatility, especially in the currency and commodity markets.</li> <li><strong>Military conflicts and tensions:</strong> Heightened military tensions, wars, or geopolitical conflicts in some key regions could lead to volatility spikes as investors look for safe-haven assets like gold, U.S. Treasury bonds, and the US dollar.</li> <li><strong>Global crises:</strong> Events like natural disasters, pandemics, or large-scale cyberattacks can have a wide-ranging impact on global markets, leading to higher volatility as investors consider the potential economic fallout</li> </ul> <p><img alt="Economic news headlines in a newspaper." src="/getmedia/02a67ec1-6de2-4eb8-bc65-85dc58f8a82d/Academy-Forex-Currency-Volatility-economic-news-headlines-in-a-newspaper.png" /></p> <h2>Trading strategies for different volatility levels</h2> <p>Multiple trading strategies can be used to trade the different volatility levels in the market. Some strategies are meant for high-volatility markets, and others are tailored for low-volatility markets. In this section, we shall delve into the strategies for high-volatility markets and those for low-volatility markets.</p> <h3>Trading strategies for high-volatility markets</h3> <p>There are two main types of high-volatility trading strategies: the trend-following strategy and the breakout strategy. These unique strategies are covered in greater detail in this section:</p> <h4>Trend-following strategy</h4> <p>Trend-following is a trading strategy based on the concept that financial markets move in specific trends over time and that such trends can be capitalised on for profit.</p> <ul> <li><strong>Identification of trends:</strong> As a trader, you can use multiple technical analysis tools, like trend lines, moving averages (MAs), and momentum indicators (such as the RSI or MACD), to determine the direction and momentum of market trends.</li> <li><strong>Long and short positions:</strong> In an upward trend, traders should take long positions, buying assets while expecting their prices to keep rising. Conversely, in a downward trend, traders should open short positions as they sell assets, expecting them to drop in value.</li> <li><strong>Trade duration:</strong> Trend-following strategies can usually involve holding positions for an extended period—several days, weeks, months, or even years. The holding duration depends heavily on how long the trend lasts.</li> <li><strong>Risk management:</strong> Trend trading usually involves a solid risk management system to protect the trader against sudden trend reversals. Traders typically use stop-loss orders and keep adjusting them as the trend progresses.</li> </ul> <h4>Breakout trading strategy</h4> <p>Breakout trading is a strategy that allows traders to enter a position once the price moves significantly, or 'breaks out,' from its prior range or pattern.</p> <ul> <li><strong>Identifying potential breakouts:</strong> Traders usually look for periods of consolidation or the formation of patterns such as flags, triangles, or pennants. A breakout is established when the price moves beyond the above patterns or range boundaries with elevated volume.</li> <li><strong>Entry points:</strong> Traders open trades in the market when the price cracks above the resistance levels (for a bullish breakout) or breaks below the support levels (for a bearish breakout).</li> <li><strong>Setting targets and stops:</strong> Breakout traders tend to set profit targets and stop-loss orders near the levels printed during the previous range. For example, the former resistance level may become a brand-new support level during a bullish breakout.</li> <li><strong>Momentum indicators:</strong> Tools like the RSI, volume indicators, and moving averages can help confirm the breakout's strength and validity.</li> </ul> <h4>Combining both strategies</h4> <p>Breakout trading and trend-following can complement each other. Breakouts most often lead to the start of new trends, which a trend-follower can exploit. You can use trend-following indicators to help filter out false breakouts, ensuring you enter positions aligning with the more dominant market trend. The two strategies can be adapted to various market conditions and applied to asset classes like forex, stocks, cryptocurrencies, and commodities.</p> <h3>Trading strategies for low-volatility markets</h3> <p>Trading in low-volatility markets can be difficult because of the smaller price movements and fewer opportunities for massive profits. However, there are two strategies traders can use to steer through such markets and likely profit in such conditions:</p> <h4>Range trading</h4> <p>A range trading strategy is based on the concept that prices tend to move within a specified range or channel. This strategy is especially effective in low-volatility markets since price movements are predictable and constrained within specific levels.</p> <p><strong>Key features:</strong></p> <p>Traders identify currency pairs trading within a specific high- and low-price band. These high and low points are the resistance and support levels, respectively. The primary idea is to enter buy trades at or near the support level and short trades at or near the resistance level.</p> <p>Tools like stochastic oscillators, Bollinger bands, and the Relative Strength Index (RSI) can help you pinpoint overbought and oversold conditions within a trading range. Setting a stop-loss order above or below the identified range can protect you from unexpected breakouts.</p> <p><strong>Suitability:</strong> This strategy works effectively in a market with no clear trend and a sideways-moving price.</p> <h4>Mean reversion</h4> <p>Mean reversion is a finance theory implying that prices will ultimately return to the average or mean. This strategy is based on the idea that, even if a currency pair moves away from its historical average, it will finally revert.</p> <p><strong>Key features:</strong></p> <p>This strategy requires you to identify the historical mean price of an asset, such as a currency pair. If the price has substantially deviated from its mean, a trader will expect that it will revert to its mean over time.</p> <p>Tools like Bollinger bands, moving averages, and standard deviation calculations are often used to identify reversion to the mean trading opportunities. This strategy typically requires you to buy when the market is low and sell when it's high by going against the current market sentiment.</p> <p><strong>Suitability:</strong> Mean reversion works well within a range-bound or oscillating market. However, it can be risky and inefficient during intense trending periods since the 'mean' itself could shift during a prolonged trend.</p> <h3>Stop losses and position size</h3> <p>Stop-loss orders and the correct position sizing are crucial to your overall success as a forex trader over the long-term. Your stop losses should be aligned with market volatility so they are neither too tight nor too wide. Your stop-loss order and the number of lots you choose to trade also affect your position size. Always stay within your risk parameters, and do not overleverage your trades.</p> <h2>Risk management for high and low-volatility currencies</h2> <p>Risk management is a major aspect of forex trading, especially when encountering various volatility levels. Effective risk management strategies and tools help traders minimise their losses and protect their profits. Here are some specific risk management approaches tailored to different volatility levels:</p> <table> <tbody> <tr> <th>Risk Management Strategies</th> <th>High-Volatility Markets</th> <th>Low-Volatility Markets</th> </tr> <tr> <th>Position Size</th> <td>Reduce position size to mitigate the risk of large price swings.</td> <td>Consider larger position sizes to compensate for smaller price movements, while staying within risk tolerance.</td> </tr> <tr> <th>Stop-Loss Orders</th> <td>Use tighter stop-loss orders to minimise potential losses from abrupt market moves.</td> <td>Place broader stop-loss orders to avoid being stopped out by minor price fluctuations.</td> </tr> <tr> <th>Trailing Stops</th> <td>Employ trailing stops to secure profits while allowing the market to move in your favour.</td> <td>It is not typically applicable due to slower price movements.</td> </tr> <tr> <th>Leverage</th> <td>Lower leverage to reduce the impact of large price swings.</td> <td>Use lower leverage despite less volatility to manage risk effectively.</td> </tr> <tr> <th>Hedging Strategies</th> <td>Use hedging techniques like options or diversifying across uncorrelated assets to protect against adverse price movements.</td> <td>Diversify into different asset classes or tradeable instruments to find more opportunities.</td> </tr> <tr> <th>Risk/Reward Ratios</th> <td>Aim for a higher reward relative to the risk due to higher chances of significant movements.</td> <td>Adjust risk/reward ratios to account for slower price changes, ensuring they align with your risk tolerance.</td> </tr> <tr> <th>Reaction to Market News</th> <td>Stay up to date with current market news and always be ready to respond quickly to geopolitical events or economic releases that could trigger volatility.</td> <td>Patience and discipline are key; stick to your strategy and avoid rushing into trades.</td> </tr> <tr> <th>Volatility Stop Losses</th> <td>Set stop losses around a percentage of the asset’s average volatility, such as using the Average True Range (ATR) to align with market volatility.</td> <td>It's not typically necessary but consider volatility when setting stop losses.</td> </tr> <tr> <th>Holding Periods</th> <td>Generally, shorter holding periods are due to rapid price changes.</td> <td>Be prepared for more extended holding periods, as price movements are slower.</td> </tr> <tr> <th>Breakouts</th> <td>Watch for significant movements and be ready to capitalise on them.</td> <td>Look for breakouts to create significant trading opportunities and be prepared to capitalise on them.</td> </tr> <tr> <th>Range Trading Strategies</th> <td>It is not typically applicable due to unpredictable large swings.</td> <td>Utilise range trading by buying near support and selling near resistance.</td> </tr> <tr> <th>Patience and Discipline</th> <td>Quick reactions are essential, but patience is needed to stick to risk management strategies.</td> <td>Low-volatility markets require patience and sticking to your trading strategy without rushing into trades.</td> </tr> <tr> <th>Diversification</th> <td>Diversify across uncorrelated assets to manage risk.</td> <td>Diversify into different asset classes or instruments that might offer more opportunities in low-volatility market conditions.</td> </tr> </tbody> </table> <h2>Conclusion</h2> <p>In summary, currency volatility refers to the magnitude and frequency of changes in the value of one currency against another within the foreign exchange (forex) market. Numerous factors, such as the release of economic data, central bank policies, geopolitical events, and market sentiment, are responsible for this volatility. High volatility in the currency markets suggests more significant and swifter fluctuations in exchange rates, while low volatility signals more stable and gradual price movements.</p> <p>Volatility awareness is crucial for successful trading since it helps traders apply the correct risk management strategies. It also allows traders to formulate the right trading strategies while timing the correct trade entry and exit prices. Volatility awareness can also help you prepare psychologically, use the proper leverage, and plan your long-term trading activities.</p> </div>

Forex economic indicators: Fundamentals, types, analysis, strategies, challenges, and applications
<div class="article__content"> <style type="text/css">.didyouknow { display: block; background: #5ee15a5e; padding: 5px 20px 20px 20px; border-radius: 10px; margin-top: 20px; } </style> <p>Economic indicators are essential in <a href="/en/forex-trading/">forex trading</a>, influencing currency pair analysis and guiding strategic decisions. This article will focus on how institutions and individual traders use forex economic indicators as a critical component of <a href="/en/trading-academy/forex/fundamental-analysis/">fundamental analysis</a> to pinpoint trading opportunities in the forex markets. Economic indicators are pivotal in the trading strategies of market participants who rely on fundamental analysis. They are essential for traders and investors who want to assess a currency's intrinsic value and market position, whether oversold or overbought.</p> <p>We will cover the fundamentals of economic, macroeconomic, and microeconomic indicators. Additionally, we will discuss the analysis and interpretation of economic indicators, trading strategies based on the same indicators, challenges and considerations, and navigating the sources of economic indicators.</p> <h2>Fundamentals of economic indicators</h2> <p>An economic indicator is a piece of economic data that analysts use to assess the overall health of an economy and identify potential investment opportunities Even though there are many economic indicators, traders and investors typically follow data released by government agencies and non-profit organisations.</p> <h3>Classification of indicators</h3> <p>Economic indicators can be broadly categorised into leading, lagging, and coincident indicators. Most of these indicators have scheduled release times, which allows traders to plan for the impact of the releases on currencies.</p> <p><img alt="Classification of indicators" src="/getmedia/2d738fd5-20ec-40e8-b9d9-6b18f9887434/Academy-Forex-economic-indicators-classification-of-indicators.png" /></p> <p>Here's a breakdown of the three types of economic indicators:</p> <h4>Leading indicators</h4> <p>Leading economic indicators are used to help predict the future direction of a country's economy. Investors typically use the following leading indicators: yield curve, net business formations, consumer durables, and share prices. The data collected by these indicators tends to move before the country's economy and can signal the future direction of the economy.</p> <p>Investor interest in leading indicators stems from their ability to accurately predict an economy's future direction. The indicators usually make broad economic assumptions, which must then be narrowed down to investment decisions about specific assets.</p> <p>Analysis of leading indicators typically relies on historical data, with the assumption that investments will perform similarly to past patterns. For example, investors may anticipate that investments will perform similarly when the yield curve reaches a certain point, as seen in the past. However, it’s important to note that these indicators can sometimes produce inaccurate signals.</p> <h4>Lagging indicators</h4> <p>A lagging indicator also known as “a trailing indicator” is typically seen after a specific economic activity has occurred. These indicators include unemployment rates, the Consumer Price Index (CPI), interest rates, and the gross national product (GNP). They are termed "lagging" because they reflect past events, often emerging after significant economic shifts.</p> <p>A significant disadvantage of lagging indicators is that strategies based on these indicators can provide delayed trade signals due to their lagging nature. Despite the risk of outdated information, many governments and institutions rely on these indicators for their decisions.</p> <h4>Coincident indicators</h4> <p>Coincident indicators, such as employment figures, gross domestic product (GDP), and retail sales reflect current economic activities. They provide real-time insights into the economy, allowing policymakers and investors to make informed decisions based on the present economic climate.</p> <p>Coincident indicators can be more useful to investors than lagging and leading indicators since they reveal what is happening now.</p> <h3>Impact of forecasting and real-time analysis in forex trading</h3> <p>Forex forecasting and real-time analysis are useful for helping traders predict future price trends, leading to more informed decisions and potential for consistent profitability.</p> <p>Consistency in trading strategy is essential for long-term success, and reliable forecasting provides a structured approach to maintaining this consistency. Real-time analysis, on the other hand, allows traders to monitor market movements as they occur, enabling timely and strategic trade placements.</p> <p>For short-term traders, up-to-the-minute information is vital, and real-time analysis ensures they can swiftly respond to market changes and potentially benefit from sudden price fluctuations.</p> <h3>How economic indicators affect currency valuations and investor sentiment</h3> <p>Economic indicators are crucial for arriving at currency valuations using fundamental analysis. For example, upbeat GDP data indicating robust economic growth may positively impact a currency's valuation. Conversely, high inflation or unemployment rates may have a negative impact. Therefore, currency valuations rely heavily on a country's economic indicators, and determine investor sentiment.</p> <h2>Macroeconomic indicators</h2> <p>Macroeconomic indicators are statistical reports or economic data that reflect the economic conditions of a specific country, sector, or region. Analysts, traders, investors, and governments use this data to analyse a country's economic future, as well as its current health and financial markets.</p> <p>Macroeconomic indicators are a crucial component of fundamental analysis since they can significantly impact a currency's value. This is especially true when the macro report deviates from analysts' consensus estimates.</p> <p><img alt="Overview of macroeconomic indicators." src="/getmedia/07f3dd95-ae90-4a28-9468-1140aa2dc481/Academy-Forex-economic-indicators-overview-of-macroeconomic-indicators.png" /></p> <p>Here is a detailed review of some of the crucial macroeconomic indicators tracked by investors and traders.</p> <h3>Gross domestic product (GDP)</h3> <p>A country's gross domestic product (GDP) calculates the entire value of services and goods produced by the country. It is also a crucial indicator of the overall health of a country's economy and financial markets, indicating whether the economy is growing, stagnating, or shrinking. A growing economy usually has a rising GDP growth rate, which boosts the value of its currency, as investors expect economic growth. However, a stagnating economy will have a stagnant GDP growth rate. Furthermore, a shrinking economy typically has a declining GDP growth rate, which could lead to the devaluation of its currency.</p> <h3>Unemployment rates</h3> <p>A country's unemployment rate measures the number of jobs available compared to the number of jobseekers. It is a crucial indicator of an economy's health. A low unemployment rate usually indicates a robust and healthy economy, while a high unemployment rate typically reveals a weak economy. Therefore, the unemployment rate has an inverse relationship with a currency's strength, with a high rate leading to a weaker currency and a low rate leading to a much stronger currency.</p> <h3>Inflation indices (CPI and PPI)</h3> <p>Inflation indices like the consumer price index (CPI) and the producer price index (PPI) measure the rate of change in consumer and producer prices. They also play a crucial role in determining a currency's valuation and exchange rate. Generally, a high inflation rate can weaken a currency's valuation as its purchasing power is diminished. On the other hand, a low inflation rate can lead to a stronger currency as its buying power increases, although this is only sometimes guaranteed.</p> <h3>Central bank interest rates</h3> <p>Central banks' interest rates determine investors' returns from holding investments in a country's currency. Along with other monetary policies, they are critical in a currency's valuation. When a central bank raises interest rates, it will likely attract more investment into the country as investors seek higher returns. Reducing interest rates could trigger the opposite effect on a currency since it may trigger a capital flight from investors to other countries with high rates.</p> <p>Furthermore, other monetary policies, such as quantitative easing (QE), also play a crucial role in a currency's valuation. QE increases the amount of money in circulation and may lower a currency's valuation. At the same time, quantitative tightening (QT) reduces the money in circulation and could boost its valuation.</p> <h3>Balance of trade</h3> <p>A country's trade balance calculates the difference between the values of its imports and exports. A positive trade balance shows that the value of a nation’s exports is more significant than its imports. In contrast, a negative trade balance reveals that a nation’s imports are of greater value.</p> <p>Countries with negative trade balances tend to have weaker currencies than those with positive ones. This is because a country earns foreign currency from its exports and spends foreign currency when buying imports. Therefore, a positive trade balance indicates that a country has earned more foreign currency than it spent, which boosts the value of its currency and vice versa.</p> <h3>Consumer confidence and sentiment indices</h3> <p>Consumer confidence and sentiment indices measure consumers' overall outlook on their financial circumstances and attitude towards a country's economic future. A high consumer confidence print can boost a country's currency since it shows that consumers are confident in their financial futures. In contrast, a low consumer confidence print has the opposite effect.</p> <p>The same reasoning applies to consumer sentiment indicators, which measure consumers' confidence in their country's economic future. High consumer sentiment indicates significant confidence in a nation's financial future, which could bolster its currency. On the other hand, poor consumer sentiment has the opposite impact on a currency because it stems from a lack of confidence in a nation's economic future.</p> <h2>Microeconomic indicators</h2> <p>Microeconomic indicators are data points and statistics focusing on individual sectors’ economic performance and behaviour. They explain how businesses, households, and industries have performed in a specific country or region. Microeconomic indicators differ from macroeconomic indicators, because they focus on individual sectors and companies rather than the economy as a whole. Here are some examples of critical microeconomic indicators:</p> <p><img alt="Microeconomic indicators." src="/getmedia/6376a157-431f-41b8-a075-d05d279b5b1f/Academy-Forex-economic-indicators-microeconomic-indicators.png" /></p> <h3>Company health reports</h3> <p>Company health reports showcase the performance and health of a specific company based on metrics such as revenues and profits. The performance of companies can provide a robust signal regarding the strength of a country’s currency. For instance, when firms in a country do well and report rising profits, their currency will likely perform positively. In contrast, the economy is weakening if companies do badly and report losses, which leads to a weaker currency.</p> <h3>Stock market performance</h3> <p>The stock market's performance is a compilation of each company's overall performance listed on that exchange or index. It is usually closely correlated with the performance of a country's economy since it affects investors' returns. A stock market that is performing well is likely to attract more investors to buy shares in the listed companies, which increases demand for a country's currency.</p> <p>The opposite is true when a stock market falls, as companies' stock prices fall. This decline could trigger capital flight as traders and investors liquidate their shares and exit the market. This would lead to an oversupply of the country's currency, lowering its valuation.</p> <h3>Commodity prices</h3> <p>Commodity prices refer to the buying and selling prices of commodities like gold, oil, silver, sugar, and wheat. Most countries are either net importers or exporters of commodities. Countries that export commodities benefit from higher prices as higher commodity prices would likely boost their currency, while countries that import commodities are disadvantaged if prices rise as it weakens their currency.</p> <h3>Retail sales data</h3> <p>Retail sales data refers to the retail shopping trends of most consumers over a specific period, such as a month, a quarter, or a year. Retail sales are a crucial indicator of a country's economic health because they track consumer spending patterns and behaviours. When consumers feel confident about their finances, they spend more, resulting in a surge in retail sales. However, when consumers are unsure about their financial futures, they are more likely to cut back on unnecessary spending, negatively affecting retail sales. High inflation could also impact consumer retail spending due to reduced disposable incomes.</p> <h3>Housing market statistics</h3> <p>Housing market statistics are indicators that track the health of the housing sector in a country, such as:</p> <ul> <li>Home prices</li> <li>Home sales</li> <li>Housing starts and building permits</li> <li>Mortgage rates and applications</li> <li>Construction spending</li> </ul> <p>The housing market has a critical role in a country's economy; as such, positive housing data paints a positive picture of the country's economy and boosts its currency. The opposite is true of negative housing data, which tends to hurt a country's currency and could weaken it in the process.</p> <h3>Monetary policy meeting minutes</h3> <p>Monetary policy meeting minutes document what happens between central bank policymakers during deliberations on how to set interest rates in a country or region. Investors analyse the minutes to identify whether most central bank policymakers have a bullish or bearish economic outlook. Meeting minutes interpreted as bullish on the economy usually tend to boost the country's currency, while meeting minutes that paint a negative picture of the economy tend to affect its currency negatively.</p> <div class="didyouknow"> <h2>Did you know?</h2> <p>ThinkMarkets provides traders with a detailed <a href="/en/economic-calendar/">economic calendar</a> to help them monitor all the high-impact economic indicators released daily. The calendar can be used to plan trades and get the most out of your trading strategy. You can also trade in over 45 currency pairs based on relevant economic indicators. <a href="/en/account-types/">Open a live trading account</a> to experience all the benefits we offer.</p> </div> <h2>Analysis and interpretation of economic indicators</h2> <p>Economic indicators are statistical data that explain a country's economic performance. Through analysis and interpretation, analysts, traders, and investors can arrive at conclusions regarding their impact on a country's economy and, by extension, the value of its currency. Due to their distinctive attributes, different types of indicators are analysed differently.</p> <p><img alt="Analysis and interpretation of economic indicators." src="/getmedia/fe88455c-d1d3-4fbf-baa3-770ff03e925a/Academy-Forex-economic-indicators-analysis-and-interpretation-of-economic-indicators.png" /></p> <h3>Analytical techniques</h3> <p>Some analytical techniques for analysing and interpreting economic indicators include time series analysis, regression analysis, econometric modelling, correlation analysis, and hypothesis testing. Analysts and financial professionals typically use these techniques to produce market analysis, so investors typically have no need to understand them in depth. Charting is also a powerful way for investors to track changes in specific economic indicators over time. It allows them to make informed trading decisions.</p> <h3>Lagging vs. leading indicators</h3> <p>Leading indicators are forward-looking and tend to change before the economy changes, providing a forecast of future economic activity. They are typically used to predict the future direction of an economy. Therefore, investors shiuld be aware of the role of leading indicators, such as new housing starts, consumer confidence, stock market returns, and durable goods orders.</p> <p>Lagging indicators, in contrast, change after the economy does, confirming current trends. They help confirm long-term trends, but they are not predictive. Lagging indicators like corporate profits, the unemployment rate, the consumer price index (CPI), and interest rates play different but equally important roles in economic indicator analysis.</p> <h3>Combining indicators</h3> <p>Combining macroeconomic and microeconomic indicators provides a comprehensive market overview by offering a detailed perspective of the overall economic environment. This holistic approach helps investors, analysts, and policymakers make informed decisions by evaluating the correlation between general economic trends and their impact on a micro-level. Here's how to combine micro and macroeconomic indicators for comprehensive market analysis.</p> <h4>Steps for comprehensive market analysis</h4> <ul> <li><strong>Start from the macro perspective:</strong> identify the current phase of the economic cycle via macroeconomic indicators. For example, a high GDP growth rate and low unemployment might signal an expanding economy, while a high inflation rate could suggest overheating.</li> <li><strong>Analyse the micro-factors:</strong> once you have understood the broader economic conditions, you can then assess microeconomic indicators to see how individual markets and sectors respond. For example, the macro indicators may signal rising inflation, while microanalysis may show that some businesses pass higher costs to consumers.</li> <li><strong>Sector and industry analysis:</strong> macroeconomic indicators can be used to assess the performance and prospects of specific sectors and industries. You can analyse market share distribution, industry growth, and technological advancements.</li> <li><strong>Company-level analysis:</strong> you can evaluate specific companies within the context of the economy and their sector as well as examine the company's competitive positioning, financial health, and growth prospects.</li> <li><strong>Consumer behaviour and demographics:</strong> analyse trends in consumer behaviour and demographic shifts. Macro indicators such as consumer confidence surveys and spending patterns can provide insights into future demand in specific markets.</li> <li><strong>Cross-analysis for strategic insights:</strong> integrate your findings from macro and micro analyses to identify market risks and opportunities. For instance, a macroeconomic trend towards renewable energy might create opportunities in micro sectors like electric vehicles and solar panel manufacturing.</li> </ul> <p>Therefore, you can combine macroeconomic and microeconomic indicators to analyse the financial markets comprehensively.</p> <h2>Strategies for trading based on economic indicators</h2> <p>Basing trades on economic indicators requires a trading strategy that factors in market expectations, integrates fundamental and technical analysis as well as trade timing. Here are several tactical approaches you can use to trade based on economic indicators.</p> <p><img alt="Trading Strategies based on economic indicators." src="/getmedia/b3cfe7d0-f6bd-4954-a4c2-7e77cfa11e7f/Academy-Forex-economic-indicators-trading-strategies-based-on-economic-indicators.png" /></p> <h3>Anticipate market reactions</h3> <ul> <li><strong>Understand market expectations:</strong> before an economic indicator is released, you must understand what the market expects. You can find this information on financial news and analysis outlets. Significant price moves could occur if the data deviates from market expectations.</li> <li><strong>Track high-impact indicators:</strong> you should focus on monitoring economic indicators that significantly impact markets, such as unemployment rates, GDP growth rates, inflation data (CPI), and central bank decisions. These indicators have a greater chance of triggering volatility and creating trading opportunities.</li> </ul> <h3>Trade the news</h3> <ul> <li><strong>Immediate reaction:</strong> some traders target capitalising on the immediate volatility that follows a news release. This requires you to have a detailed understanding of the expected results along with ultra-fast execution.</li> <li><strong>Wait for confirmation:</strong> alternatively, you can wait for the market to interpret the news and look for confirmed trends before entering a trade. This strategy is less risky than immediate trading.</li> </ul> <h3>Use the economic calendars</h3> <ul> <li><strong>Planning and preparations:</strong> you should use the economic calendar to keep abreast of upcoming releases. Plan your trading strategy, including whether you want to trade before, immediately after, or sometime after the news release.</li> <li><strong>Impact analysis:</strong> constantly analyse the potential impact of an economic indicator as indicated in the economic calendar. You can use this information to determine potential market reactions and plan your trades accordingly.</li> </ul> <h3>Incorporate technical analysis</h3> <ul> <li><strong>Support and resistance levels:</strong> before trading economic news releases, identify critical support and resistance levels to help you spot the best entry and exit points.</li> <li><strong>Technical indicators</strong>: use technical analysis indicators like moving averages, RSI (relative strength index), and MACD (moving average convergence divergence) to confirm trends suggested by economic indicators.</li> </ul> <h3>Risk management and new economic data</h3> <ul> <li><strong>Stop-loss orders:</strong> always use stop-loss orders to manage your risk exposure, especially when trading around volatile events like economic releases.</li> <li><strong>Position sizing:</strong> adjust your trade size based on the volatility you expect from an economic release. Higher volatility may require smaller position sizes to manage risk.</li> </ul> <h3>Case studies showcasing practical application of economic indicator analysis</h3> <p>The forex market is vulnerable to economic indicators since they reflect a country's economic health, which impacts its central bank policies and affects currency values. Below are two case studies showcasing the practical application of economic indicator analysis in forex trading:</p> <h4>Case study 1: trading the EUR/USD pair around ECB monetary policy announcements</h4> <p><strong>Background:</strong> A forex trader trades the EUR/USD currency pair, which is particularly sensitive to the European Central Bank's (ECB) monetary policy decisions and U.S. economic indicators.</p> <p><strong>Strategy:</strong></p> <ul> <li>The trader closely tracks the ECB's interest rate decisions and press conferences for clues regarding future monetary policies.</li> <li>They also pay attention to U.S. economic indicators, primarily the Non-Farm Payroll (NFP) report, inflation data (CPI), and GDP growth rates.</li> </ul> <p>By analysing these indicators, the trader aims to predict the future direction of the EUR/USD pair. For example, suppose the ECB indicates it will tighten monetary policy, and the U.S. economic data is weaker than expected. In that case, the trader expects the EUR to strengthen against the USD.</p> <p><strong>Execution:</strong></p> <ul> <li>Ahead of an ECB announcement, the trader observed that the eurozone's inflation was rising faster than expected, suggesting potential ECB monetary tightening.</li> <li>Simultaneously, the U.S. released weaker-than-expected GDP growth data, signalling a potential economic slowdown.</li> <li>The trader decides to buy or go long for the EUR/USD, expecting the EUR to appreciate against the USD.</li> </ul> <p><strong>Outcome:</strong></p> <ul> <li>The ECB announced a more hawkish stance than the market expected, while the U.S. economic outlook showed weakness.</li> <li>The EUR/USD pair rose massively following these developments, and the trader pocketed a substantial profit by anticipating the market movement correctly.</li> </ul> <h4>Case study 2: leveraging Australian employment data for AUD/JPY trades</h4> <p><strong>Background:</strong> another trader specialises in the AUD/JPY pair, focusing on the correlation between Australia's employment data and the performance of the Japanese yen, which is often regarded as a safe-haven currency.</p> <p><strong>Strategy:</strong></p> <ul> <li>This trader analyses Australia's employment reports, knowing that positive job growth could lead to the appreciation of the AUD because of increased expectations of economic strength and potential interest rate hikes by the Reserve Bank of Australia (RBA).</li> <li>They also monitor global risk sentiment. Because of its safe-haven status, the JPY tends to strengthen during market uncertainty.</li> </ul> <p><strong>Execution:</strong></p> <ul> <li>Noticing the upcoming release of Australian employment data, the trader analyses forecasts suggesting robust job growth.</li> <li>Given the lack of significant global risks or market uncertainties that could strengthen the JPY, the trader chooses to go long on the AUD/JPY, anticipating that the AUD will strengthen.</li> </ul> <p><strong>Outcome:</strong></p> <ul> <li>The employment data massively exceeded expectations, suggesting robust economic health in Australia.</li> <li>With no significant global risks emerging, the AUD rallied against the JPY as expected, allowing the trader to profit from the trade.</li> </ul> <h2>Challenges and considerations</h2> <p>There are multiple challenges that traders and investors face when interpreting the impact of economic indicators on market movements. Here are some of the challenges they face:</p> <h3>Market interpretation challenges </h3> <p>Markets can react unpredictably when economic news is released, making it quite challenging to interpret the future direction of an asset or a market after a news release. The context of the news, market expectations, the interconnectedness of global economies, and investors' psychological tendencies all impact how unpredictable market reactions are.</p> <ul> <li><strong>The news context:</strong> this refers to the broader economic context in which the news is received. For example, unemployment data in a weak economy might impact the country's currency valuation negatively.</li> <li><strong>Market expectations:</strong> market participants always try to predict the essence of an economic report before it is released. If the news report aligns with expectations, it could lead to a muted reaction. However, if the news deviates from expectations, there could be a significant price reaction.</li> <li><strong>Psychological behaviours:</strong> in most cases, investors tend to follow other investors when making investment decisions instead of relying on their analysis. Market sentiment can also significantly impact investors' reactions to a news release.</li> </ul> <h3>Geopolitical and global crisis impacts</h3> <p>Geopolitical events and global crises significantly impact the forex (foreign exchange) markets, influencing currency values in unpredictable and complex ways. Here are some external factors that influence forex markets:</p> <ul> <li><strong>Political instability and wars:</strong> political instability in a country typically leads to the deterioration of its economy and the devaluation of its currency due to capital flight as investors flee the country, dumping their investments and creating oversupply in the country's financial markets.</li> <li><strong>Trade wars and economic sanctions:</strong> trade wars and economic sanctions tend to interrupt trade flows, which could weaken the economies of countries that rely on exporting products. A weak economy can then lead to the depreciation of a country's currency in the face of sanctions and trade barriers.</li> <li><strong>Global pandemics:</strong> global pandemics can create a risk-off market sentiment that can cause investors to flee other currencies as they pile into safe-haven currencies such as the USD, JPY, and CHF. These three currencies could then appreciate at the expense of different currencies.</li> </ul> <h3>Staying informed</h3> <p>Staying informed in the forex market is crucial since you must keep track of the release of economic indicators to time your trades accordingly. For news traders, it is essential to keep track of when key economic indicators will be released to get into position ahead of the announcement. For long-term traders who rely on something other than economic releases to inform their decisions, keeping track of economic releases can still help them manage their trades successfully.</p> <p>For example, traders can widen their stop-loss orders in periods of high volatility after significant economic news releases. Keeping track of an economic calendar is one of the best ways to continually monitor the release of macro- and microeconomic indicators. ThinkMarkets provides its clients with an economic calendar, helping them track economic releases on their trading platforms.</p> <h2>Navigating economic indicator sources</h2> <p>Accessing and interpreting economic indicators is crucial for financial market participants, especially regarding forex trading. Currency values tend to fluctuate significantly based on economic data releases. An economic calendar and official statistical releases are crucial for long-term market success. Here is how you can effectively use these resources.</p> <h3>Understanding economic calendars</h3> <ul> <li><strong>Select a reliable economic calendar:</strong> thousands of economic calendars are available, and choosing one that is reliable is crucial to your success in the markets. The best calendars are timely, comprehensive, and customisable.</li> <li><strong>Customise it based on your trading strategy:</strong> most economic calendars allow you to filter events based on country, type of indicator, and economic impact. You can customise the calendar to reflect the currencies you trade and the indicators that apply to your trading strategy.</li> <li><strong>Understand the impact level:</strong> economic indicators usually include a rating an indicator’s expected impact on the market: low, medium, or high. Focusing on high-impact news events that could trigger significant market movements would be best.</li> <li><strong>Expect volatility:</strong> high-impact news events could lead to increased volatility. You should always be ready to adjust your trading strategy based on the news. You must also decide whether to trade the news or wait for markets to stabilise.</li> </ul> <h3>Utilising economic releases</h3> <p><strong>Know the official sources:</strong> Identify the government and multinational bodies that track and release the economic indicators relevant to your trading strategies. For example, the U.S. Federal Reserve makes the country's monetary policy decisions, while the Bureau of Labor Statistics releases employment data.</p> <ul> <li><strong>Track the release schedules:</strong> most organisations have a schedule for data release times. To stay ahead, add these dates to your trading calendar.</li> <li><strong>Read the entire report:</strong> most official releases tend to have detailed analyses and reports, not just the key figures reported by most news outlets. You should read the whole document to understand the context and subtleties of the data.</li> <li><strong>Monitor revisions and updates:</strong> some economic news releases are often revised as more data becomes available. You should keep track of the revisions since they can significantly change market perceptions.</li> </ul> <p>You can access economic indicators via the economic calendars provided by many brokers or other financial news outlets. You should constantly monitor the economic releases relevant to your trading strategy.</p> <h2>Conclusion</h2> <p>In summary, forex economic indicators play a crucial role in helping traders and investors create well-informed trading strategies. There are three types of indicators: lagging, leading, and coincidence. The lagging indicators change after an economy changes, while the leading indicators change before the economy changes. Other major classifications of indicators include macroeconomic and microeconomic indicators. Traders must learn how to analyse and interpret economic indicators and use strategies based on those indicators, as outlined above. Traders should also practise continuous learning and adapt to the dynamic forex market landscape to properly use economic indicators.</p> </div>
Weighted Moving Average (WMA): Fundamentals, Comparison, Formula, Strategy, Shortcomings & Examples
<div class="article__content"> <style type="text/css">.didyouknow { display: block; background: #5ee15a5e; padding: 5px 20px 20px 20px; border-radius: 10px; margin-top: 20px; } </style> <p>The weighted moving average (WMA) is a moving average that places greater weight on recent data as it is more relevant than data from the past. The WMA is a technical analysis tool that helps traders calculate the average price of a security over a specific period using moving averages, which smooth out noisy price fluctuations and provide a clearer indication of market trends. The WMA is beneficial in determining trend direction, and some claim it is more accurate than the simple moving average (SMA) due to its higher sensitivity to recent prices.</p> <p>The WMA is used similarly to other moving averages in <a href="/en/forex-trading/">forex trading</a>, where traders look for crossovers, either above or below the indicator, to act as trade signals. If the price crosses above the WMA line, it indicates that a bullish trend may have begun, while if it crosses below the WMA line, it could signal a bearish trend.</p> <p>This article will analyse the WMA indicator in depth, compare it to other moving averages, show its calculation, interpret its readings, discuss its application in trading strategies, explain its limitations and considerations, and discuss the WMA indicator’s pros and cons.</p> <h2>What is WMA?</h2> <p>The WMA is a more sensitive moving average. Due to the higher weighting of the most recent data points, it tends to react much faster to price changes than the simple moving average. The WMA differs from the simple moving average (SMA), which assigns equal weighting to each data point regardless of when it was recorded, giving less weight to past data points.</p> <p>You can calculate the WMA by multiplying each data point by a specific weighting factor. However, the sum of the weighting factors attached to each data point should always add up to 1 if they are fractions or 100% if they are percentages. The WMA is more responsive at identifying short-term trend direction than the SMA.</p> <p><img alt="AUD/USD daily chart with 20-period WMA." src="/getmedia/ba981785-4cf3-493d-a440-ebf0b5f8b6c9/Academy-Forex-Weighted-Moving-Average-AUDUSD-daily-chart-with-20-period.png" /></p> <h2>Comparison with other moving averages</h2> <h3>Differences between the WMA, SMA, and EMA</h3> <p>Below is a table detailing the many differences between the three types of moving averages: the weighted moving average (WMA), the <a href="/en/trading-academy/forex/simple-moving-averages/">simple moving average (SMA)</a>, and the <a href="/en/trading-academy/forex/exponential-moving-averages/">exponential moving average (EMA)</a>.</p> <table> <tbody> <tr> <th><strong>Feature</strong></th> <th><strong>Simple Moving Average (SMA)</strong></th> <th><strong>Exponential Moving Average (EMA)</strong></th> <th><strong>Weighted Moving Average (WMA)</strong></th> </tr> <tr> <th><strong>Calculation Method</strong></th> <td>Average of prices over a specified period.</td> <td>The weighted average has more weight on recent prices.</td> <td>Weighted average with linearly decreasing weights.</td> </tr> <tr> <th><strong>Formula</strong></th> <td>SMA = Sum of prices/ Number of periods.</td> <td>EMA = Price x (2/n+1) + Previous EMA x {1-(2/n+1)}</td> <td>WMA = Sum (Weight x price) / sum of weights</td> </tr> <tr> <th><strong>Weighting</strong></th> <td>Equal weighting for all prices.</td> <td>Exponential weighting with more emphasis on recent prices.</td> <td>Linearly decreasing weighting, more emphasis on recent prices.</td> </tr> <tr> <th><strong>Responsiveness</strong></th> <td>Less responsive to recent price changes.</td> <td>More responsive to recent price changes.</td> <td>Balanced responsiveness between SMA and EMA.</td> </tr> <tr> <th><strong>Lag</strong></th> <td>A higher lag means a slower reaction to price changes.</td> <td>Lower lag means a faster response to price changes.</td> <td>Moderate lag, less than SMA but more than EMA.</td> </tr> <tr> <th><strong>Complexity</strong></th> <td>Simple to calculate and understand.</td> <td>It is more complex due to the exponential factor.</td> <td>Moderately complex due to weighted calculation.</td> </tr> <tr> <th><strong>Use Case</strong></th> <td>Suitable for identifying long-term trends.</td> <td>It is ideal for short-term trading and quick trend identification.</td> <td>Suitable for balanced trend detection.</td> </tr> <tr> <th><strong>Sensitivity to Price Movements</strong></th> <td>All data points are considered equally important.</td> <td>More sensitive to recent price movements.</td> <td>Moderately sensitive to recent price movements.</td> </tr> </tbody> </table> <p>This table compares the three moving averages, highlighting their key differences and use cases in trading and technical analysis.</p> <h3>Advantages of the WMA in specific market conditions</h3> <p>The weighted moving average (WMA) has unique advantages in various market conditions because of its special weighting methods, as discussed below:</p> <h4>Trending markets</h4> <p>Due to its decreasing weighting of past price data, the WMA is more responsive to price changes during a trending market than the simple moving average. By calculating the average price movement over a specified number of periods, the WMA helps identify trends more effectively. Therefore, it is suitable for traders looking to react quickly to potential trend changes as part of their trading strategies.</p> <p>During a sustained uptrend or downtrend, the WMA can help you enter and exit trade positions more effectively than the SMA by providing much faster trade signals in the current trend’s direction.</p> <h4>Volatile Markets</h4> <p>Sharp price movements usually characterise volatile market conditions. The WMA tends to respond much faster to price movements, so it can help traders capitalise on them, unlike the SMA, which reacts much slower. The WMA's faster reactions can help you limit your losses and profit from short-term movements.</p> <p>The WMA can offer timely trade signals in highly volatile markets, such as after the Fed rate decision or during earnings season.</p> <h4>Intermediate trends detection</h4> <p>The WMA's price sensitivity is less potent than that of the EMA but is more powerful than that of the SMA; hence, it strikes a balance between the two indicators. This means it can quickly identify intermediate trends that are not easily visible when using the SMA.</p> <p>The WMA can help you identify intermediate trends in markets where they are prevalent, such as a sideways-trending market with periodic breakouts.</p> <p><img alt="WMA with intermediate trend detection." src="/getmedia/ecd1286c-c5f8-4df5-bac8-95af8d3b2174/Academy-Forex-Weighted-Moving-Average-WMA-with-intermediate-trend-detection.png" /></p> <h4>It is smoother than the EMA</h4> <p>The exponential moving average (EMA) is more responsive to price movements than the WMA; hence, it can generate numerous signals, especially during choppy market conditions, leading to many false signals. On the other hand, the WMA has a smoother trendline than the EMA, reducing the incidence of whipsaws.</p> <p>The WMA can help eliminate some market noise during choppy or consolidating periods when the price moves within a narrow range, providing clearer trend continuation or reversal signals.</p> <div class="didyouknow"> <h2>Master trading with the WMA</h2> <p>You can master trading using the Weighted Moving Average (WMA), which is a crucial indicator ThinkMarkets offers its clients. You can access the WMA indicator via any of the three trading platforms we offer: MetaTrader 4, MT5, and ThinkTrader. <a href="/en/account-types/">Open a live trading account</a> to trade the over 4,000 assets we offer to traders in the financial markets.</p> </div> <h2>The weighted moving average formula</h2> <p>The weighted moving average (WMA) assigns a different weight to each data point, with the most recent data having the highest weight, which decreases linearly with older data. This makes the WMA more sensitive to recent price movements.</p> <p>WMA formula = ∑(Weight × Price) / ∑(Weights)</p> <h2>Interpreting the weighted moving average</h2> <h3>Identifying market trends using WMA</h3> <h4>Trend direction:</h4> <ul> <li>The WMA signals an uptrend when it consistently rises and the price remains above it. The WMA's fast response to price movements makes it easy to identify the beginning of a new uptrend.</li> <li>On the contrary, when the price falls, and the WMA is consistently above it, this signals a downtrend. The WMA's emphasis on recent price movements makes it easy to identify a budding downtrend.</li> </ul> <h4>Trend strength:</h4> <ul> <li>The steepness of the WMA can signal the strength of a trend. A sharply rising WMA typically indicates a robust uptrend, while a steeply falling WMA typically signals a strong downtrend.</li> <li>Comparing short-term WMAs with longer-term ones can help identify the strength of a trend. For example, when the 10-period WMA is consistently above the 50-period WMA, it signals a robust uptrend.</li> </ul> <h3>Recognising support and resistance levels</h3> <h4>Support levels</h4> <ul> <li>The WMA can act as a dynamic support level in an uptrend. If the price keeps bouncing off the WMA whenever it pulls back to the indicator, it signals that it is acting as support.</li> <li>The WMA's importance as a dynamic support level increases if it coincides with levels that have acted as support in the past when the price failed to break through them.</li> </ul> <p><img alt="WMA acts as dynamic support in an uptrend." src="/getmedia/e5f671d8-3a52-4baa-8f56-0883953e08b6/Academy-Forex-Weighted-Moving-Average-WMA-acts-as-dynamic-support-in-an-uptrend.png" /></p> <h4>Resistance levels</h4> <ul> <li>The WMA can act as dynamic resistance in a downtrend. If the price keeps falling upon touching it in a downtrend, the indicator acts as a dynamic resistance.</li> <li>Like with support, the significance of the WMA acting as resistance increases if it is aligned with levels where the price failed to break above in the past.</li> </ul> <p><img alt="20-period WMA acting as dynamic resistance in a downtrend." src="/getmedia/f91e5126-7218-41af-9c27-31a7bb4f3a3f/Academy-Forex-Weighted-Moving-Average-20-period-WMA-acting-as-dynamic-resistance-in-a-downtrend.png" /></p> <h3>Understanding crossover signals and their implications</h3> <h4>Single WMA crossover with price:</h4> <ul> <li><strong>Bullish signal:</strong> When the price breaks above the WMA, it may signal the beginning of a new uptrend and generate a buy signal.</li> <li><strong>Bearish signal:</strong> When the price breaks below the WMA, it signals that a new downtrend is about to begin and generates a sell signal.</li> </ul> <h4>Multiple WMA crossovers:</h4> <ul> <li><strong>Golden cross:</strong> A bullish signal is generated whenever a shorter WMA, such as the 50-period, crosses above a longer WMA, such as the 200-period. The golden cross signals a potential long-term uptrend.</li> <li><strong>Death cross:</strong> A bearish signal is generated whenever a shorter WMA crosses below a longer WMA. This typically signals the beginning of a long-term downtrend.</li> </ul> <p><img alt="The 50-period and 20-period WMA crossovers." src="/getmedia/3774ce31-743a-4665-b5c4-95e09e2e9964/Academy-Forex-Weighted-Moving-Average-The-50-period-and-20-period-WMA-crossovers.png" /></p> <h3>Confirming signals</h3> <p>You can confirm the reliability of the crossover signals by combining them with other technical indicators, such as the MACD (moving average convergence divergence) and the RSI (relative strength index). For instance, if the price crosses above the WMA and the RSI rises above 50, it confirms a strong bullish trend.</p> <h3>Practical example</h3> <h4>Identifying the trend</h4> <p>For example, you analyse a currency pair with a 20-period WMA. The currency pair is consistently above the rising WMA, signalling an uptrend. You then consider long positions.</p> <h4>Recognising support</h4> <p>When the price pulls back, it consistently touches the 20-period WMA and bounces back several times. You recognise this as a robust support level and place your buy orders near the WMA.</p> <h4>Crossover signal</h4> <p>The price crosses above the 50-period WMA, triggering a bullish signal. To confirm, you checked the MACD and found a bullish signal. Based on the combined signals, you then enter a long position.</p> <h2>Application in trading strategies</h2> <h3>Integrating the WMA in short-term and long-term trading strategies</h3> <h4>Short-term trading strategies</h4> <ul> <li><strong>Scalping:</strong> Scalpers can utilise the WMA to pinpoint quick entry and exit points. The 5-period or 10-period WMA can be especially useful in capturing short-term price movements. For instance, you can enter a trade when the price crosses above the WMA and exit when the price crosses below the WMA.</li> <li><strong>Day trading:</strong> Day traders can utilise the WMA to follow and take advantage of intraday trends. Combining short-term WMAs, such as the 10-period and 20-period, can help pinpoint the best trade entry and exit points. You can then use the crossover strategy, where the shorter-period WMA crossing above a longer-period WMA signals a buy, while a cross below signals a sell.</li> </ul> <p><img alt="Utilising the 10- and 20-period WMAs for day trading on the 15-minute chart" src="/getmedia/c23800f9-45c3-4761-8178-df48b70ff226/Academy-Forex-WMA-utilising-the-10-and-20-period-wmas-for-day-trading-on-the-15-minute-chart.png" /></p> <h4>Long-term trading strategies</h4> <ul> <li><strong>Swing trading:</strong> Swing traders can use medium-term WMAs, such as the 50-period, to follow trends for several days or weeks. For example, you can enter a bullish trade when the price crosses above the 50-period WMA and exit the trade when it crosses below it.</li> <li><strong>Position trading:</strong> Position traders focus on long-term trends and can use longer-term WMAs, such as the 100-period and 200-period, to capitalise on significant price trends while eliminating market noise. You can enter trades when the price is above the WMA and trending upwards, and you should consider exiting the trade when the price crosses below it.</li> </ul> <p><img alt="100-period WMA crosses above 200-period WMA triggering an uptrend" src="/getmedia/77cd0bc2-d370-4ec3-883c-5d2d942b76fa/Academy-Forex-WMA-100-period-wma-crosses-above-200-period-wma-triggering-an-uptrend.png" /></p> <h3>Utilising WMA in conjunction with other technical indicators</h3> <h4>Relative strength index (RSI)</h4> <p>You can use the WMA to determine the trend direction and the RSI to identify overbought and oversold conditions. For example, once the WMA has highlighted an uptrend, you can enter a buy trade once the RSI is in oversold conditions, below 30.</p> <p><img alt="WMA crossovers combined with RSI signals." src="/getmedia/dc6b3122-9035-43ac-aa85-6328deec922e/Academy-Forex-Weighted-Moving-Average-WMA-crossovers-combined-with-RSI-signals.png" /></p> <h4>Moving average convergence divergence (MACD)</h4> <p>You can use the WMA to confirm trade signals generated by the MACD. The WMA could provide additional confirmation of the trading signals provided by the MACD crossovers. For instance, a bullish MACD crossover combined with the price above the WMA could suggest a robust buy signal.</p> <p><img alt="WMA crossovers combined with MACD signals." src="/getmedia/751bc351-c46c-4bbf-b074-69c664d8e710/Academy-Forex-Weighted-Moving-Average-WMA-crossovers-combined-with-MACD-signals.png" /></p> <h3>Bollinger bands</h3> <p>You can combine the WMA with Bolinger bands to determine possible breakout or reversal points. The WMA can help verify the direction of the breakout. For instance, if the price crosses above the WMA and breaks above the upper Bollinger band, it would signal a robust upward move.</p> <h3>Setting stop-loss orders based on WMA</h3> <h4>Dynamic stop-loss order</h4> <p>You can use the WMA as a dynamic stop-loss level. This allows the stop-loss to continuously adjust as the price moves higher or lower, as it follows the trend. For example, you can place your stop-loss order slightly below the WMA to protect against downside risk while allowing for minor price fluctuations in price movements.</p> <h4>Trailing stop-loss order</h4> <p>Use the WMA to set a trailing stop-loss order that moves with the price. This can help you lock in profits as the price moves in your favour. For example, if the price trends upwards, you can set a trading stop at a particular percentage or dollar amount below the WMA. The stop-loss order will move up as the WMA moves up.</p> <h3>Practical Examples</h3> <h4>Short-term strategy with RSI</h4> <p>A trader highlights an uptrend using the 20-period WMA on the 15-minute chart. The price is trading above the WMA. The trader then waits for the RSI to drop below 30, signalling an oversold situation within the uptrend. The trader enters a long position once the RSI starts moving back up.</p> <p><img alt="WMA crossover combined with the RSI indicator" src="/getmedia/8138983f-78ec-425e-9cc0-043540276d97/Academy-Forex-WMA-crossover-combined-with-the-rsi-indicator.png" /></p> <h4>Long-term strategy with MACD</h4> <p>A trader has applied the 50-period WMA to the daily chart. The MACD shows a bullish crossover. The trader then confirms the trading signal with the WMA, as the price should be above the 50-period WMA before entering an extended position. The trader then places the stop-loss order below the WMA to manage risk.</p> <h4>Trailing stop-loss with the WMA</h4> <p>A trader is in a buy position, and the price trends are above the 30-period WMA. The trader sets a trailing stop-loss 2% below the WMA. As the WMA moves up along with the trend, the stop loss also moves higher, locking in profits while allowing the trend to continue.</p> <h2>Limitations and considerations</h2> <p>While the weighted moving average (WMA) provides an advantage by prioritising recent price movements, traders must know its considerations and limitations to use it effectively.</p> <h3>Challenges in choosing the correct period for the WMA</h3> <h4>Sensitivity vs. noise</h4> <p>Using shorter-period WMAs is good as they react much faster to price movements and can help capture quick price changes. However, this heightens the chances of false signals created by market noise. You must find a balance between sensitivity and reliability. A WMA period that is too short can lead to price whipsaws, while a WMA period that is too long can delay identifying significant price trends.</p> <h4>Market conditions</h4> <p>Different market conditions require different WMA periods. Trending markets could benefit from shorter periods that can quickly capture trend changes while ranging markets could require more extended periods to filter out the noise. You must adjust the WMA period based on your current market environment and trading strategy.</p> <h4>Backtesting and optimisation</h4> <p>Choosing the correct WMA period often involves significant backtesting and optimisation. What works in one market phase may not work in another, leading to overfitting if not done with precision. You should regularly backtest and tweak the WMA period to ensure it remains effective under different market conditions. ThinkMarkets provides comprehensive backtesting software known as Traders Gym to its clients.</p> <h3>Understanding the impact of market volatility on WMA signals</h3> <h4>Increased false signals</h4> <p>High market volatility could lead to frequent price spikes and drops, increasing false signals from the WMA. This could result in premature entries and exits, reducing the effectiveness of your trading. To filter out noise in volatile markets, it might be best to combine the WMA with volatility tracking indicators such as the Bollinger bands.</p> <p><img alt="Multiple false signals during sideways trending markets" src="/getmedia/2a979339-c658-4284-927d-98a3d5edfa2b/Academy-Forex-WMA-multiple-false-signals-during-sideways-trending-markets.png" /></p> <h4>Adaptive periods</h4> <p>Market volatility can vary massively over time, making a fixed WMA period ineffective. It would be best to consider adaptive techniques that alter the WMA period based on present market volatility, which provides a more dynamic approach to trend detection.</p> <h4>Confirmation with other indicators</h4> <p>Relying solely on the WMA during high volatility can be risky. Using the WMA with other technical analysis indicators, such as the MACD and RSI, would be best to confirm the trade signals and lower the chances of false trades.</p> <h3>The importance of using WMA as part of a diverse set of trading tools</h3> <h4>Complementing other indicators</h4> <p>No indicator is foolproof. Combining the WMA with other technical indicators can offer a more detailed view of market conditions and improve the accuracy of trading decisions. For example, using the WMA with RSI to pinpoint overbought and oversold conditions within a trend could enhance decision-making and trade timing.</p> <h4>Risk management</h4> <p>Using a diverse set of tools helps you manage risk more effectively. The WMA can indicate trend direction, while other indicators can provide insights into volatility, momentum, and market sentiment. Combining the WMA with volatility measures and stop-loss strategies can protect you against unexpected market moves.</p> <h4>Adaptability and flexibility</h4> <p>Markets are dynamic and can change quickly. Using multiple tools allows traders to adapt their trading strategies to different market conditions, increasing their ability to respond to changes effectively. For example, in a trending market, the WMA could be combined with trend-following indicators, while in a range-bound market, oscillators like the RSI or stochastic could be more helpful.</p> <h3>Practical example of integrating WMA with other tools</h3> <h4>Scenario:</h4> <ul> <li>A trader is analysing a stock using the 20-period WMA. The stock is in an uptrend but experiencing significant volatility.</li> </ul> <h4>Action:</h4> <ul> <li>The trader combines the 20-period WMA with Bollinger Bands to determine volatility and possible breakout points.</li> <li>Additionally, the trader uses the RSI to confirm overbought and oversold conditions within the trend.</li> </ul> <p><img alt="Stock in an uptrend with 20-day WMA combined with Bollinger Bands and RSI." src="/getmedia/26084d30-a539-4a29-ac1b-6181b2eb25a4/Academy-Forex-WMA-stock-in-an-uptrend-with-20-day-wma-combined-with-bollinger-bands-and-rsi.png" /></p> <h4>Outcome:</h4> <ul> <li>The WMA signals the overall trend direction, while the Bollinger Bands offer insights into volatility and possible support and resistance levels.</li> <li>The RSI helps the trader avoid buying in overbought regions or selling in oversold conditions, thus improving the overall trading strategy.</li> </ul> <h2>Pros and cons of WMA indicator</h2> <p>Here is a table detailing the pros and cons of the WMA indicator.</p> <table> <tbody> <tr> <th><strong>Aspect</strong></th> <th><strong>Pros</strong></th> <th><strong>Cons</strong></th> </tr> <tr> <th><strong>Responsiveness</strong></th> <td>Emphasises recent price data, providing a more responsive indicator than SMA.</td> <td>It may generate more false signals in highly volatile markets due to increased sensitivity.</td> </tr> <tr> <th><strong>Trend Detection</strong></th> <td>Effective for identifying trends quickly, especially in trending markets.</td> <td>Can lag behind rapid market reversals, causing delayed signals.</td> </tr> <tr> <th><strong>Signal Clarity</strong></th> <td>Provides more precise signals in trending markets, reducing lag compared to SMA.</td> <td>The frequent price fluctuations can lead to whipsaws in choppy or ranging markets.</td> </tr> <tr> <th><strong>Weighting Method</strong></th> <td>The linear weighting method offers a balanced approach between smoothness and responsiveness.</td> <td>It is more complex to calculate and understand than SMA.</td> </tr> <tr> <th><strong>Use in Short-Term Trading</strong></th> <td>It is ideal for short-term trading strategies due to its quick reaction to price changes.</td> <td>Short periods can make it overly sensitive to minor price movements, causing noise.</td> </tr> <tr> <th><strong>Use in Long-Term Trading</strong></th> <td>It can be adjusted for extended periods to smooth out trends while being responsive.</td> <td>More extended periods may reduce its responsiveness, making it like the SMA</td> </tr> <tr> <th><strong>Combining with Other Indicators</strong></th> <td>Works well in conjunction with other indicators like RSI and MACD for confirmation.</td> <td>Reliance on multiple indicators can complicate trading strategy and decision-making.</td> </tr> <tr> <th><strong>Support and Resistance Levels</strong></th> <td>Based on recent price action, it can help identify dynamic support and resistance levels.</td> <td>Dynamic nature might cause frequent adjustments, complicating fixed-level analysis.</td> </tr> <tr> <th><strong>Versatility</strong></th> <td>Useful in both trending and ranging markets with appropriate period adjustments.</td> <td>Requires frequent backtesting and period adjustments to remain effective in varying markets.</td> </tr> <tr> <th><strong>Risk Management</strong></th> <td>It can set dynamic stop-loss levels and trailing stops based on WMA movements.</td> <td>Dynamic stop-loss levels might result in premature exits in volatile conditions.</td> </tr> </tbody> </table> <p>This table provides a comprehensive overview of the advantages and disadvantages of using the Weighted Moving Average (WMA) in trading, helping traders understand its applications and limitations.</p> <h2>Practical examples</h2> <p>Weighted moving averages (WMAs) can enhance trading strategies by effectively applying them to various market scenarios. Below are some case studies and practical examples showing how WMAs can be used effectively.</p> <h3>Case study: Using the WMA in forex trading</h3> <h4>Scenario:</h4> <p>A forex trader is considering trading the EUR/USD currency pair. The pair has been quite volatile, and the trader wants to use the WMA to capitalise on short-term price movements.</p> <h4>Strategy:</h4> <ul> <li><strong>Choosing the period:</strong> The trader utilises the 10-period WMA on the 1-hour chart to trade short-term trends.</li> <li><strong>Identifying trends:</strong> The trader waits for the EUR/USD price to cross above or below the 10-period WMA to identify possible buy and sell signals.</li> <li><strong>Using Bollinger bands:</strong> The trader also applies Bollinger Bands to manage volatility. When combined with the WMA, the trader looks for the price to cross above the upper band for buy signals and below the lower band for sell signals.</li> <li><strong>Stop-loss and take-profit:</strong> The trader sets stop-loss orders just below the Bollinger Bands and uses a trailing stop based on the WMA to lock in profits.</li> </ul> <p><img alt="EURUSD 1-hour chart with 10-period WMA and Bollinger Bands." src="/getmedia/1a4f19e7-5a0b-4b97-ad22-1a12777eca9b/Academy-Forex-WMA-eurusd-1-hour-chart-with-10-period-wma-and-bollinger-bands.png" /></p> <h4>Outcome:</h4> <ul> <li><strong>Buy signal:</strong> The EUR/USD price moves above the 10-period WMA and the upper Bollinger band, indicating a buy signal. The trader enters a buy position.</li> <li><strong>Volatility management:</strong> As the price fluctuates, the trader’s trailing stop-loss, set just below the WMA, moves up, locking in profits while allowing the trade to continue.</li> <li><strong>Sell signal:</strong> Later, the price crosses below the 10-period WMA and the lower Bollinger Band, triggering a sell signal. The trader exits the buy position and enters a sell position, capturing profits from the downward movement.</li> </ul> <h3>Analysis of real market scenarios</h3> <h4>Example 1: Apple Inc. (AAPL) - 2020 to 2021</h4> <p>During the bullish run by Apple Inc. (AAPL) from mid-2020 to late 2021, traders using the 50-period WMA on the daily chart could accurately identify the long-term uptrend. Each time the price fell back to the 50-period WMA and bounced back up, it created a buying opportunity. Combining the WMA with RSI to confirm overbought and oversold conditions offered additional confidence in these trades.</p> <p><img alt="Apple Inc stock price rally in 2020" src="/getmedia/fca17dd1-4393-4422-94d5-0fd874bbff39/Academy-Forex-WMA-apple-inc-stock-price-rally-in-2020.png" /></p> <h4>Example 2: Bitcoin (BTC) - 2021</h4> <p>In early 2021, Bitcoin experienced high volatility. Traders utilising the 10-period WMA on the 4-hour chart could capture the rapid price movements. By combining the WMA with the MACD for trend confirmation, traders could enter buy positions during bullish crossovers, exit their trades, or enter short positions during bearish crossovers. The WMA helped eliminate noise and offered more precise signals amidst the high volatility.</p> <p><img alt="Bitcoin uptrend in 2021 boosted by the 50-day WMA" src="/getmedia/c7d773e3-fc30-4684-b44e-dd81cb4e86b9/Academy-Forex-WMA-bitcoin-uptrend-in-2021-boosted-by-the-50-day-wma.png" /></p> <h2>Conclusion</h2> <p>The weighted moving average (WMA) is a technical analysis tool that assigns more weight linearly to recent price movements. It reacts much faster to price changes than the simple moving average (SMA) but is slower than the exponential moving average (EMA). The WMA should not be used in isolation but should be combined with other indicators, such as the RSI and MACD, to confirm its trade signals. The WMA is used as part of a broader trading strategy along with other indicators for better performance. It would be best to use the WMA whenever you are looking for an indicator more responsive to price movements than the SMA.</p> </div>
Wilder Moving Average: Basics, Formula, Setting, Strategies, Usage & Comparison
<div class="article__content"> <style type="text/css">.didyouknow { display: block; background: #5ee15a5e; padding: 5px 20px 20px 20px; border-radius: 10px; margin-top: 20px; } </style> <p>J. Welles Wilder created the Wilder moving average (WMA), a widely used technical analysis tool that assists traders in identifying market trends. Wilder's moving average stands out from regular moving averages by assigning greater weight to recent price changes. This allows it to respond more promptly to current market trends.</p> <p>The WMA is crucial because it helps traders pinpoint potential entry and exit points by smoothing price fluctuations. This allows traders to have a better grasp of the overall market.</p> <p>This article will teach you about the Wilder moving average (WMA), its formula, settings, and trading strategies. We will also cover how the WMA stacks up against other moving averages and its pros and cons.</p> <h2>Understanding Wilder’s moving average</h2> <p>By smoothing out price data, traders can more easily identify trends with the aid of Wilder’s moving average. The WMA differs from the traditional moving averages because it assigns more weight to recent price movements.</p> <h3>Detailed definition of Wilder’s moving average</h3> <p>Wilder’s moving average (WMA) is a smoothed moving average. It assigns greater importance to recent data points while still incorporating older prices. Therefore, the indicator is adept at identifying trends while avoiding the impact of short-term price changes. It can be used with other indicators to confirm the direction of each trend. A specific period of the WMA can yield almost the same values as a shorter EMA, highlighting their similarity.</p> <p><img alt="Wilder moving average on a price chart." src="/getmedia/0be9f9bf-171c-4e09-b8ca-8df913fd7cd0/Academy-Forex-Wilder-moving-average-on-a-price-chart.png" /></p> <h3>The theory behind its development by Welles Wilder</h3> <p>Welles Wilder created the Wilder moving average because he wanted a smooth trend indicator that took little time to react to recent price changes. He noticed that most moving averages did not assign adequate weight to recent prices and, as such, tended to lag behind current prices. To resolve this issue, Wilder created an indicator that assigns more weight to the latest prices but is still smooth since it considers older prices.</p> <div class="didyouknow"> <h2>Master trading with the Wilder moving average</h2> <p>You can master trading with the Wilder moving average (WMA) by <a href="/en/account-types/">opening a trading account with ThinkMarkets</a>. You will access over 4,000 tradable assets, including over 45 currency pairs and over 3,000 global stocks and equities. You will also get access to three cutting-edge trading platforms: <a href="/en/metatrader4/">MetaTrader 4</a>, <a href="/en/metatrader5/">MetaTrader 5</a> and <a href="/en/thinktrader/">ThinkTrader</a>.</p> </div> <h2>Wilder moving average formula</h2> <p>Wilder’s moving average formula adds weight to new price data while slowly phasing out older ones.</p> <p>The formula is:</p> <p><strong>WMA = [Previous WMA x (Period - 1) + Current Price] / Period</strong></p> <p>This means the moving average is regularly updated by adding the latest price to the previous average while eliminating the impact of older prices. Calculating Wilder's moving average involves a straightforward process of prioritising recent data points.</p> <h3>Explanation of Wilder’s moving average's formula</h3> <p>The primary idea behind Wilder’s moving average formula is to keep the computation simple but effective. You start the calculation by taking the previous Wilder moving average, multiplying it by your chosen number of periods minus one, and then adding today’s price. The calculation involves subtracting the previous average from the current price to ensure the moving average is responsive to recent price changes. Afterwards, you divide the figure by the periods selected.</p> <h2>Settings for wilder moving average (WMA)</h2> <p>In this section, we shall delve deeper into Wilder's moving average (WMA) settings, which most traders prefer.</p> <h3>Optimal settings for the Wilder's moving average (WMA)</h3> <p>The WMA's default setting is typically 14 periods, as recommended by the indicator's creator, J. Welles Wilder. However, you can choose your settings based on your trading strategy and markets.</p> <p><img alt="Wilder moving average default setting on a price chart." src="/getmedia/0b51d74e-aaae-4905-888f-54e742f4bce1/Academy-Forex-Wilder-moving-average-default-setting-on-a-price-chart.png" /></p> <p>As a short-term trader, you might prefer to lower the WMA period to 7 or 9, making it more responsive to fast market movements.</p> <p>As a long-term trader, you might prefer to extend the WMA period to 20 or 30. This could help you capitalise on broader market trends while minimising market noise.</p> <h3>How different settings impact trading analysis</h3> <p>Shorter periods, such as 7 or 9, make the Wilder moving average (WMA) more sensitive to price changes and are ideal for fast-moving markets such as <a href="/en/forex-trading/">forex trading</a>. However, the main disadvantage associated with shorter periods is that they typically lead to false signals during ranging markets.</p> <p>Longer periods, such as 20 or 30, make the WMA less reactive to short-term market price changes, as they help traders identify long-term trends. These settings are ideal for traders who want to avoid minor price changes as they focus on the more significant trends that play out over the long term.</p> <h2>Strategies using the Wilder moving average</h2> <p>The Wilder's moving average (WMA) is typically used as part of a crossover strategy or with other indicators that confirm its trade signals. Here are a few approaches you can use with the WMA.</p> <h3>Crossover trading strategies</h3> <p>The moving average crossover strategy is one of the most popular trading strategies involving the WMA. This consists of applying two WMA's to a chart, such as the 9-period WMA and the 21-period WMA. The strategy's basic rules are:</p> <p><img alt="Trade entry and exit based on Wilder’s moving average crossovers." src="/getmedia/f12f65b8-083b-42b8-a7e3-3c44a496b574/Academy-Forex-Trade-entry-and-exit-based-on-Wilder-moving-average-crossovers.png" /></p> <p><strong>Bullish signal:</strong> This occurs when the short-term WMA, like the 9-period, crosses above the long-term WMA, like the 21-period, which signals the beginning of a bullish trend.</p> <p><strong>Bearish signal:</strong> This occurs when the short-term WMA, like the 9-period, crosses below the long-term WMA, like the 21-period, which indicates the beginning of a bearish trend.</p> <h3>Price vs. WMA</h3> <p>Another popular trading strategy is to use the Wilder moving average (WMA) in combination with the price.</p> <p><strong>Buy signal:</strong> A buy signal is typically generated whenever the price crosses above the WMA, which signals that the uptrend will likely continue.</p> <p><strong>Sell signal:</strong> A sell signal usually occurs when the price crosses below the WMA, indicating that a downtrend is forming and could continue.</p> <h3>Combining the WMA with other indicators</h3> <p>Another common way of applying the WMA in trading is to use it alongside other indicators, such as the average directional index (ADX) and the relative strength index (RSI). These additional indicators can help you identify potential trend reversals and confirm the strength of a trend.</p> <p><img alt="Wilder moving average combined with the RSI." src="/getmedia/673dc4d5-53c9-4237-93dc-228bfe5afd0f/Academy-Forex-Wilder-moving-average-combined-with-the-RSI.png" /></p> <p>For instance, using the WMA and the RSI can help you avoid false breakouts by ensuring you only take trades with solid momentum.</p> <p>Wilder’s moving average (WMA) beauty lies in its flexibility. By adjusting the settings, traders can tailor it to suit different timeframes and market conditions.</p> <h2>Trading with the wilder moving average (WMA)</h2> <p>Traders use Wilder's Moving Average (WMA) as a solid tool to smooth price data and detect trends. WMA, unlike SMA, assigns heavier importance to recent prices, resulting in increased responsiveness. Whether you are engaging in day trading or long-term trading, utilising WMA can assist you in identifying trends sooner and making more intelligent choices.</p> <h3>Application in day trading vs. long-term trading</h3> <h4>Day trading with WMA</h4> <p>In the world of day trading, the most crucial factor is how quickly trades are executed. Traders require tools that respond rapidly to fluctuations in prices. A shorter WMA setting, such as a 9-period, is helpful in that situation. By emphasising recent prices more, this tool enables you to capture rapid market shifts quickly and efficiently execute trades.</p> <p><img alt="14-period Wilder MA on the EURUSD 1-hour chart showing a sustained downtrend" src="/getmedia/a47fbad5-24f6-410a-9321-0beb3f6ef035/Academy-Forex-WMA-14-period-wilder-ma-on-the-eurusd-1-hour-chart-showing-a-sustained-downtrend.png" /></p> <h4>Long-Term Trading with WMA</h4> <p>A 20-period or 30-period Wilder moving average (WMA) is better suited for trades or investments with a longer time horizon. It helps to even out brief changes in the short run and offers a clearer view of the long-term pattern. This environment may decrease noise and provide more precise signals for initiating and maintaining positions for weeks or months.</p> <h3>Practical examples and case studies</h3> <h4>Case study 1: intraday forex trading</h4> <p>A trader using a 9-period WMA for the EUR/USD on a 5-minute chart notices the price constantly bouncing below the WMA during the London session. This signals strong selling momentum. The trader enters a sell position and rides the trend. When the price finally breaks above the WMA after an essential news release, the trader exits, capturing a quick profit.</p> <p><img alt="The 9-period Wilder moving average on a 5-minute EURUSD price chart" src="/getmedia/5882abde-9651-4099-9d64-c1f7826424bf/Academy-Forex-The-9-period-Wilder-moving-average-on-5-minute-EURUSD-price-chart.png" /></p> <h4>Case study 2: holding stocks for an extended period</h4> <p>A long-term investor analysing Tesla's stock over months utilises a 30-day WMA on the daily chart. While the price remains consistently above the WMA, the investor stays confident in the bullish trend. The investor will only sell part of their position and secure long-term gains if the price drops significantly below the WMA.</p> <p><img alt="The 30-period Wilder moving average on Tesla daily price chart." src="/getmedia/dc0ba6da-75f3-4732-823b-0a8969ef137a/Academy-Forex-The-30-period-Wilder-moving-average-on-Tesla-daily-price-chart.png" /></p> <h2>Wilder moving average vs other averages</h2> <h3>WMA vs. exponential moving average (EMA)</h3> <p>WMA and the <a href="/en/trading-academy/forex/exponential-moving-averages/">exponential moving average (EMA)</a> give more importance to recent prices, but they calculate this weighting differently. The EMA applies an exponential weighting, making it even more responsive to price changes than the WMA.</p> <ul> <li><strong>WMA (14-period):</strong> The 14-period WMA gives more weight to recent prices but has a smoother transition compared to the same EMA period.</li> <li><strong>EMA (14-period):</strong> The 14-period EMA reacts faster to price changes, which can help catch sharp moves but might also generate more false signals in choppy markets.</li> </ul> <p>Example of Use: A day trader might prefer the EMA to react faster during volatile markets. On the other hand, swing traders or those who want smoother signals without too much noise might opt for the WMA.</p> <p><img alt="The 14-period WMA and EMA on a price chart." src="/getmedia/7fef132e-56ce-41d2-ab3f-a4fa811fa920/Academy-Forex-14-period-WMA-and-EMA-on-price-chart.png" /></p> <h3>WMA vs. simple moving average (SMA)</h3> <p>The <a href="/en/trading-academy/forex/simple-moving-averages/">simple moving average (SMA)</a> treats all price data equally, while the WMA gives more weight to recent prices. The WMA, therefore, adapts more quickly to market changes than the slower-moving SMA.</p> <ul> <li><strong>WMA (14-period):</strong> The 14-period WMA reacts faster, helping traders spot trends earlier.</li> <li><strong>SMA (14-period):</strong> The 14-period SMA is slower to respond, making it better for filtering out minor price fluctuations.</li> </ul> <p><img alt="The 14-period WMA and SMA on a price chart." src="/getmedia/bcd39896-55e2-4de9-ae3b-bb887bc7fffd/Academy-Forex-The-14-period-WMA-and-SMA-on-price-chart.png" /></p> <h3>Comparative Analysis: Wilder's Moving Average and EMA</h3> <ul> <li><strong>Responsiveness:</strong> The EMA reacts more quickly to price changes, which can be beneficial in fast markets but might lead to more false signals. The WMA provides a smoother curve, making it more reliable in longer-term analysis.</li> <li><strong>Trend Following:</strong> The WMA can help traders stay in trades longer because it smooths out volatility. The EMA, however, might prompt quicker exits or entries, which is great for day traders but potentially too jittery for long-term positions.</li> <li><strong>Signal Noise:</strong> The WMA generates fewer whipsaws in choppy markets than the EMA, making it useful for traders who want to avoid reacting to minor price moves.</li> </ul> <h2>Pros and cons of wilder moving average</h2> <h3>Pros of the WMA:</h3> <p><strong>More Attentive to Recent Prices:</strong> Wilder's Moving Average gives greater importance to recent price changes. This implies that it can detect trends sooner than a Simple Moving Average (SMA) because it offers different weights to the prices.</p> <p><strong>Ideal for Trend Detection:</strong> Because WMA is highly responsive, it is excellent for detecting the beginning of a trend or a reversal. Traders utilise it to verify if an asset increases or decreases in value over time.</p> <p><strong>Adjust the WMA settings</strong> for various trading timeframes, such as day trading or holding positions for weeks, to align with your trading preferences. Brief time frames capture rapid trends, while longer frames filter out the interference for broader trends.</p> <p><strong>WMA is more resistant to false signals:</strong> compared to the EMA, it offers smoother signals that can help avoid false breakouts in sideways markets.</p> <h3>Cons of the WMA:</h3> <p><strong>Still Sensitive to Noise:</strong> Although it’s smoother than the EMA, WMA can react quickly to price spikes, leading to false signals in choppy markets. This can confuse, especially for beginner traders.</p> <p><strong>Requires Fine-Tuning:</strong> The WMA's effectiveness depends on the periods you choose. Using the right setting for the market or your strategy can lead to better trading decisions. For example, using a 9-period WMA in a slow-moving stock might lead to too many signals.</p> <p><strong>Not Ideal for Sideways Markets:</strong> The WMA can need help to provide reliable signals in ranging or flat markets. Since it follows price closely, it might give several false signals, leading to "whipsaws" where you enter and exit trades too often.</p> <p><strong>Less Popular than EMA or SMA:</strong> Since the Exponential and Simple Moving Averages are more commonly used, you might find fewer resources or trading systems that use Wilder’s Moving Average. This could limit some traders who rely on more popular indicators.</p> <h2>Conclusion</h2> <p>In conclusion, Wilder’s Moving Average (WMA) is a valuable tool for traders looking to spot trends and make informed decisions. Its ability to give more weight to recent price changes makes it quicker to identify market movements than other averages. However, it’s important to remember that no indicator is perfect. The WMA can still produce false signals, especially in sideways or choppy markets, and requires fine-tuning to fit your trading style. By experimenting with different settings and combining them with other indicators, traders can use the WMA better to navigate the ups and downs of the market.</p> </div>