 ZA
ZAArticles (48)
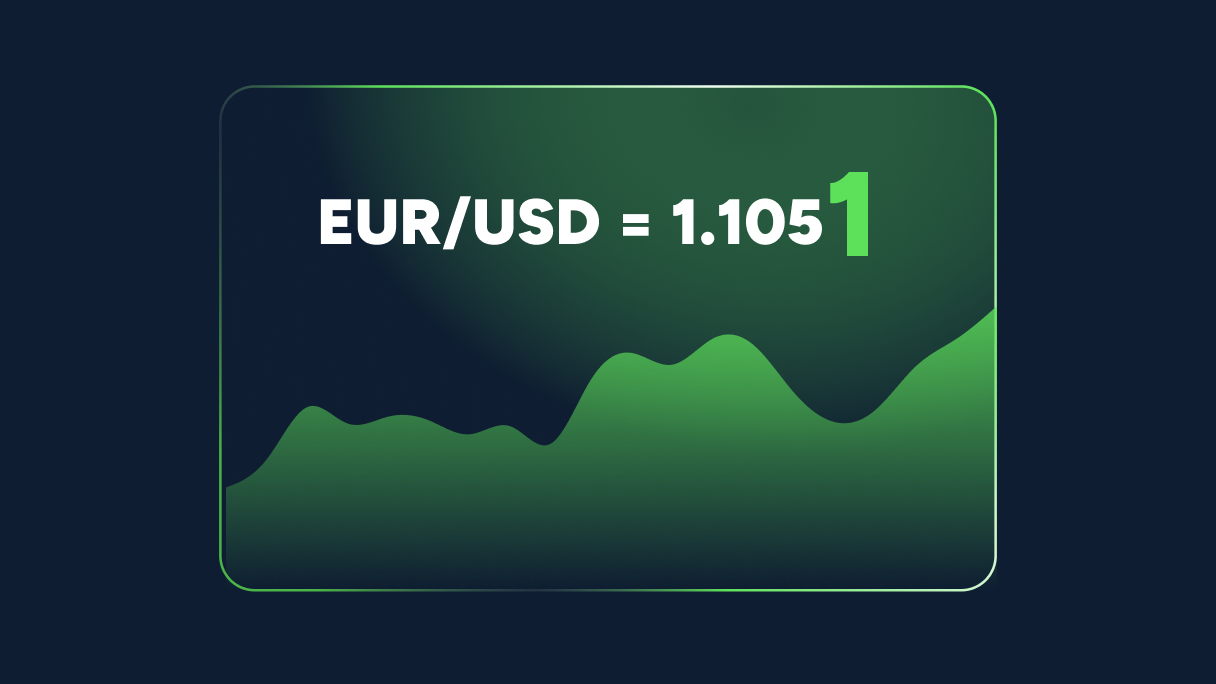
What is a pip in forex trading?
<h2>What is a pip?</h2> <ul> <li>A "pip" is the smallest whole increment in any forex pair.</li> <li>For pairs quoted in 3 decimal points a pip increment is based on the second decimal.</li> <li>For pairs quoted in 5 decimal points a pip increment is based on the fourth decimal, like the EUR/USD below.</li> </ul> <p><img alt="pips" src="/TMXWebsite/media/TMXWebsite/pips_1.png" /><br /> </p> <h2>Example</h2> <ul> <li>EUR/USD: A movement from 1.362(9)8 to 1.363(0)8 is a 1 pip move</li> <li>In USD/JPY, a movement from 104.4(7)1 to 104.4(8)1 is 1 pip</li> </ul> <p>So how much is a pip worth? This is determined by the currency of your account, the pair you are trading and the position size of your trade.</p>
Popular Forex Trading Strategies
<p dir="ltr"><strong>Identifying a successful forex trading strategy </strong>is one of the most important aspects of <a href="/en/forex-trading/">currency trading</a>. In general, there are numerous trading strategies designed by different types of traders to help you make profit in the market.<br /> </p> <p dir="ltr">However, an individual trader needs to find the best forex trading strategy that suits their trading style, as well as their risk tolerance. In the end, no one size fits all. <br /> </p> <p dir="ltr">In order to make profit, traders should focus on eliminating the losing trades and achieving more winning ones. Any trading strategy that leads you towards this goal could prove to be the winning one. <br /> </p> <h2 dir="ltr">How to choose the best forex trading strategy</h2> <p dir="ltr">Before we proceed to discussing the most popular forex trading strategies, it’s important that we understand the best methods of choosing a trading strategy. There are three main elements that should be taken into consideration in this process.<br /> </p> <h3 dir="ltr">Time frame </h3> <p dir="ltr">Choosing a time frame that suits your trading style is very important. For a trader, there’s a huge difference between trading on a 15-min chart and a weekly chart. If you are leaning more towards becoming a scalper, a trader that aims to benefit from smaller market moves, then you should focus on the lower time frames e.g. from 1-min to 15-min charts. <br /> </p> <p dir="ltr">On the other hand, swing traders are likely to use a 4-hour chart, as well as a daily chart, to generate profitable trading opportunities. Hence, before you choose your preferred trading strategy, make sure you answer the question: how long do I want to stay in a trade? <br /> </p> <p dir="ltr">Varying time periods (<strong>long, medium, and short-term</strong>) correspond to different trading strategies. <br /> </p> <h3 dir="ltr">Number of trading opportunities</h3> <p dir="ltr">When choosing your strategy, you should answer the question: how frequently do I want to open positions? If you are looking to open a higher number of positions then you should focus on a scalping trading strategy. <br /> </p> <p dir="ltr">On the other hand, traders that tend to spend more time and resources on analysing macroeconomic reports and fundamental factors are likely to spend less time in front of charts. Therefore, their preferred trading strategy is based on higher time frames and bigger positions.<br /> </p> <h3 dir="ltr">Position size</h3> <p dir="ltr">Finding the proper trade size is of the utmost importance.<strong> Successful trading strategies</strong> require you to know your risk sentiment. Risking more than you can is very problematic as it can lead to bigger losses. <br /> </p> <p dir="ltr">A popular piece of advice in this regard is to set a risk limit at each trade. For instance, traders tend to set a 1% limit on their trades, meaning they won’t risk more than 1% of their account on a single trade. </p> <p dir="ltr"> </p> <p dir="ltr"><img alt="Forex trading - ThinkMarkets" src="/TMXWebsite/media/TMXWebsite/3-strategies-image-1.jpg" /></p> <p dir="ltr">For example, if your account is worth $30,000, you should risk up to $300 on a single trade if the risk limit is set at 1%. Depending on your risk sentiment, you can move this limit to 0.5% or 2%. <br /> </p> <p dir="ltr">In general, the lower the number of trades you are looking to open the bigger the position size should be, and vice versa. <br /> </p> <h2>Three successful strategies</h2> <p dir="ltr">By now, you have identified a time frame, the desired position size on a single trade, and the approximate number of trades you are looking to open over a certain period of time. Below, we share three popular forex trading strategies that have proven to be successful. <br /> </p> <h3 dir="ltr">Scalping</h3> <p dir="ltr"><strong>Forex scalping</strong> is a popular trading strategy that is focused on smaller market movements. This strategy involves opening a large number of trades in a bid to bring small profits per each. <br /> </p> <p dir="ltr">As a result, scalpers work to generate larger profits by generating a large number of smaller gains. This approach is completely opposite of holding a position for hours, days, or even weeks. <br /> </p> <p dir="ltr">Scalping is very popular in forex due to its liquidity and volatility. Investors are looking for markets where the price action is moving constantly to capitalise on fluctuations in small increments.<br /> </p> <p dir="ltr">This type of trader tends to focus on profits that are around 5 pips per trade. However, they are hoping that a large number of trades is successful as profits are constant, stable and easy to achieve. <br /> </p> <p dir="ltr">A clear downside to scalping is that you cannot afford to stay in the trade too long. Additionally, scalping requires a lot of time and attention, as you have to constantly analyse charts to find new trading opportunities. <br /> </p> <p dir="ltr">Let’s now demonstrate how scalping works in practice. Below you see the EUR/USD 15-min chart. Our scalping trading strategy is based on the idea that we are looking to sell any attempt of the price action to move above the 200-period moving average (MA). </p> <p dir="ltr"> </p> <p dir="ltr"><img alt="EUR/USD 15-Minute Chart" src="/TMXWebsite/media/TMXWebsite/EUR-USD-chart.jpg" /></p> <p dir="ltr"> </p> <p dir="ltr">In about 3 hours, we generated four trading opportunities. Each time, the price action moved slightly above the 200-period moving average before rotating lower. A stop loss is located 5 pips above the moving average, while the price action never exceeded the MA by more than 3.5 pips. <br /> </p> <p dir="ltr">Take profit is also 5 pips as we focus on achieving a large number of successful trades with smaller profits. Therefore, in total 20 pips were collected with a scalping trading strategy. <br /> </p> <h3 dir="ltr">Day trading</h3> <p dir="ltr"><strong>Day trading</strong> refers to the process of trading currencies in one trading day. Although applicable in all markets, day trading strategy is mostly used in forex. This trading approach advises you to open and close all trades within a single day. <br /> </p> <p dir="ltr">No position should stay open overnight to minimise the risk. Unlike scalpers, who are looking to stay in markets for a few minutes, day traders usually stay active over the day monitoring and managing opened trades. Day traders are mostly using 30-min and 1-hour time frames to generate trading ideas. <br /> </p> <p dir="ltr">Many day traders tend to base their trading strategies on news. Scheduled events e.g. economic statistics, interest rates, GDPs, elections etc., tend to have a strong impact on the market. <br /> </p> <p dir="ltr">In addition to the limit set on each position, day traders tend to set a daily risk limit. A common decision among traders is setting a 3% daily risk limit. This will protect your account and capital.<br /> </p> <p dir="ltr"> </p> <p dir="ltr"><img alt="GBP/USD 1-Hour Chart" src="/TMXWebsite/media/TMXWebsite/GBP-USD-chart.jpg" /></p> <p dir="ltr"> </p> <p dir="ltr">In the chart above, we see GBP/USD moving on an hourly chart. This trading strategy is based on finding the horizontal support and resistance lines on a chart. In this particular case, we are focused on resistance as the price is moving upward. <br /> </p> <p dir="ltr">The price movement tags the horizontal resistance and immediately rotates lower. Our stop loss is located above the previous swing high to allow for a minor breach of the resistance line. Thus, a stop loss order is placed 25 pips above the entry point. <br /> </p> <p dir="ltr">On the downside, we use the horizontal support to place a profit-taking order. Ultimately, the price action rotates lower to bring us around 65 pips in profits. <br /> </p> <h3 dir="ltr">Position trading</h3> <p dir="ltr"><strong>Position trading</strong> is a long-term strategy. Unlike scalping and day trading, this trading strategy is primarily focused on fundamental factors. <br /> </p> <p dir="ltr">Minor market fluctuations are not considered in this strategy as they don’t affect the broader market picture.<br /> </p> <p dir="ltr">Position traders are likely to monitor central bank monetary policies, political developments and other fundamental factors to identify cyclical trends. Successful position traders may open just a few trades over the entire year. However, profit targets in these trades are likely to be at least a couple of hundreds pips per each trade. <br /> </p> <p dir="ltr">This trading strategy is reserved for more patient traders as their position may take weeks, months or even years to play out. You can observe the <strong>dollar index (DXY)</strong> reversing its trend direction on a weekly chart below.</p> <p dir="ltr"> </p> <p dir="ltr"><img alt="DXY - the dollar index weekly chart" src="/TMXWebsite/media/TMXWebsite/USDX-US-Dollar-Index.jpg" /></p> <p dir="ltr"> </p> <p dir="ltr">A reversal is a result of the huge monetary stimulus provided by the US Federal Reserve and the Trump administration to help the troubled economy. As a result, the amount of active dollars increases, which decreases the value of the dollar. Position traders are likely to start selling the dollar on trillion-dollar stimulus packages. <br /> <br /> <br /> Their target may depend on different factors: long-term technical indicators and the macroeconomic environment. Once they believe that the current bearish trend is nearing its end from a technical perspective, they will seek to exit the trade. In this example, we see the DXY rotating at the multi-year highs to trade more than 600 pips lower 4 months later (March - July).<br /> </p> <h2>Summary</h2> <ul dir="ltr"> <li role="presentation">Each trader needs to find the best forex trading strategy that suits their trading style;</li> <li role="presentation">Choose your own trading strategy by finding a preferred time frame, the desired position size and the number of trades you are looking to open;</li> <li role="presentation">Scalping is a popular trading strategy that involves opening numerous trades over a short period of time to capitalise on smaller market movements;</li> <li role="presentation">Day traders tend to open and close all trades within a single day;</li> <li role="presentation">Position trading is reserved for more patient traders with a background in finance and economics as they look to profit from long-term market trends.</li> </ul>
How to Understand Forex Trading Signals
Forex signals are popular with beginner traders to improve their success rate and enrich their trading experience. Trading signals are generated either by a human analyst or trader or an automated platform on a forex signal service. <h2>What are forex signals?</h2> <p dir="ltr">Forex signals serve to <strong>determine the right forex trading opportunities at the right moment.</strong> By its very nature, a forex signal refers to a trading idea centred around a particular <a href="/en/forex-trading/">currency pair</a>, which should be implemented at a predefined price and time. </p> <p dir="ltr">Regardless of your trading expertise, using forex signals can significantly improve your trading performance. Furthermore, expert traders can utilise forex signals to expand their profitability scope and experience. </p> <p dir="ltr">As for novice traders, forex signals offer advantages as they allow them to make a profit while still gaining knowledge about the world of trading with currencies. Using the signals, traders can also speed up the learning process because it helps them gain full insight about which trading options the signal is built on.</p> <p dir="ltr">It’s very important to know that a trading signal is useful only when used at the right time, especially in a volatile market such as forex. On the other hand, a signal can easily become useless if a trader gets it too late. </p> <p dir="ltr">To make sure traders receive trading signals at the right time, providers send the signals through multiple communication channels like SMS, e-mail, push notifications. Another option is to <a href="/en/platformoverview">download platform add-ons</a> that allow traders to receive their signals directly on their trading platform. Some traders use social-trading communities to receive relevant forex signals.</p> <p dir="ltr">Simply put, f<strong>orex trading signals</strong> represent essential need-to-know info related to the market. In a lot of ways, a forex signal represents an immediate update that traders can incorporate into the trading decisions they execute. </p> <h2>Types of forex signals</h2> <p>Although a lot of signal services share some features, there is no universal signal service. In this article, we cover the four most common forex signal services.</p> <h3>Manual vs automated forex signals</h3> <p dir="ltr">This service is categorised based on the way the signals are generated. A manual Forex signal is created by an individual who’s usually an analyst or an experienced trader. This is because with <em>manual signal trading</em>, the trader has to make the final decision and the human intelligence factor plays a major role.</p> <p dir="ltr">In contrast, automated trading signals are created by a computer or software that monitors and analyses price action based upon coded algorithms. </p> <p dir="ltr">The main benefit that comes with the automatic signal trading route is that it excludes emotion and provides increased execution trading speed. However, it also has a disadvantage because you rely very much on a computer, system, or individual and it excludes the decision-making process.</p> <p> </p> <h3>Paid vs free forex signals</h3> <p>This category is based upon the price of a signal service operator. Just as their name states, free forex signal providers offer signals without requesting payment, while paid forex signal providers offer signals but require money for that service. The latter category usually requests one-time payments or monthly subscriptions.<br /> </p> <h3>Entry vs exit forex signals</h3> <p dir="ltr">This is a category based on the amount of detail of a trade suggestion. There are signal services that provide only entry signals, that tell a trader when to enter the market, and there are other providers that offer only exit signals that tell traders to close their open position. </p> <p><br /> Most of the time this concerns long-term forex trading signals on financial products that trend for extended periods of time. <strong>When it comes to short-term trading signals</strong>, a trade idea usually takes into account both entry and exit signals.</p> <h2>What is copy trading?</h2> <p dir="ltr">Copy trading is a type of trading that became incredibly popular over recent years because it lets new traders make a profit. As a matter of fact, there are more and more traders who develop the <strong>“people-based” </strong>portfolios where the idea is to invest in other investors who conduct the trades for you, instead of trading currencies yourself. </p> <p dir="ltr">There are a number of ways copy trading can be performed <a href="/en/platformoverview">based on the platform you select</a>. Whatever the platform, the main idea is the same - invest a part of your portfolio in a specific trader and copy all of their trades in a percentage-based way. </p> <p dir="ltr">Keep in mind that most platforms <strong>don’t allow investing over 20% of your portfolio</strong> in a single trader, in order to encourage portfolio diversification. This is actually an efficient policy as sometimes investors appear more skilful than they actually are or they go through a rough streak. That’s why it’s wise not to have too much of your portfolio invested in one trader. </p> <p dir="ltr">When it comes to monitoring graphs and statistics, copy trading is just like normal trading. However, the main difference is that in copy trading you’re monitoring actual people rather than market moves. That’s why it’s of utmost importance to check a trader’s portfolio before copying them. Learn about their strategy, track record as well as risk management strategies they use. </p> <p dir="ltr">One thing is for sure, copy trading is great for novice traders. It’s an easier way into the world of trading and it will let you make some money by generating trading opportunities from successful investors. Even if you start losing, you can’t lose everything thanks to the portfolio diversification policy. </p> <p dir="ltr">Remember that no type of trading guarantees success, but at least it’s a great way to gain trading experience. It’s a great way to learn about trading since you’re learning from more experienced and successful traders.</p> <h2><!--%3Cmeta%20charset%3D%22utf-8%22%20%2F%3E--><b id="docs-internal-guid-42451160-7fff-d07b-57ab-cb71aaea856b">Who provides forex signals?</b></h2> <p dir="ltr">As we’ve already mentioned, there are manual and automated signal providers. Manual providers are usually more experienced traders, market analysts and strategists. Manual providers provide trading opportunities that are derived from their trading experience, fundamental and technical analysis expertise as well as their trading strategies. </p> <p dir="ltr">On the other side, automated signal providers refer to computer software that is developed to create trading instructions when specific set parameters or conditions appear in the market.<strong> Expert Advisors (EA)</strong> is an example of automated signal providers as it utilises technical analysis techniques that are based on forecast indicators,<a href="/en/trading-academy/forex/sma-indicator"> </a><a href="/en/trading-academy/forex/sma-indicator">such as Moving Averages</a>, <a href="/en/trading-academy/forex/analysis-fibonacci-ratios">Fibonacci Levels</a><a href="/en/trading-academy/forex/analysis-fibonacci-ratios">,</a> and Stochastics. </p> <p dir="ltr">Alternatively, there are also other automated signal providers that use <a href="/en/trading-academy/forex/fundamental-analysis">fundamental analysis</a> methods, including monitoring economic news releases and market sentiment. You may prefer automated signal providers to manual signal providers, or the other way around, depending on what you are looking for. </p> <p><br /> You can also find platforms that collaborate with third-party signal providers for free on a daily and weekly basis through market review and analysis.</p> <p dir="ltr">One of the largest auto-trading communities in the world that’s worth mentioning is <strong>MQL5.</strong> Anyone can become a signal provider in this community, however, there are a number of conditions to fulfill to make sure you can subscribe to a signal provider that will suit your requirements. MQL5 assesses the confirmed trading results of all providers and rates them. </p> <p dir="ltr">Additionally, you are able to use different filtering options that will let you choose your preferred signal providers based on their percentage development, drawdown and manual or algorithmic trading. </p> <p dir="ltr">Also, this community will warn you about any provider that still hasn’t delivered enough forex signals or about new signal providers whose successful results could have happened by chance. Once you’re subscribed to an MQL5 signal provider, you will be able to copy trades of the trader you’ve selected.</p> <p> </p> <p> </p> <h2>How to use forex signals</h2> <p>First things first, make sure you choose a good broker. Reliable brokers use trustworthy platforms that are very important for providing signals in a reliable manner.</p> <p dir="ltr">Next, choose a proper provider. This is actually a more difficult task than it seems, even though there is a high number of choices for traders who want to use forex signal providers. This is one of the most important steps because executing trades based on unreliable signals can result in massive losses. You’re putting a lot of faith in the provider, so make sure you choose wisely. </p> <p dir="ltr">That’s why you should conduct a detailed research about available signal providers and choose a provider with a high reputation and reliability. </p> <p dir="ltr">Before you settle and choose a provider, learn about their trading performances and strategies. There are signal providers that offer a free trial period which you can subscribe to at a later stage in case you’re pleased with the results. </p> <p dir="ltr">When it comes to automated strategies, you can usually conduct backtesting to see how the computer would have done in various market circumstances. Also, testing signal providers <a href="https://portal.thinkmarkets.com/account/individual/demo" target="_blank">on a demo account</a> before risking real capital would be a wise thing to do. </p> <p dir="ltr">It’s also important to know that there are<a href="/en/platformoverview"> </a><a href="/en/platformoverview">trading platforms</a><a href="/en/platformoverview"> </a>that offer high customisation features which can really make the difference since not all signal providers will enrich your trading experience. A customisable platform will make sure you can adjust a reliable signal to your investment objectives and aspirations. </p> <p> </p> <p>Don’t forget trading with currency pairs can be short-term or long term. Short-term signals are used in day and intraday trading, while long-term signals are used for several days. Keep in mind that these signals are time-dependent so make sure you make use of a signal as soon as you get it. </p> <p> </p> <h2>Key takeaways</h2> <ul dir="ltr"> <li role="presentation">Trading signals are generated either by a human analyst or trader or an automated platform supplied to a subscriber of the forex signal service.</li> <li role="presentation">Forex signals offer advantages as they allow traders to make a profit while still gaining knowledge about the world of trading with currencies.</li> <li role="presentation">Copy trading allows for investing in other investors who conduct the trades for you, instead of trading currencies yourself. </li> <li role="presentation">There are signal providers that offer a free trial period which you can subscribe to later if you’re pleased with the results. </li> <li role="presentation">Always conduct backtesting to check how the computer would have done in various market circumstances.</li> </ul>

How to spot bullish and bearish divergence patterns
<p dir="ltr">Some of the most successful forex traders will tell you that a <strong>forex divergence trading strategy</strong> is one of the most accurate strategies you can use. This is because the strategy not only makes use of information that is on the charts, but also uses candlesticks that provide clear information about what buyers and sellers are doing in the market. </p> <p dir="ltr"><br /> This article will present a clear-cut way of identifying bullish and bearish divergence setups on the charts. </p> <p dir="ltr"><br /> You would be best placed to practise this forex divergence trading strategy on a demo account. A demo account provides a chance for a beginner trader to develop the ability to detect bullish and bearish patterns, as well as detect divergence setups. You can <a data-di-id="di-id-b39f6aa3-f2404134" href="https://portal.thinkmarkets.com/account/individual/demo" target="_blank"><u>open a FREE demo trading account</u></a> in less than five minutes. </p> <p>What Is a Divergence?</p> <p dir="ltr">Divergence simply means to deviate from, or to do something distinctive from what another entity is doing. This definition should provide a clue as to what a divergence setup is. The forex trading divergence strategy employs the use of any suitable oscillator such as the <strong>Relative Strength Index (RSI)</strong> or the <strong>Moving Average Convergence Divergence (MACD)</strong> indicator. Other oscillators such as the DeMarker indicator and the Momentum indicator are equally capable of providing guidance on divergence, so they can be utilised as well. The oscillators used for this strategy are found on the <a href="/en/metatrader5"><u>MT4 or MT5</u> </a>platforms. </p> <p dir="ltr"><br /> <strong>Why are oscillators used? </strong>The oscillators are used because they are leading indicators. They tend to point in the direction of the next price move, before this appears on the charts. So they lead the way. Trend indicators follow the market and are lagging indicators, which makes them unsuitable for use in divergence strategies. </p> <p dir="ltr"> </p> <p><strong>So what is divergence?</strong> A situation where the price candles’ tops or bottoms point in a different direction from the corresponding tops or bottoms of the indicator’s signal line is called a divergence. Such divergence can be bullish or bearish.</p> <h2>What is bullish divergence?</h2> <p dir="ltr">A price chart showcasing <strong>bullish divergence</strong> is characterised by the formation of progressively lower lows by the price candles when the signal line of the oscillator forms progressively higher lows. It does not matter whether it is a bullish divergence RSI signal or a bullish divergence MACD signal: the principle of spotting and trading the divergence is the same. The sole difference is that a bullish divergence RSI signal uses the price troughs formed by the single signal line to detect the divergence. The bullish divergence MACD signal uses the point of the cross between the MACD lines in the indicator window as the reference signal from the oscillator. </p> <p dir="ltr"> </p> <p>Furthermore, the bullish divergence RSI signal uses a special setup on the RSI signal line known as the <strong><em>failure swing</em></strong>. The bullish divergence setups using the RSI and the MACD indicators are shown below.</p> <br /> <strong><img alt="Bullish Divergence RSI Setup" src="https://k13-dev.thinkmarkets.com/TMXWebsite/media/TMXWebsite/Bullish-Divergence-RSI-Setup.jpg" /></strong> <p> </p> <p>The bullish divergence RSI setup shows two troughs in the RSI indicator window forming higher lows while the price shows lower lows. The RSI, therefore, leads the price action and is pointing in the new direction. The price follows directly after to correct the divergence in the direction of the indicator’s signal.</p> <h2>What is bearish divergence?</h2> <p dir="ltr">A price chart showing <strong>bearish divergence</strong> is characterised by the formation of progressively higher highs by the price candles in the presence of progressively lower peaks formed by the oscillator’s signal line. This setup can occur in the form of a bearish divergence RSI signal or a bearish divergence MACD signal. The sole difference is that a bearish divergence RSI signal uses the price troughs formed by the single signal line to detect the divergence, while the bearish divergence MACD signal uses the peaks of the MACD lines in the indicator window as the reference signal from the oscillator. The example demonstrated below is that of a bearish divergence MACD signal.</p> <br /> <img alt="Bearish Divergence MACD Setup" src="https://k13-dev.thinkmarkets.com/TMXWebsite/media/TMXWebsite/Bearish-Divergence-MACD-Setup-pic-2.jpg" /><br /> <p dir="ltr">We can see that the bearish divergence MACD setup requires the identification of two progressively lower peaks on the MACD indicator line. The occurrence of the divergence setup should alert the trader towards seizing the initiative for necessary trade action. </p> <p dir="ltr"><br /> Various platforms provide different variations of the MACD indicator. The MACD indicator used above is obtained from the ThinkMarkets MT4 platform. </p> <p dir="ltr"><br /> The RSI can in addition, be used to spot a bearish pattern of divergence. The snapshot below illustrates how to spot a divergence using the RSI.<br /> </p> <img alt="Bearish Divergence RSI Setup" src="https://k13-dev.thinkmarkets.com/TMXWebsite/media/TMXWebsite/Bearish-Divergence-RSI-Setup-pic-3.jpg" /> <p dir="ltr"> </p> <p dir="ltr">This setup may look like it delivered very little profit. The fact is that the trade was set up on a daily chart. On the daily chart, a single candle represents a whole day's price action. Some assets have daily trading ranges of up to 200 pips. So initiating a divergence trade on a daily chart provides a realistic chance of banking a lot of pips. Indeed, the move from the possible sell point at 101.17 to the <a data-di-id="di-id-9877e2be-956ef5d7" href="https://portal.thinkmarkets.com/account/individual/"><u>take-profit area</u></a> totaled nearly 287 pips. This shows the potentials that can be found in a divergence setup. <br /> <br /> The MT5 platform possesses a <em><strong>Depth of Market</strong></em> tool which allows you to spot where the big players are setting up orders. If you employ this tool and see an increase in institutional orders in a direction which follows the divergence trade, this should give you more confidence on how to trade divergence setups. You can get the MT5 and the depth of market tool <a data-di-id="di-id-76e68987-1d3b3793" href="/en/metatrader5"><u>here</u></a>.<br /> </p> <p dir="ltr">The instances of the divergence trades that you have been shown are overt divergence setups. However, there are divergence setups that are not overt. These are identified as the <strong>hidden divergence patterns</strong>. Just like the overt divergence setups, hidden divergence setups can be of the bullish or bearish variety. </p> <p dir="ltr"><br /> Typically, hidden divergences are routinely continuation patterns while the regular divergences signify price reversals. Let's look at in detail what <em>hidden divergences</em> are. </p> <h2>What is hidden bullish divergence?</h2> <p>A hidden bullish divergence is a setup where the oscillator forms progressively lower lows at the same time that the price is forming higher lows. This setup is frequently seen in situations where the price has been in consolidation or has performed a pullback from an uptrend. This setup, therefore, indicates that price still has some upside momentum and that any pullback is more likely the outcome of profit taking from previous buyers as opposed to strong selling. The emergence of a hidden bullish divergence represents a signal that the prior uptrend is likely to continue. The hidden bullish divergence is presented in this setup below.</p> <br /> <img alt="Hidden Bullish Divergence Setup" src="https://k13-dev.thinkmarkets.com/TMXWebsite/media/TMXWebsite/Hidden-bullish-divergence-setup-pic-4.jpg" /> <p><br /> Here, we can see that the RSI formed lower lows at the same time the price formed higher lows. The period of divergence occurred at the time that price was pulling back in a retracement move. Usually divergence is hidden and not immediately obvious until it has occurred. That is why traders need to incorporate other tools or indicators to enable the early spotting of the hidden divergence signal, especially if the trader wants to re-enter the market on the completion of the pullback. Such tools include the <a data-di-id="di-id-7d8cb4b1-f5d0272a" href="/en/trading-academy/forex/analysis-fibonacci-ratios"><u>Fibonacci retracement tools</u></a>, which are able to detect the exact pullback levels and match them with the higher lows formed by the price bars/candles.</p>
.png?ext=.png)
Ways to use the Relative Strength Index (RSI)
<p dir="ltr">The relative strength index, or RSI for short, is one of the most popular technical indicators among the trading community. It belongs to the family of oscillators, or technical tools used to determine overbought or oversold conditions. It’s used to gauge the market sentiment.</p> <p dir="ltr">Developed by J. Welles Wilder, the RSI measures the speed and change of price movements. A popular way of reading RSI values is to look for divergences that occur when a new high or a new low of the price isn’t confirmed by the RSI readings.</p> <h2 dir="ltr">How it works </h2> <p dir="ltr">The RSI is a <em>momentum indicator</em>. As such, it displays on a vertical range of 0 to 100. Readings close to 0 are viewed as “oversold”, while those closer to 100 are a sign of “overbought” market conditions. Unlike some other momentum indicators, readings can’t go below 0 or higher than 100.</p> <p dir="ltr">According to Wilder, the relative strength index formula is as follows:</p> <p dir="ltr">RSI = 100 – [100 / (1 + (Average of Upward Price Change / Average of Downward Price Change)]</p> <p dir="ltr">When the RSI displays readings higher than 70, it means the market is trading in the overbought, or overvalued, territory. On the other hand, a dip below 30 reflects an oversold market condition. </p> <p dir="ltr">These two levels, 70 and 30, are the default values that can be modified as per the trader’s preferences. Some traders prefer to have values set at 80 and 20 to decrease the number of trips into the overbought or oversold territory and increase the effectiveness of the RSI.</p> <h2>Strengths and weaknesses of the indicator</h2> <p dir="ltr">In general, the RSI is considered to be an effective and useful technical indicator. It generates signals that are used by a trader to paint the full picture pertaining to market conditions. As such, the RSI is the strongest when the market shifts from bullish to bearish periods.</p> <p dir="ltr">The RSI, though, has its limitations and weaknesses, same as any other indicator. Arguably, its biggest limitation is that an asset can trade for a long period of time in an overbought or oversold territory and still continue to make new highs and new lows.</p> <p dir="ltr">For this reason, you should always cross-check signals from the RSI and compare them with other technical indicators. Overbought or oversold market conditions may overlap with signals from other indicators, creating a confluence of resistance/support with enough justification to open a trade. </p> <p dir="ltr">To illustrate an overbought market, take a look at the EUR/USD daily chart:<br /> <br /> <img alt="" src="/TMXWebsite/media/TMXWebsite/Overbought-signal-RSI-pic-1.jpg" /><br /> <br /> </p> <p dir="ltr">The pair had been trading into an uptrend, which makes the RSI cross into the overbought territory above 70. Despite the overbought market conditions, EUR/USD creates three additional bullish candles, pushing the price action almost 400 pips higher from the moment the RSI crossed 70.</p> <p dir="ltr">Experienced traders tend to say that whenever the market is overbought or oversold, it can always be more overbought or more oversold. For this reason, it is not advised to open a trade that is based only on the RSI values, since they generate false signals. </p> <br /> In order to get more familiar with the relative strength index, its strengths and weaknesses, you may want to use the MetaTrader 5 trading platform. You can access the latest version <a data-di-id="di-id-50880195-98f211af" href="/metatrader5"><u>here</u></a>. On this platform, you can use the historic price action to analyse the behaviour of the RSI and the signals it generates. <h2>RSI divergence signals</h2> <p dir="ltr">The relative strength index also generates divergence signals, either bullish or bearish. The bullish RSI divergence occurs when the price action creates a new low, or a lower low, while the RSI diverges from the price action and creates a higher high. This way, the RSI leads the price action and it signals that the potential bullish reversal may take place soon. </p> <p dir="ltr"><br /> On the other hand, the bearish divergence occurs when the price action is still trading in an uptrend, but the RSI has already started to come off the highs. As a result, the RSI signals the impending bearish reversal in the price.<br /> <br /> How to trade the RSI In order to avoid trading the false signals from the RSI, it is advised to cross-check signals against other technical indicators. In the example below, we have GBP/USD trading in an aggressive downtrend, on a daily chart.<br /> <br /> <img alt="" src="/TMXWebsite/media/TMXWebsite/Trading-the-RSI-picture-2.jpg" /><br /> <br /> </p> <p dir="ltr">Similarly to the previous example involving EUR/USD, the RSI enters the oversold territory already in the first part of the downtrend. This happens as a result of a strong push lower as the bears completely overwhelm the bulls. As a result, readings are also decreasing in an accelerated fashion. </p> <p dir="ltr">Our approach, in this case, is to use <a data-di-id="di-id-9164943b-24d004a1" href="https://www.thinkmarkets.com/uk/learn-to-trade/advanced/fibonacci-ratios/"><u>Fibonacci extensions</u></a> to identify the 127.2% and 161.8% levels as potential support blocks. As you can see in the chart, a downtrend of around 1,800 pips stops at the first extension level. </p> <p dir="ltr">Once we see that the bears are losing momentum, and we have a clearly identified level as a key factor for a slowdown, we check the RSI readings to get the confirmation that the market is oversold. </p> <p dir="ltr">Given the magnitude of the move, you would expect the RSI to trade at extremely low levels. When the price action touches the 127.2% extension, the RSI trades around 15. This is not surprising given that this bearish move pushed GBP/USD towards the lowest levels since 2008.</p> <p dir="ltr">If you go to a monthly GBP/USD chart, you will see that the last time RSI was trending around the 15 mark was in 2008. Although the RSI can always go lower until it reaches 0, a reading of 15 is quite low, especially for the higher time frames.</p> <p dir="ltr">Hence, the RSI is best used as a confirmation indicator. You can also use other technical indicators, such as <a data-di-id="di-id-1f4e334f-6f4eda2d" href="https://www.thinkmarkets.com/uk/learn-to-trade/indicators-and-patterns/indicators/simple-moving-average-sma-indicator/"><u>moving average</u></a>, Fibonacci retracements, trend lines etc., to identify important levels and then cross-check them with the RSI readings. </p> <p dir="ltr">In this particular case, we are trading against the 127.2% extension. A <u>stop-loss</u> should be placed below the extension, while a profit-taking order depends on your risk sentiment and risk/reward ratio. </p> <p dir="ltr">Practise trading of the RSI, and other technical indicators, by <a data-di-id="di-id-fd99886e-20c0aa3e" href="https://portal.thinkmarkets.com/account/individual/demo"><u>opening a demo trading account</u></a>. This way, you can identify trading opportunities yourself, by applying RSI and other technical indicators to better understand their co-existence, as well as to protect your capital until you feel comfortable to trade live markets.</p> <h2>Summary</h2> <p dir="ltr">The relative strength index is a momentum indicator that identifies when the market is trading in the overbought or oversold conditions. The indicator gauges market sentiment by measuring the speed and change of price movements. As such, it is best used in trending markets, and when mixed with other technical indicators.</p> <p dir="ltr">The RSI also displays bullish and bearish divergences, which happen when a new high or low isn’t confirmed by the RSI readings. Hence, divergences can lead the price action into a reversal, and generate a signal to the trader that the price may change its direction soon.</p>
How to Use the Stochastic Oscillator
<p>One of the most basic and perhaps oldest indicators used by technical analysts is the <strong>stochastic oscillator.</strong> The stochastic oscillator is an indicator that measures momentum and the strength of a trend. Essentially, its job is to analyse price movement and show how strong the price move is. </p> <p> </p> <p>The indicator measures the momentum of price, and also shows a slowing of momentum as the momentum of a financial instrument needs to slow down before changing direction. This addresses a weakness in retail trading, the fact that far too few traders pay attention to the importance of the rate of change. </p> <p> </p> <p>The stochastic oscillator is one of the more common indicators, and it’s one that you will see in a lot of analysis. However, like any other indicator it is simply a tool that you will be using to navigate through the forex markets, and like any other tool it is needed to be used in the proper settings and situations. </p> <h2>How to add the stochastic oscillator to MetaTrader charts</h2> <p>Adding the stochastic oscillator to the MetaTrader platform is very easy. By clicking on the <strong><em>Insert</em></strong> menu, you can pull down the list and click on <em><strong>Indicators</strong></em>, followed by <em><strong>Oscillators,</strong></em> and then <strong><em>Stochastic Oscillator</em></strong>. It's a common indicator, and as such it's built into the platform and there is no need to download from anywhere else.<br /> <br /> <img alt="" src="/TMXWebsite/media/TMXWebsite/Oscillator-picture-1.jpg" /><br /> <br /> The settings dialog box will pop up, and there are multiple parameters that you can change. The <strong>%K</strong> period and the <strong>%D</strong> period settings are available. The <strong>%K</strong> should be thought of as the slow value of the stochastic indicator and the <strong>%D</strong> should be thought of as the fast value of the stochastic indicator. It uses <em>a couple of moving averages</em> to measure the overall momentum.</p> <h2>Why does momentum matter?</h2> <p>Think back to your mathematics studies. One of the biggest influences in calculus is the absolute rate of change. The idea is that if the market is in an uptrend, but if the momentum starts to slow down, it can suggest that the market is running out of steam and, therefore, could be ripe for a reversal. In this sense, it can suggest whether or not the market is going to continue, or if it might be over-extended in one direction or the other, and other words <em>overbought</em> or <em>oversold</em>.</p> <h2>Using the indicator to make decisions</h2> <p>The stochastic oscillator has a multitude of uses when it comes to trading forex. We have already mentioned the most obvious use for the stochastic oscillator: the idea of identifying overbought or oversold conditions. In this scenario, the stochastic oscillator is best used in a range bound market, as it can tell you when to buy and sell in a relatively well defined situation.<br /> <br /> When you look at the stochastic oscillator window at the bottom of the chart, you see the two moving averages going back and forth in an up and down pattern. You will notice that there are two lines in the indicator window including the 80 and the 20 level.</p> <p> </p> <p>The <strong>area above the 80 level</strong> is considered to be <em>overbought</em>, while the <strong>area below the 20 level</strong> is considered to be <em>oversold</em>. Furthermore, you need to see the moving averages inside the stochastic oscillator to cross in the overbought or oversold areas in order to get a reversal signal. Anything between the two levels is essentially ignored in this scenario.</p> <p><img alt="" src="/TMXWebsite/media/TMXWebsite/Oscillator-picture-2.jpg" /><br /> <br /> </p> <p>Looking at the chart, you can see that the stochastic oscillator had several moves back and forth between the 80 and the 20 levels. However, there are only a couple of areas where the indicator either broke into the overbought area or the oversold area and had a cross. You need both of these things to happen in order for it to fire off a signal.</p> <p> </p> <p>In the graphic below, you can see that the signals fired off are color-coded by the arrows, with the red showing an overbought condition and a potential selling opportunity, and the blue showing potential buying opportunities in an oversold condition.</p> <p> </p> <p>It should be noted that using the stochastic oscillator in this way is much more reliable when in a sideways market, preferably between significant support and resistance. This makes the stochastic oscillator truly important, because statistically speaking markets are in some type of consolidation or sideways action more than 70% of the time. In other words, it’s much more common to be in this environment than it is to be out of it. </p> <h2>Measuring divergence</h2> <p>Another way that people use the stochastic oscillator in forex trading is to measure for divergence. The idea is that as with any oscillator, you could see momentum going in a different direction than the overall price. As an example, the momentum could be rising while price is falling or vice versa. If you are in a scenario where price is rising but the momentum is slowing, that means that there is less aggression to the upside and therefore less demand, even as prices press higher. This can be a sign that potential trouble is on its way. </p> <p> </p> <p>Take a look at the chart just below. You can see that there is a clear uptrend line on the four hour chart for the GBP/AUD pair. As the price was rising, though, notice that the stochastic oscillator made a <em>lower high</em>, which is the opposite of an uptrend. This suggests that the rate of change is slowing down, therefore one would have to be a bit suspicious about the efficacy of the move. </p> <p> </p> <p>After all, if there is less momentum, it suggests that there are fewer fresh orders coming in to push the market to the upside. Ultimately, you can see that shortly after the diversions with the <em>lower high</em> in the stochastic oscillator, the market broke down below the trend line and then eventually fell from those levels. Divergence can be found in several indicators, essentially the oscillator family. Because of this, using your divergence spotting skills can work in multiple other oscillators as well, as they all essentially work the same in this scenario.<br /> <br /> <img alt="" src="/TMXWebsite/media/TMXWebsite/Oscillator-pic-3.jpg" /></p>
Fibonacci ratios
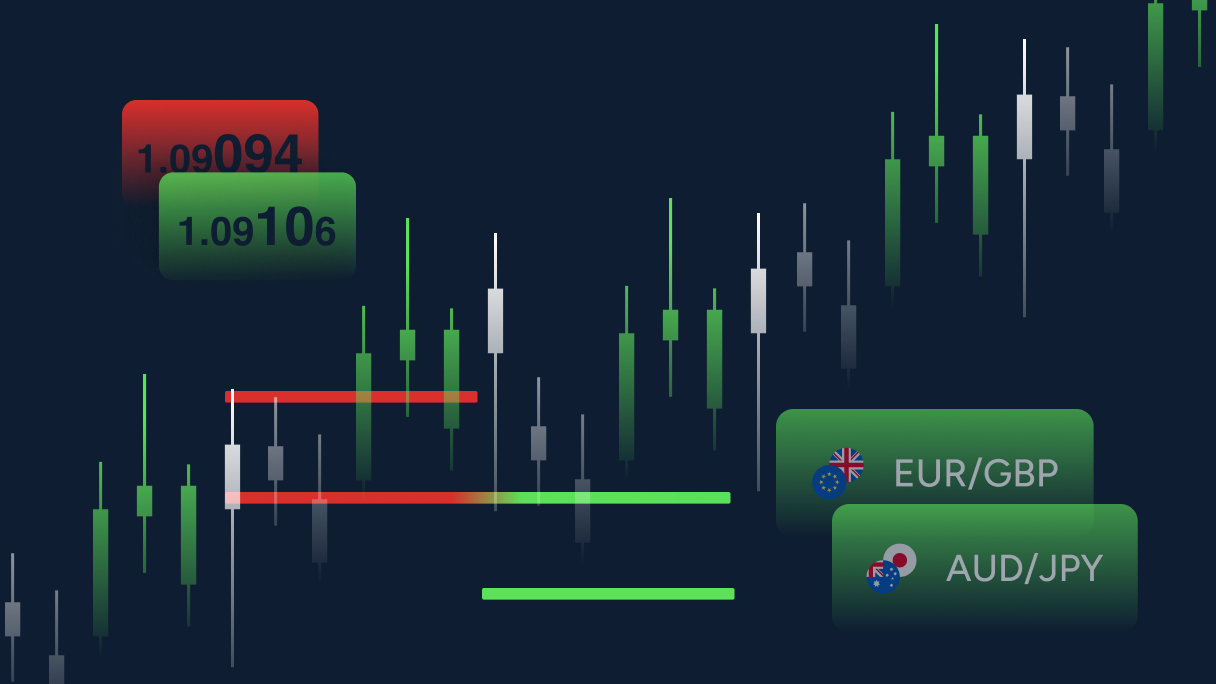
<p>The Fibonacci ratios commonly used are 100%, 61.8%, 50%, 38.2%, 23.6% - these are shown as horizontal lines on a chart and may identify areas of support and resistance. These levels are created by drawing a trend line between two extreme points and diving the vertical distance by the key Fibonacci ratios. These extreme levels are known as the recent swing high and swing low, <br /> <br /> To identify the Fibonacci levels for an uptrend, click on the swing low and draw the trend line to the swing high. In a down trend you simply reverse the trend line. The following chart shows the Fibonacci levels on price which is in an uptrend.<br /> <br /> <img alt="Fibonacci Retracement" src="/TMXWebsite/media/TMXWebsite/Fibonacci-Retracement.png" /><br /> <br /> As you can see on the chart, we have plotted the Fibonacci levels by clicking on the swing lows at 1.000 and swing highs at 1.14. The Fibonacci levels plotted show where price travels to and reverses, and are evident at the 61.8%, 38.2% and 23.6% levels. The 61.8% level is a common support level, as in the above example you can see the price has tested this level on many occasions. More recently, you can see where the price broke through the 38.2% level and retested this level. In this example there’s an expectation for the currency pair to test the 23.6% level at 1.11.<br /> <br /> The next chart shows the Fibonacci ratios plotted for the pricing action in a down trend. As you can see, we’ve drawn a trend line from the swing high at 1.1037 to the swing low at 1.0994. Again, you can clearly see where the price reversed at key Fibonacci levels such as the 50% and 23.6% levels.<br /> <br /> <img alt="Fibonacci Retracement" src="/TMXWebsite/media/TMXWebsite/Fibonacci-Retracement-2.png" /><br /> <br /> Fibonacci levels are by no means fool proof – they’re not areas where you would buy and sell from. You should look at them as areas of interest – an indication of where the price may go to in the future.<br /> </p> <h3><strong>Combining Fibonacci ratios with support and resistance</strong></h3> <p>Fibonacci ratios can be subjective, but can also be used to identify key support and resistance levels. A potential way to use the Fibonacci levels is to spot potential support and resistance levels, and see if these levels line up with the Fibonacci levels. If you do spot these levels, the chances of the price bouncing off them are higher.<br /> <br /> <img alt="Fibonacci Retracement" src="/TMXWebsite/media/TMXWebsite/Fibonacci-Retracement-and-Support.png" /><br /> <br /> As you can see from the chart, the key Fibonacci levels 61.8% and 38.2% have been areas of support and resistance previously, and by identifying this on the chart, these levels can potentially be areas where you could enter the market. With traders looking at the same support and resistance levels, there’s a good chance that there will be a number of orders around those levels. </p>
How to start trading the markets
<h2 id="how-to-start-heading-unique-id-1">Step 1 – Apply for an account with us</h2> We offer a wide range of financial instruments to trade across two of the industry’s leading platforms: MetaTrader 4 (MT4) and our very own ThinkTrader®. Simply apply for an account and provide us with the requested documentation and once approved, we’ll provide you with your login details to access your trading account for the very first time.<br /> <br /> <a href="https://portal.thinkmarkets.com/account/register/live?lang=en" id="button-one" target="_blank">Apply today</a><br /> <h2 id="how-to-start-heading-unique-id-2">Step 2 – Time to fund</h2> Once your account is opened you’ll be able to fund it and place your first trade. Funding your account is simple with our online client portal, ThinkPortal. In ThinkPortal you’ll have access to a wide list of funding options, from credit/debit card and bank wires to local payment providers and digital wallet services. The funds will usually be in your account within 12 hours and you’ll be ready to place your first trade.<br /> <br /> <a href="https://portal.thinkmarkets.com/" id="button-two" target="_blank">Fund your account</a><br /> <h2>Step 3 – Let’s get trading</h2> <p>Now that your account is open and funded, you can take that final step and open your first position. Here are a few pointers to help you get started:<br /> </p> <p>Remember – never place a trade that you’re not sure about. Your investment is at risk with every trade you place, so make sure you’re fully behind the decision of placing the trade before hitting the button.<br /> </p> <p> </p> <ol> <li> <p>Understand the markets – ensure you know what you want to trade and when to trade it. Our market analysis section provides plenty of market insight on a daily basis and becoming familiar with our analysts and their articles can be a helpful place to keep track of market news and trading opportunities.</p> </li> <li> <p>Know the platform – before opening your first trade we highly recommend that you become familiar with the platform of your choice. Explore the different platform features and ensure you’re comfortable with the settings before opening the order ticket for the first time. Read about our ThinkTrader® and MetaTrader 4 (MT4) platforms <a href="/za/account-types/">here</a></p> </li> <li> <p>Place your trade – once you’re comfortable within the platform, identify the trade you want to make and how you plan to execute it, open the order ticket, set your parameters and place the trade.</p> </li> </ol>

Timezones and liquidity
<h2>Forex market hours and liquidity</h2> <p>With indices, shares and most other financial products that are traded on various global exchanges, you can only make trades during the exchange’s business hours. Fortunately for forex traders, currencies are free of this restriction and can be traded day or night, with the forex market hours being open 24 hours a day, 5 days a week.</p> <h2>Capturing trading opportunities around the clock</h2> <p>Because the Forex market does not have a physical location or a central exchange, it is considered an Over-the-Counter (OTC), or "Interbank", market due to the fact that the entire market is run electronically, within a network of banks. This means that you can place trades through your broker 24 hours a day and trade at a time that’s convenient for you.</p> <p>Below you can see a 24 hour period which shows the active trading sessions of the Interbank and Retail FX markets, using London as the time zone as this is the central hub to Forex trading.</p> <h2>Nylon session</h2> <p>The highest volume of trading activity happens during the London session (as it also has Europe as well) but liquidity is at its highest when New York opens and overlaps with the London session. This is referred to as the ‘Nylon’ session (New York and London) when liquidity and trading volume is at its highest. Therefore we can expect larger moves and is an ideal time to trade breakout strategies. This is a popular time for intraday traders to participate as due to the higher volume and liquidity, spreads are at their tightest so transaction costs for the traders is lower.<br /> <br /> <img alt="timezones" src="/TMXWebsite/media/TMXWebsite/timezones_1.png" /><br /> <br /> </p> <h2>Asia Session</h2> <p>Whilst New York and London are considered important trading centres the same can also be said for Tokyo, Hong Kong and Singapore. As London and New York banks close their official trading sessions, the Asian banks open and trade which is why Forex is seen as a 24 hour market. However the volume is not as high as the Nylon session which means we tend to see smaller price movements and wider spreads.<br /> </p> <h2>24-liquidity cycle</h2> <p>The visually show you the changes in liquidity around a 24 hour period the chart below has a 14 period ATR indicator (Average True Range). This is a proxy for volume and each horizontal line represents 24hrs. We can see that during the Asian session volume and liquidity is at its lowest and increases when Europe and London opens, with the peak during the Nylon session. Whilst it is not precise to the hour or minute I hope this demonstrates the daily cycle of increasing and decreasing volume.<br /> <br /> <br /> <img alt="timezones" src="/TMXWebsite/media/TMXWebsite/timezones_2.png" /><br /> </p>

How to trade bullish and bearish Engulfing candlestick patterns
Bullish and bearish Engulfing candlestick patterns, also called Outside bars, are powerful dual-candle formations. Found at the end of a downtrend or uptrend, these patterns often indicate a potential reversal. Engulfing patterns are also easy to spot, which adds to their popularity and makes trading with them very straightforward.<br /> <br /> The difference between this pattern's bullish and bearing versions depends on the candle order within it. <h2>Bullish Engulfing candlestick pattern</h2> A bullish Engulfing pattern occurs at the end of a downtrend and consists of two candles. The first candle is bearish (red) and has a relatively small body and short shadows, also known as wicks. The second candle, on the other hand, is bullish (green) and has longer wicks and a longer body that engulfs the body of the previous bearish candle.<br /> <br /> <img alt="Bullish Engulfing candlestick pattern (Outside Bar)" src="/getmedia/4908dd05-65dd-4e63-8e2c-91688f3ef6cd/Bullish-Engulfing-candlestick-pattern-(Outside-Bar).png" /><br /> <br /> The body of the first candle doesn't necessarily need to be exactly in the middle as long as it's completely overwhelmed by the body of the second candle. For a candlestick pattern to qualify as bullish Engulfing, the high price of the second candle should be higher than the high price of the first candle. The same scenario applies to the low prices – the second candle must have a lower low price than the first one.<br /> <br /> If the closing price (top of the body) of the second candle is higher than the high price (top of the wick) of the first candle, the Engulfing pattern is considered a much stronger bullish reversal signal. The reason is that the second candle indicates that bulls gained control over the price. <h2>Bearish Engulfing candlestick pattern</h2> A bearish Engulfing pattern works exactly the same way. The only difference is that it is a bearish reversal pattern that occurs at the top of an uptrend, with a bullish (green) candle on the left and a bearish (red) one on the right.<br /> <br /> <img alt="Bearish Engulfing candlestick pattern" src="/getmedia/b35bbf54-f9e5-4090-a3ae-155c631dcdb8/Bearish-Engulfing-candlestick-pattern.png" /> <h2>How do Engulfing patterns work?</h2> As we mentioned above, both patterns take place at the end of a strong trend. The first candle in both formations (either bullish or bearish) signals the continuation of a trend. On the other hand, the second candle (bearish or bullish, respectively) is powerful enough to completely shut down the first one and initiate a new trend.<br /> <br /> Engulfing candles in trading are very significant when conducting analysis, as traders usually aim to capitalise on new trends when markets change direction. Reversal patterns, such as bullish and bearish Engulfing patterns, signal an impending change in the price direction, as the so far dominant force has started losing momentum, which allows the other force to step in.<br /> However, as with other candlestick patterns, Engulfing formations have their own limitations. While they are quite powerful at the end of a strong trend, they are almost non-tradeable when they appear in a sideways market. <h2>Engulfing vs Harami candlestick patterns</h2> An Engulfing pattern has an opposite version – a Harami candlestick formation, also called an Inside Bar. Its structure is identical, but the candles within it swap places. The first candle is long, entirely overwhelming the second smaller candle. A Harami candle can also exist in two variations – bullish and bearish.<br /> <br /> <img alt="Bullish and bearish Harami candlestick pattern (Inside bars)" src="/getmedia/418d3953-c8d9-46f8-b205-af678bcf1aeb/Bullish-and-bearish-Harami-candlestick-pattern-(Inside-bars).png" /><br /> <br /> However, in general, this pattern doesn't provide a strong signal. Once it occurs, it may indicate an upcoming reversal, but the price often starts trading sideways instead or continues following the trend. That's why this pattern is not particularly popular among traders. <h2>How to trade with Engulfing patterns</h2> A trading strategy with Engulfing patterns is pretty straightforward as they provide a powerful signal on their own. <h2>Trading with a bearish Engulfing pattern</h2> On the image below, you can see a series of highs and lows that created an uptrend. Following a new short-term high price (the first candle in the bearish Engulfing pattern), the price suddenly drops lower to create a strong, powerful bearish candle.<br /> <img alt="Trading with a bearish Engulfing pattern" src="/getmedia/e13e4fd6-918a-47a1-8d3f-669a1d94f57e/Trading-with-a-bearish-Engulfing-pattern.png" /><br /> All elements are in place, and the bearish Engulfing pattern occurs. After that, the price still has both lows and highs but ultimately trades at lower levels.<br /> <br /> In this particular example, you can see the power of a bearish Engulfing pattern. The trend reversed after the second candle generated a signal that the bears had taken control of the price, and the downtrend may be finished.<br /> In such cases, traders tend to go short, using the second candle as an entry point and its high price as a stop loss. The take-profit level is derived using other technical indicators.<br /> <br /> For a more complete trading strategy, you may also use additional technical analysis tools, such as support and resistance or technical indicators.<br /> For example, if we zoom out of the previous price chart, we can see a potential placement of two support levels that may (and did, in this case) affect a newly formed trend.<br /> <br /> <img alt="A bearish Engulfing candlestick pattern with support lines in a price chart" src="/getmedia/097e5469-ff87-4b8d-92c0-5528ed694c04/A-bearish-Engulfing-candlestick-pattern-with-support-lines-in-a-price-chart.png" /><br /> <br /> On the other hand, if you have a long position open in an uptrend, a bullish Engulfing candle pattern may serve as a signal to exit the market before it reverses. <h2>Trading with a bullish Engulfing pattern</h2> A strategy with a bullish Engulfing formation would work exactly the same, but you would go long following the same logic. With a short position in a downtrend, this pattern would also serve as an exit signal.<br /> <br /> For example, the image below shows a bullish Engulfing pattern in action – the downward reversed right after the formation occurred.<br /> <br /> <img alt="Trading with a bullish Engulfing pattern" src="/getmedia/13a3792d-d4e9-4eed-9fe4-0bbbd24b7401/Trading-with-a-bullish-Engulfing-pattern.png" /><br /> <br /> Keep in mind that even the most accurate trading signals never guarantee that the market will move in the predicted direction. That's why experienced traders always have risk management tools, such as stop loss and take profit in place.<br /> <p>Create a demo account to solidify your knowledge in a risk-free market environment. Alternatively, move to our next article, where we explain how <a href="/za/trading-academy/indicators-and-patterns/marubozu-candlestick-pattern/">Marubozu candles</a> work.</p>
How to trade Tweezer Bottom and Tweezer Top candlestick patterns
<p> Tweezer Top and Bottom, also known as Tweezers, are reversal candlestick patterns that indicate a potential change in the price direction. Both formations consist of two candles that occur at the end of a trend, signaling its weakening. </p> <h2>Tweezer Bottom candlestick pattern structure</h2> <p> A Tweezer Bottom is a bullish reversal pattern that appears at the bottom of a downtrend. Both candles are of the same length but the first candle in this formation is bearish, in line with the bearish trend, while the second is bullish. </p> <p> The key message that this pattern signals is that despite a poor performance on the first day, the bears were not able to control the price direction as buyers were able to claw back all of their losses on the second day, which marks a deep blow for short sellers. </p> <p> For the pattern to qualify as a Tweezer bottom, the opening price of the new candle needs to be near the close of the prior day. The price should also not trade below the prior day’s closing price. </p> <br /> <img alt="Tweezer Bottom candlestick pattern" src="/TMXWebsite/media/TMXWebsite/Tweezer-Bottom-candlestick-pattern.png" /> <h2>Tweezer Top candlestick pattern structure</h2> <p> A Tweezer Top candlestick pattern has exactly the same structure as a Tweezer Bottom but reversed. This formation occurs at the end of an uptrend, indicating potential change. Therefore, it is a bearish reversal pattern. The first candle of a Tweezer Top is bullish and continues in the same direction as the trend, while the second candle is bearish and suggests that the trend may be changing soon. </p> <br /> <img alt="Tweezer Top candlestick pattern" src="/TMXWebsite/media/TMXWebsite/Tweezer-Top-candlestick-pattern.png" /> <p> Similar to Tweezer Bottom, both candles should roughly match each other. However, the high prices of both candles must be approximately on the same level. </p> <p> Keep in mind that both Tweezer patterns are only considered valid when they occur in uptrends and downtrends. In a sideways trading market, they don’t provide any value and signal the indecision to move in either direction. </p> <h2>How do Tweezer Bottom and Tweezer Top patterns work?</h2> <p> As reversal patterns, Tweezers are quite popular among traders searching for clues on when the price will change its direction. This pattern can be a powerful signal of a potential upcoming reverse, as it suggests that the dominating power loses its control over the price. In turn, the opposing power gains momentum to close the session in their favour. </p> <p> It is important to note that the stronger (longer) the second candle is, the stronger signal this pattern generates, indicating that the opposing power had enough strength to push the closing price far from the opening. In some cases, a tweezer pattern takes the form of the <a href="/trading-academy/forex/analysis/bullish-bearish-engulfing-patterns">Engulfing</a> formation, where the second candle shuts down the first one entirely, indicating a particularly strong reversal signal. </p> <p> Nevertheless, just like any other candlestick pattern, neither Tweezer Bottom nor Tweezer Top guarantees market reversal and serves only as a suggestion. To help confirm their findings, traders often use additional tools. </p> <h2>How to trade with a Tweezer Bottom candlestick pattern</h2> <p> As noted earlier, the bullish Tweezer occurs at the bottom of a downtrend. On the image below, you can see that the instrument’s price has been moving lower for some time, creating lower highs and lower lows. </p> <br /> <img alt="A trading example with Tweezer Bottom candlestick pattern in a chart" src="/TMXWebsite/media/TMXWebsite/A-trading-example-with-Tweezer-Bottom-candlestick-pattern-in-a-chart.png" /> <p> If you look at the bullish Tweezer at the bottom, the first candle is a strong bearish candle that indicates the continuation of the downside move. However, the second candle surges in the opposite direction. </p> <p> In the following trading sessions, the bulls were able to keep pushing the price higher, completely reversing the trend, despite occasional pushbacks from bears. </p> <p> In this particular case, we see a very strong bullish candle that further adds to the overall bullishness of the tweezer bottom candlestick pattern. </p> <p> Trading the bullish Tweezer is not much different from trading other bullish reversal candlestick patterns – it is advisable to wait for the formation to be completed before entering a trade. Risk-averse traders may wait for an additional candle to close to confirm the new trade. </p> <p> Once you are confident that the pattern strongly indicates an upcoming reversal, you can open a long trade. The stop loss may be placed below the low point of the pattern because if the price trades below this level, it will invalidate the pattern. </p> <h2>How to trade with a Tweezer Top candlestick pattern</h2> <p> As you already know, unlike the bullish Tweezer Bottom, the Tweezer Top candlestick formation occurs at the top of an uptrend. Therefore, it is a bearish pattern. </p> <p> On the image below, you can see a strong bullish trend. A bearish Tweezer Top was formed on its top, suggesting a trend reversal. </p> <br /> <img alt="A trading example with Tweezer Top candlestick pattern in a chart" src="/TMXWebsite/media/TMXWebsite/A-trading-example-with-Tweezer-Top-candlestick-pattern-in-a-chart.png" /> <p> Although the second candle is slightly weaker than the first one, the uptrend still sees a strong reversal. Like with a Tweezer Bottom, traders usually open their position in the opposite direction from the main trend. In this case, it means going short, using the latest high as a stop loss. </p> <p> If the second candle is not strong enough to provide confidence in the upcoming reversal, you may use additional tools, such as trendlines. In the example illustration below, you can see how a crossed support line confirms the reversing trend. </p> <br /> <img alt="Support trendline with a Tweezer Top candlestick pattern in a chart" src="/TMXWebsite/media/TMXWebsite/Support-trendline-with-a-Tweezer-Top-candlestick-pattern-in-a-chart.png" /> <p> A great way to learn the Tweezer candlestick patterns trading is to practise identifying them in a risk-free demo account environment. Sign up today and practise opening positions with this candlestick pattern. </p> <p> If you want to learn more about other patterns, head to our next article, where we explain how the <a href="/en/trading-academy/indicators-and-patterns/morning-evening-star-candlestick-patterns/">Morning Star and Evening Star candles</a> work. </p>
What are bullish and bearish Pennant patterns?
<p>Pennants are another type of multi-candle chart pattern. Like <a href="/za/trading-academy/indicators-and-patterns/bear-bull-flag-pattern/">Flag formations</a>, bullish and bearish Pennants are continuation patterns indicating that the prevailing trend will likely continue after a brief pause. </p> <h2>Bullish Pennant chart Pattern structure</h2> A bullish Pennant pattern has a very similar structure to a bullish Flag – a pole, a body (pennant) and a breakout. The main difference is that while the Flag’s body is made of candles trading strictly within two parallel trendlines, the Pennant’s body looks more like a triangle.<br /> <br /> <img alt="A bullish Pennant chart pattern" src="/TMXWebsite/media/TMXWebsite/A-bullish-Pennant-chart-pattern.png" /><br /> <br /> In general, to be considered valid, bullish Pennant patterns need to have the following characteristics: <ul> <li>A bullish flagpole with higher highs and higher lows</li> <li>A consolidation phase that takes place between the two converging trendlines</li> <li>A breakout through the upper line.</li> </ul> <h2><br /> Bearish Pennant chart Pattern structure</h2> A bearish Pennant is a continuation pattern that resembles a bearish Flag as well, following the same logic – its body has the shape of a pennant instead of a flag.<br /> <br /> <img alt="A bearish Pennant chart pattern" src="/TMXWebsite/media/TMXWebsite/A-bearish-Pennant-chart-pattern.png" /><br /> <br /> The main characteristics of this pattern are: <ul> <li>A strongly bearish flagpole with lower highs and lower lows</li> <li>A relatively short body between the two converging lines</li> <li>A breakout through the bottom line.</li> </ul> <h2>How do Pennant chart patterns work?</h2> Both bullish and bearish Pennants can show us that the dominant power on the market had enough strength to push the price in their favour and create a trend. At some point, it weakens, allowing the opposing power to test its resistance, which sends the price sideways, bouncing back and forth between the two trendlines.<br /> <br /> Eventually, the previously dominant power consolidates its efforts to resist the attempts of price reversal and pushes for the trend’s continuation.<br /> <br /> If the breakout in any of the two Pennants happens in the opposite direction invalidating the pattern, it means that the dominant power lost its ground, and the trend may reverse. <h2>How to trade with Pennant chart patterns</h2> The first step in a trading strategy with Pennants is to wait for the pattern to be completed. This means that you need to be able to identify a clear breakout – the last element of the pattern. Once you have all the elements in place – you can open a position. <h3>Trading with a bullish Pennant pattern</h3> As a bullish Pennant suggests a continuation of an upward price movement, traders usually go long once they spot this formation.<br /> <br /> On the image below, you can see a clear example of a bullish Pennant chart pattern.<br /> <br /> <img alt="Trading example with a bullish Pennant pattern" src="/TMXWebsite/media/TMXWebsite/Trading-example-with-a-bullish-Pennant-pattern.png" /><br /> <br /> In this case, a rule of thumb for opening a position is to set the closing price of the breakout candle as an entry level and its opening price as a stop loss. However, if the opening price is just at the boundary of the breakout point, a stop should be placed slightly below this point. The general idea is that the price should not trade deeply into the pattern - if this happens, the pattern will fail, and the trader will generate a loss.<br /> <br /> For a target take-profit level, you can visually copy-paste the Pennant’s flagpole and place it at the breakout point. The end of it is where the uptrend will likely pause, stop or reverse.<br /> <br /> Risk-averse traders usually wait for one more bullish candle to close after the breakout to confirm the trend. This can mean a missed trading opportunity on the one hand, but on the other hand, it can prevent risk should the price move downward instead. The drawback with this approach is that the risk-to-reward ratio will be inferior. <h2>Trading with a bearish Pennant pattern</h2> A bearish Pennant works exactly the same way but in reverse. As a continuation chart pattern, it suggests a resumption of a downward price movement. Once the pattern is confirmed, traders tend to go short.<br /> <br /> The image below illustrates a bearish Pennant formed in a chart with a clear breakout through the bottom trendline.<br /> <br /> <img alt="Trading example with a bearish Pennant pattern" src="/TMXWebsite/media/TMXWebsite/Trading-example-with-a-bearish-Pennant-pattern.png" /><br /> <br /> Following a trading example with a bullish Pennant, risk-prone traders can use the closing price of the breakout candle as an entry and its opening price as a stop loss. The target price, or take profit level, can be set by copy-pasting the Pennant’s flagpole to the breakout point.<br /> <br /> If you study price charts, you will notice that quite often, the price breaks in the opposite direction – through the bottom trendline in a bullish Pennant or breakout through the upper trend line in a bullish version of it. When it happens, the patterns are considered invalid, as there is no clear indication of the price direction.<br /> <br /> That’s why it’s important to keep in mind that Pennant patterns, like any other chart pattern, don’t provide a guaranteed trading signal but only a suggestion. Experienced traders use additional tools, such as one- and two-candle patterns or technical indicators, to gain additional insights into the market conditions. It is also important to note that patterns in smaller timeframes, like the 5 or even 30 minute timeframes tend to have a lower success rate compared to a pattern formed on the 4-hour or daily chart.<br /> <br /> It can also be helpful to try trading with Pennants in a risk-free demo environment first and move to trading with real money when you gain confidence in your skills. Create a demo account now and start practising. If you want to know more about chart patterns, check out our next article, where we’ll talk about a unique pattern called a Cup and handle.