In this article, we will try to provide an outlook for the week ahead, we will try to provide the most important news and a simple technical analysis point of view for major financial assets to understand how we may deal with different probabilities.
Disclaimer and warning
All information provided in this report is based on public information and it may be canceled or updated at any time based on changes in prices and economic events.
Any opinions, news, research, analyses, prices or other information contained on this document is provided as general market commentary and does not constitute investment advice. ThinkMarkets will not accept liability for any loss or damage including, without limitation, to any loss of profit which may arise directly or indirectly from use of or reliance on such information.
Any decision that has been taken based on information in this report is your sole responsibility without any liability on ThinkMarkets.
Derivative products are leveraged products and can result in losses that exceed initial deposits. Please ensure you fully understand the risks and take care to manage your exposure and seek independent advice if necessary.
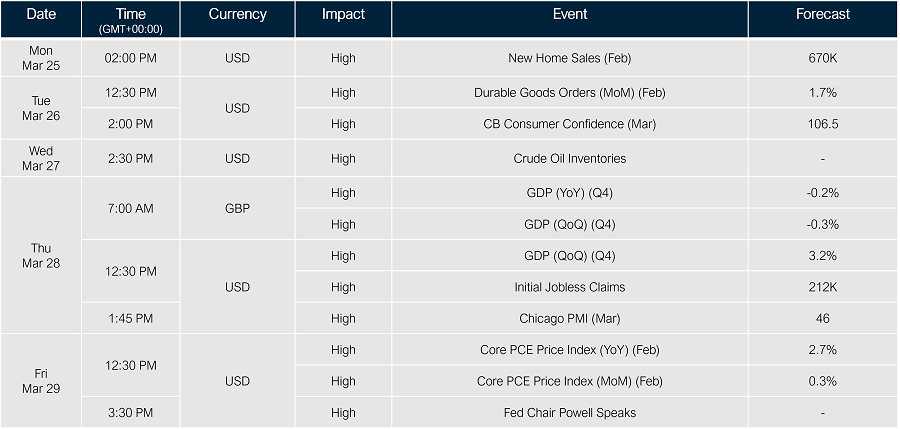
Hot news for the week
USD index
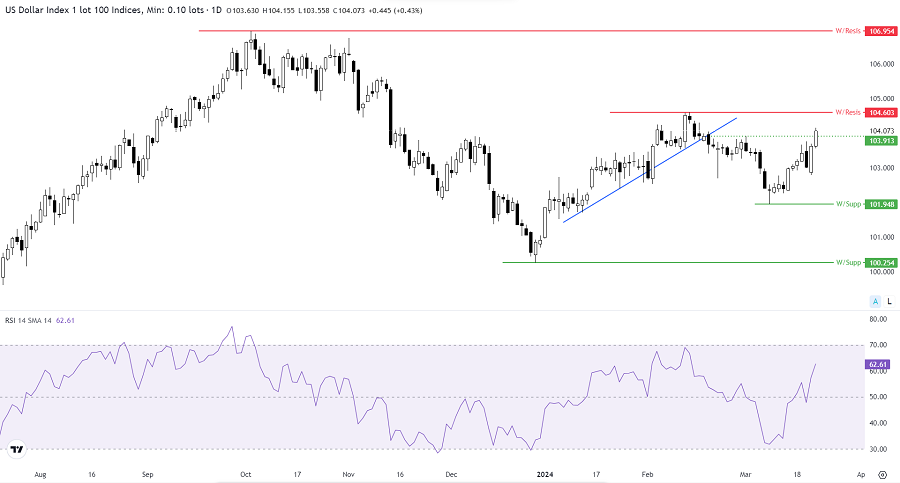
Looking at the price action on the daily chart of the US index, we mentioned in last week's outlook that the price could continue to rise to retest the 103.900 level, which it did last week. If buyers continue to control the market, the price might retest the 104.600 level.
Short-term view: If the price continues to trade above 104.600 it may be better to focus on buying positions or if it continues to trade below 101.948 it might be better to focus on selling positions.
EURUSD
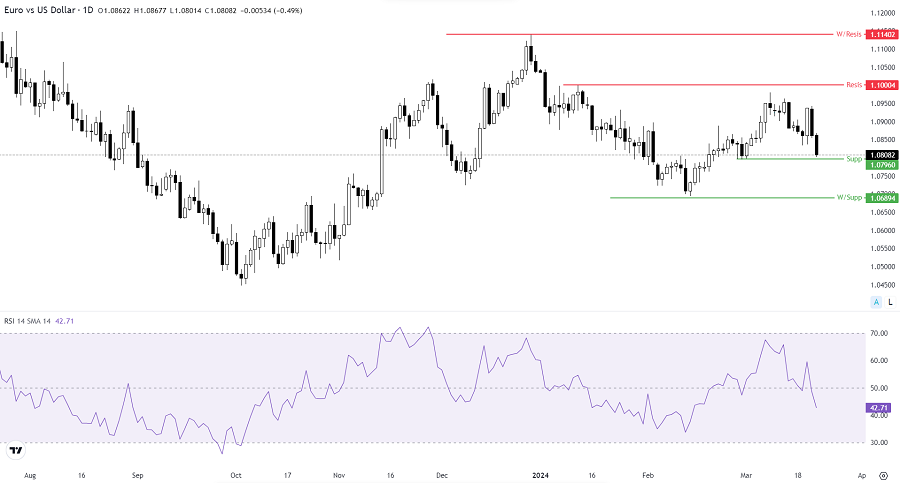
As we can see on the daily chart of the EURUSD, there is still a sideways movement between 1.11402 and 1.06894, which could indicate a balance between buyers and sellers and no clear trend.
Short-term view: It may be better to wait until we find a clear trend one way or the other above 1.11402 or below 1.06894.
USDJPY
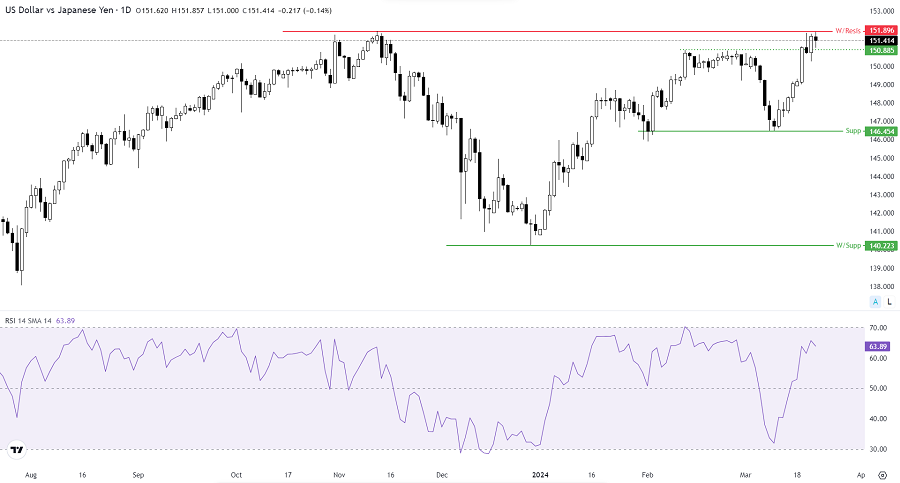
As we can see on the daily chart of the USDJPY, there was a bearish move after the pair bounced from below the weekly resistance level of 151.90. The pair continued to move lower, testing the 146.454 level and bouncing before reaching this level. There was a bullish move that confirmed the strength of the USD and after breaking above 150.885, it continued to test 151.90.
Short-term view: If prices break and continue to trade above 151.90, it may be better to focus on buying positions.
GBPUSD
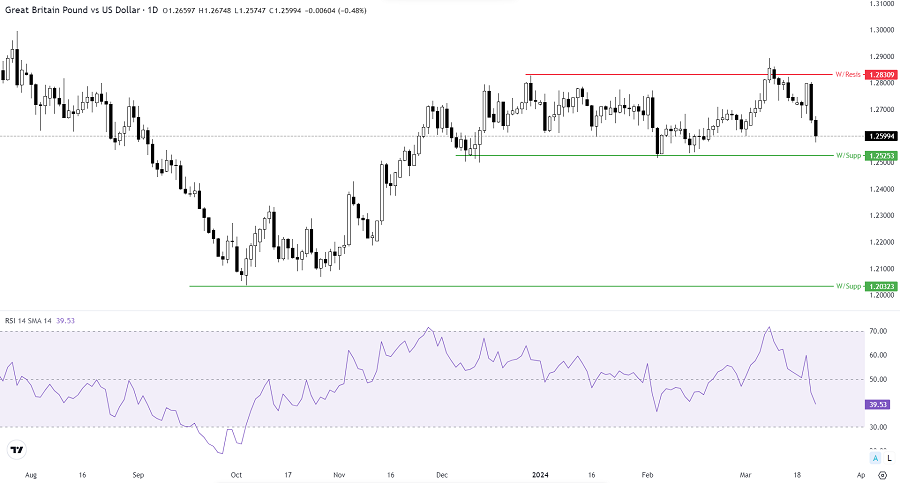
As we can see on the daily chart of the GBPUSD, the pair continues to trade sideways between 1.28310 and 1.25253, and after testing 1.28310, the pair fell back below this level.
Short-term view: It may be better to take trades between these sideways levels of 1.28310 and 1.25253 with high risk and trade management in mind or wait for a clear trend above 1.28310 to buy or below 1.25253 to sell.
USDCHF
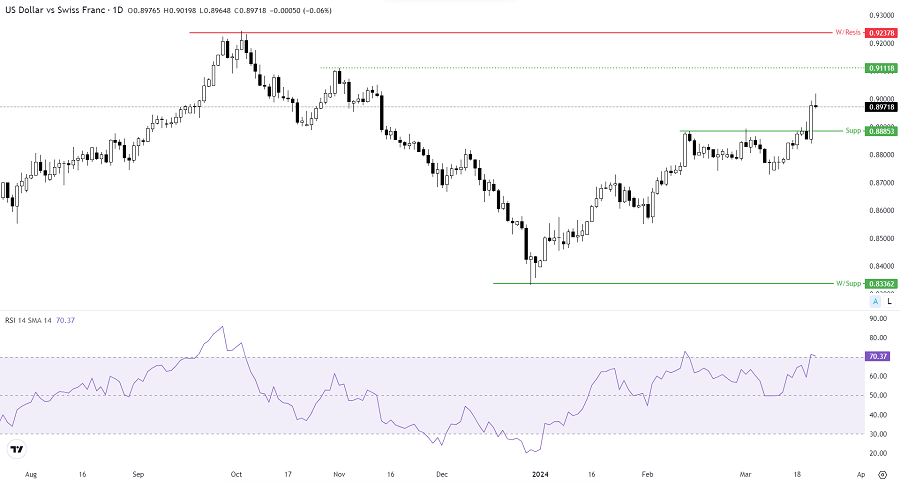
As we can see on the daily chart of the USDCHF, after breaking above the resistance level of 0.88853 which has become a support level, we may see a correction to test this support level before seeing more upside to test 0.91118 and 0.92380 if it continues to trade above this support level.
Short-term view: if it continues to trade above 0.88853, it might be better to focus on buying positions.
XAUUSD
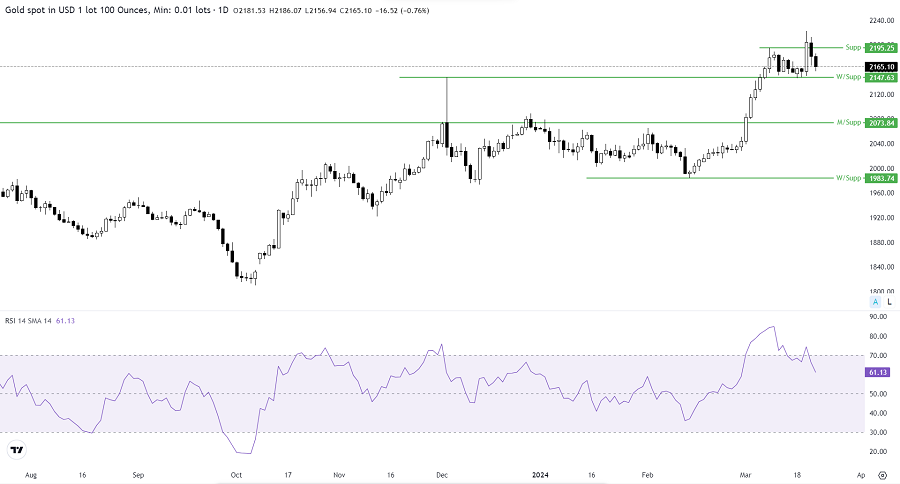
As we can see on the daily chart of Gold, After a correction to test the level of 2147.63 as we mentioned before the buyer appeared again to move up and the price broke above 2195.25 then moved down again below that level to announce that the sideways still in act.
Short-term view: It might be better to focus on buying positions if prices keep trading above the level of 2147.63.
Brent
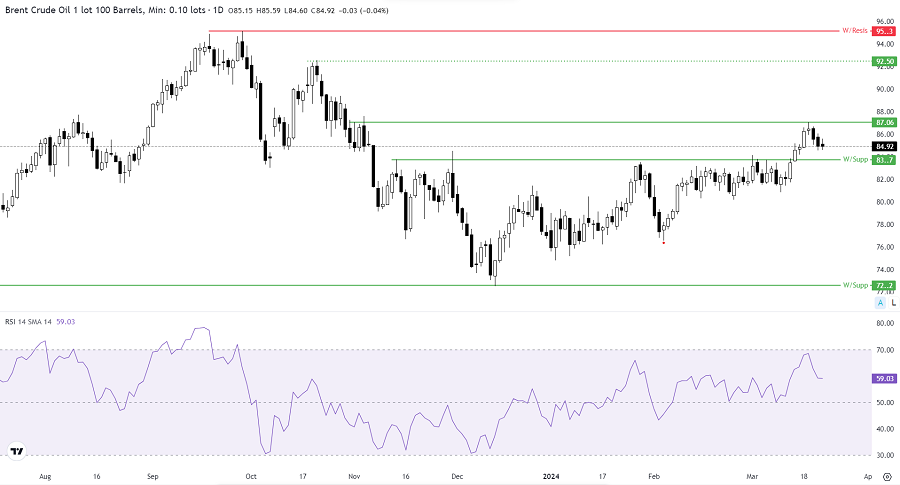
As we can see on the daily chart Brent, There was a break above 83.7 which was a weekly resistance before becoming a support. Prices moved up to 87.06 and it moved down from this level which might considered as a correction or take profit. So, it might be a retesting of the level of 83.7.
Short-term view: It might be better to focus on buying positions if prices keep trading above the level of 83.7 and rebound from this level.
US30
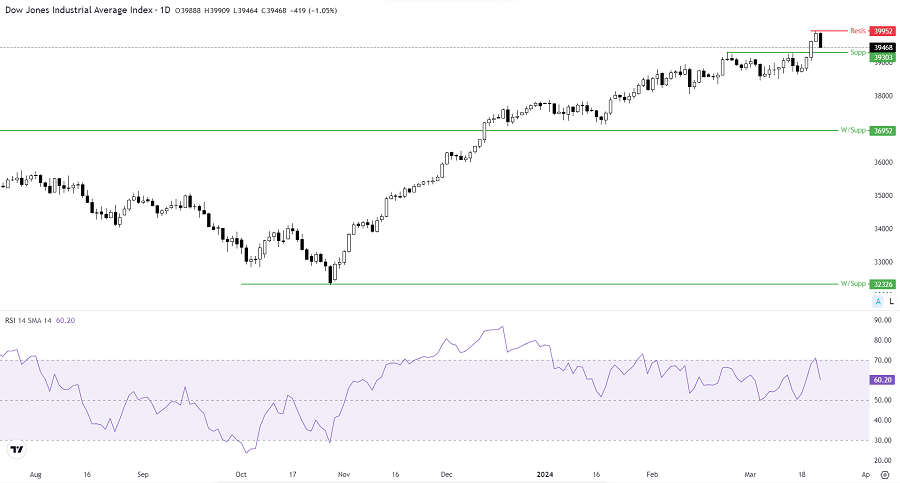
As we can see on the daily chart of the US30, after the sideways movement below the resistance level of 39303 the price moved up and broke above this level which became a support after this breakout. We saw a correction to test this 39303 support level after reaching to 39952 which became a resistance level.
Short-term view: It may be better to focus on buying positions if prices continue to trade above the 39303 support level.
NAS100
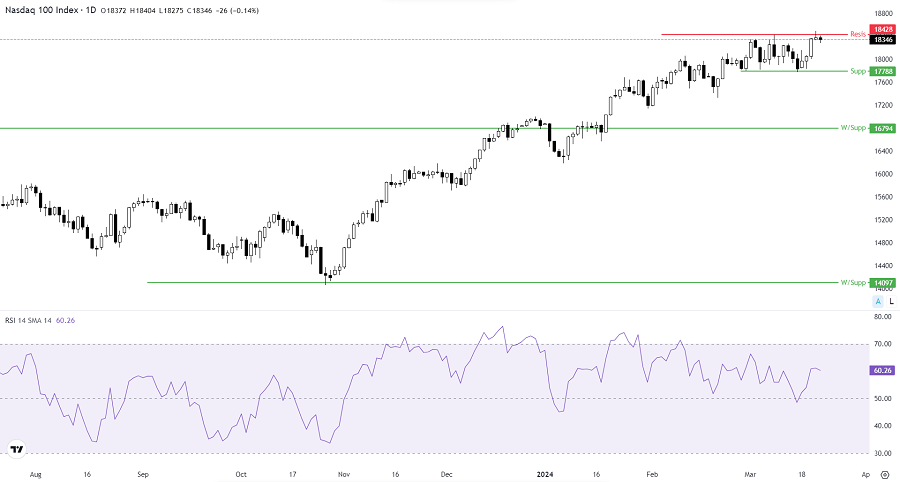
As we can see on the daily chart of the NAS100, there is still a sideways movement after a rebound below 18428, which could be seen as a correction after the last upward move. It could be a bearish move to retest the 17790 level.
Short-term view: It may be better to focus on buying positions when prices are above 18425 and continue to trade above it or 17790.
UK100
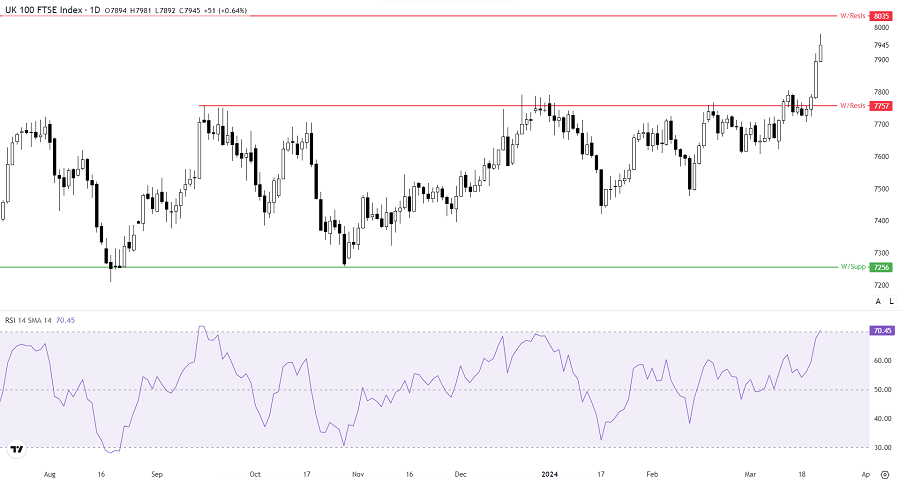
As we can see on the daily chart of the UK100, after a sideways movement between 7760 and 7250, buyers came out strongly to break above 7760, which was a good buying opportunity, as we mentioned in last week's outlook.
Short-term view: It may be better to wait for a correction around 7760 and buy after a rebound above it or above 8035 if it continues to trade above it.
BTCUSD
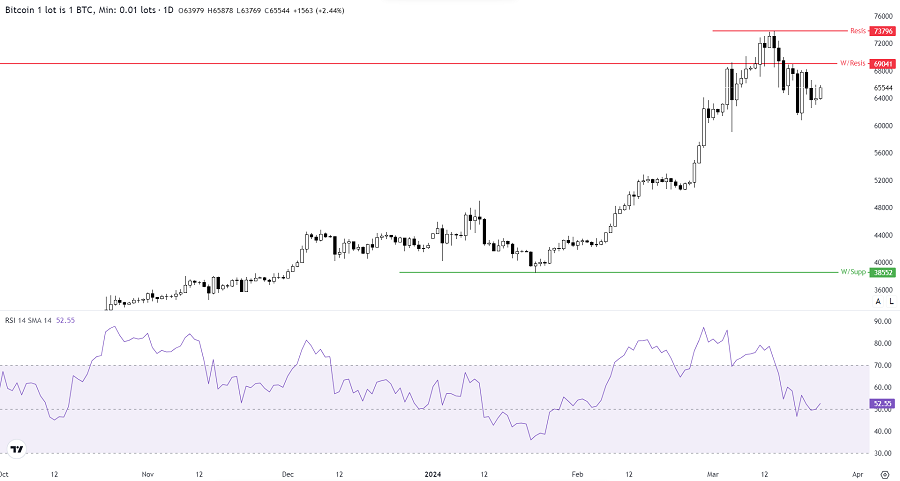
As we can see on the daily chart of the BTCUSD, there may be a correction after breaking the 69041 level, which was the highest price reached, to create a new price level at 73796.
Short-term view: It may be better to focus on buying positions above 69041 or 73796 when trading above these levels.
ETHUSD
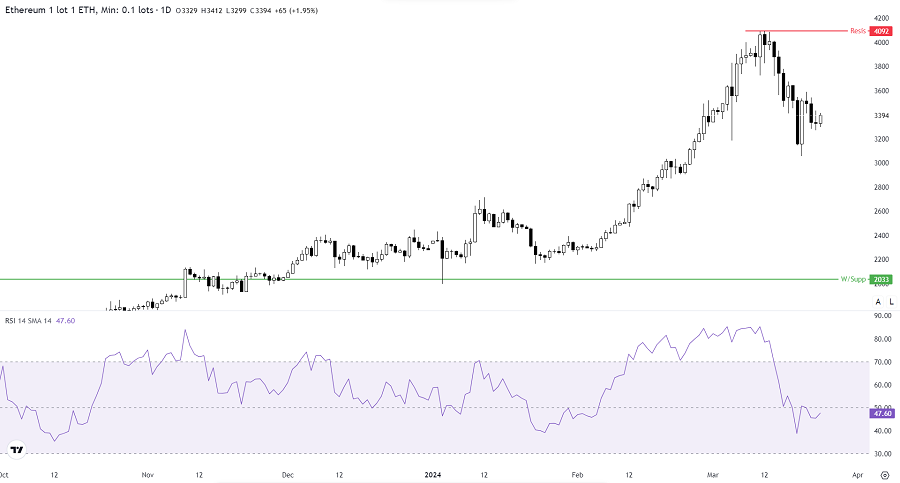
As we can see on the daily chart of ETHUSD, there has been a bullish move after breaking above the weekly resistance at 2033, which has become a support, meaning that this could be a profit-taking corrective move.
Short-term view: It might be better to focus on buying positions if prices trade above 4092 and continue to trade above it.
Any opinions, news, research, analyses, prices or other information contained on this website is provided as general market commentary and does not constitute investment advice. ThinkMarkets will not accept liability for any loss or damage including, without limitation, to any loss of profit which may arise directly or indirectly from use of or reliance on such information.